

Abstract
Hepatic proteins involved in xenobiotic pathways (Phases I, II, and III) are responsible for the metabolism and disposition of endogenous and exogenous compounds including dietary phytochemicals. To test the hypothesis that elevated α-tocopherol intakes alter gene expression of hepatic xenobiotic pathways, mice were fed diets supplemented with either 1000 IU (++E) or 35 IU (E) all-rac-α-tocopheryl acetate for 4 month, liver RNA was isolated and gene expression determined using both whole genome microarray and real-time quantitative PCR (RT-qPCR) analyses. Hepatic α-tocopherol (173 ± 18 vs. 21 ± 1 nmol/g, mean ± SE) and its metabolite (α-CEHC, 0.232 ± 0.046 vs. 0.031 ± .019 nmol/g) concentrations were ∼8-fold higher following the ++E dietary treatment. In ++E relative to E mice, gene expression of Phase I enzymes, P450 oxidoreductase and cytochrome P450 (Cyp) 3a11, increased 1.6- and 4.0-fold, respectively; two Phase II genes, sulfotransferase 2a and glutathione S-transferase mu 3, increased 10.8- and 1.9-fold respectively; and a Phase III biliary transporter, Abcb1a, doubled. Thus, consumption of high-level dietary α-tocopherol simultaneously coordinated Phase I, II and III gene expression. These data demonstrate that increased hepatic α-tocopherol modulates its own concentrations through increasing xenobiotic metabolism, a process that may alter metabolism of other foreign compounds, such as therapeutic drugs and phytochemicals, in humans.
Keywords: α-tocopherol, cytochrome P450, xenobiotic metabolism, MDR1, sulfotransferase, glutathione S-transferase
Introduction
Plants synthesize eight different molecules with vitamin E antioxidant activity, consisting of α-, β-, δ-, and γ-tocopherols and the corresponding four tocotrienols. Only α-tocopherol, not the others, is preferentially maintained in human plasma and tissues, as a result of the function of the hepatic α-tocopherol transfer protein (α-TTP) and increased metabolism of non-α-tocopherols relative to α-tocopherol (1). Unlike other fat-soluble vitamins, α-tocopherol is not accumulated in the body to toxic levels, suggesting that metabolism and excretion, are up-regulated to prevent excess α-tocopherol accumulation (2).
Hepatic enzymes and transporters responsible for the metabolism and excretion of various xenobiotic compounds are categorized in three phases. Phase I consists mainly of the cytochrome P450 (CYP) superfamily of enzymes responsible for the oxidation of numerous compounds, such as drugs, vitamins and environmental toxicants, thereby preparing them for conjugation by Phase II enzymes (3). Phase II enzymes include, but are not limited to, sulfotransferase (SULT), UDP-glucuronosyltransferase (UGT), and glutathione S-transferase (GST) superfamilies. The SULTs and UGTs catalyze sulfation and glucuronidation, respectively, of compounds with a hydroxyl group, or once a hydroxyl group has been added following its biotransformation by Phase I enzymes (4, 5). Key Phase III members are the ATP-binding cassette (ABC) superfamily of transporters that are responsible for excretion of xenobiotic compounds and/or their metabolites from the liver. ABC transporters expressed on hepatic canalicular membranes are the multidrug resistance (MDR) proteins, MDR1 (ABCB1, P-glycoprotein) and MDR3 (ABCB4), the multidrug resistance-related proteins 2 and 6 (MRP2, ABCC2; MRP6, ABCC6) and the breast cancer resistance protein (BCRP, ABCG2), as reviewed (6).
The proposed pathway of α-tocopherol metabolism, including an initial ω-oxidation catalyzed by the CYP system to form 13′-OH-α-tocopherol, was initially based on data from in vitro studies in which intermediate metabolites were isolated and identified from HepG2 cells and rat liver sub-cellular fractions incubated with various forms of vitamin E (7). Additional cell culture studies have shown that inhibitors of CYP activity inhibit tocopherol metabolism, thereby supporting the hypothesis that CYP enzymes are required for tocopherol metabolism. The formation of 13′-OH-α-tocopherol is followed by several steps of β-oxidation leading to the formation of α-CEHC (2,5,7,8-tetramethyl-2-(2′-carboxyethyl)-6-hydroxychroman), the major metabolite of α-tocopherol. α-CEHC is found in the liver, urine, plasma and bile (8, 9) in the free form and as either a sulfate or glucuronide conjugate (2, 10-12), thus suggesting a role for SULTs and UGTs in tocopherol disposition. Moreover Mdr2 (the mouse equivalent of rat and human MDR3), plays a key role in biliary α-tocopherol excretion (13). And MDR1 was found to be increased by elevated liver α-tocopherol (14). The role of various hepatic transporters in the secretion of CEHCs from the liver into bile or plasma have yet to be elucidated.
In studies using insect microsomes expressing recombinant human CYP enzymes, Sontag and Parker showed that CYP4F2 metabolized γ-tocopherol, and to a much lesser extent α-tocopherol, to their respective 13′-OH-tocopherol metabolites (7, 15). In contrast we found that in rats given daily subcutaneous (SQ) α-tocopherol injections (10 mg /100 g body wt) to overload liver α-tocopherol capacity, hepatic CYP4F protein levels were unchanged. Surprisingly, there was a significant increase in metabolism of α-tocopherol, as evidenced by a 20-fold increase in hepatic 13′-OH-α-tocopherol levels (14). Moreover, rat hepatic protein levels of CYP3A, 2B, and 2C family members increased (14). These alterations in Phase I enzymes were not limited to massive α-tocopherol overloading; dietary α-tocopherol appears to be sufficient to alter xenobiotic metabolism. Specifically, hepatic Cyp3a protein levels were higher in mice fed an α-tocopherol sufficient (31 mg/kg diet) as compared to an α-tocopherol deficient (<2mg/kg diet) diet. Indeed, hepatic Cyp3a protein and α-tocopherol concentrations were correlated (16).
To further examine the mechanisms of altered metabolism and disposition in response to α-tocopherol, we have studied rats given daily, SQ α-tocopherol injections (10 mg α-tocopherol/100 g body wt) for 18 days. Surprisingly, hepatic α-tocopherol and α-CEHC levels only increased up to day 9, then began to decrease (14); hepatic protein levels of CYP3A, 2B and 2C increased concurrently with the increase in α-tocopherol and α-CEHC levels, while MDR1 protein increased concurrently with the subsequent decrease in hepatic levels of both α-tocopherol and α-CEHC (14). These data indicated that mechanisms were in place to prevent the over-accumulation of α-tocopherol and that increasing α-tocopherol intakes, as well as administration of pharmacologic doses, modulate the expression of proteins involved in hepatic xenobiotic metabolism and excretion. However, the mechanism by which α-tocopherol might regulate these increases has not been investigated, nor has the extent to which α-tocopherol regulates all three phases of the hepatic xenobiotic pathways been investigated.
Alterations in hepatic xenobiotic pathways may occur at the gene level. Hepatic Cyp3a11 mRNA levels were elevated in mice fed 20 mg as compared with 2 mg α-tocopherol/kg diet; and were further increased in mice fed higher levels for a longer time (200 mg α-tocopherol/kg diet for 9 months) (17). Expression of other xenobiotic pathway genes was not determined (17).
Members of the CYP3A, 2B and 2C subfamilies are transcriptionally regulated by the nuclear receptors CAR (constitutive androstane receptor) and/or PXR (pregnane × receptor) (18, 19). In addition, PXR and CAR regulate MDR1 expression (20, 21). Nevertheless, in studies using HepG2 cells, Landes el al. (22) showed that α-tocopherol was among the least effective of the vitamin E forms tested for the ability to activate PXR and another study using primary hepatocytes showed that only tocotrienols, not tocopherols, activated PXR (23). Thus, the ability of α-tocopherol to alter xenobiotic pathways at the transcriptional level as a mechanism for increased hepatic CYP and MDR1 protein, with or without an involvement of nuclear receptors, as well as the number and extent to which additional genes involved in Phase I, II, and III are altered by increased hepatic α-tocopherol, requires further examination.
Based on the above observations, we hypothesized that α-tocopherol modulates hepatic xenobiotic pathways (Phase I, II, and III) by modulating gene expression and that determination of the specific subset of xenobiotic genes modulated by α-tocopherol would provide the necessary data for directing future experiments to investigate a role for nuclear receptors. To test this hypothesis we investigated the ability of elevated α-tocopherol intake to alter expression of genes involved in hepatic xenobiotic metabolism and excretion in mice using both whole genome microarray and real-time quantitative PCR (RT-qPCR) analyses.
Materials and methods
Reagents
HPLC-grade methanol, hexane, ethanol, and glacial acetic acid were obtained from Fisher (Fair Lawn, NJ). All other chemicals were obtained as reagent grade quality from suppliers.
Animal Studies
Several mouse isozymes of the Cyp3a family are gender specific and are only expressed in the livers of adult female mice, i.e., Cyp3a16, 3a41, and 3a44 (24, 25). In addition, increased hepatic Cyp3a protein showed a significantly higher degree of correlation with hepatic concentrations of α-tocopherol in female mice compared with male mice (16). Therefore, female mice were chosen for this study. The Oregon State University Animal Care and Use Committee approved all animal protocols.
Diets
An α-tocopherol deficient basal diet containing <10 IU α-tocopherol/kg diet, (Catalog #7248, Purina Test Diets, Richmond, IN) was supplemented by addition of the appropriate amounts of all-rac-α-tocopheryl acetate to produce two diets: (1) 35 IU all-rac-α-tocopherol/kg diet (control, E) and (2) 1000 IU all-rac-α-tocopherol/kg diet (supplemented, ++E).
Animals
Four-week-old female C57BL/6 mice (Charles River Laboratories, Wilmington, MA) were randomly assigned to either control (E) or supplemented (++E) diet, maintained on a 12-hour light/dark schedule and water and pelleted diet were allowed ad libitum for 4 months (n = 6/group). Mice were sacrificed by sodium pentobarbital injection, livers were rapidly removed, rinsed with saline, frozen in liquid N2 and stored at -80°C for analysis.
Measurement of α-Tocopherol and α-CEHC
A modification of the method by Podda et al. (26) was used for the analysis of α-tocopherol, as previously described (27). α-CEHC was extracted from liver followed by addition of an internal standard (trolox) and analysis by LC/MS as previously described (27).
RNA Extraction and GeneChip Hybridization
Frozen liver samples were placed in RNAlater®-ICE (Ambion, Austin, TX) overnight as directed by manufacturer. RNA was extracted from liver samples (∼20 mg) using the RNeasy Mini Kit per the manufacturer (Qiagen, Valencia, CA). RNA quantity was determined by spectroscopy and quality was determined by A260/A280 ratio and electrophoresis. RNA integrity screening, probe synthesis, hybridization and scanning were conducted by the Center for Genome Research and Biocomputing Core Laboratories, Oregon State University, using a separate Mouse 430 2.0 GeneChip (Affymetrix, Santa Clara, CA) for three individual animals per group as described in the GeneChip Expression Analysis Technical Manual (701021 Rev. 5; http://corelabs.cgrb.oregonstate.edu/affymetrix/citation). Although we were interested specifically in xenobiotic pathways, a whole genome array was chosen as commercially available focused arrays contain fewer members of each of the three phases of hepatic xenobiotic pathways than is found on the Mouse 430 2.0 GeneChip.
GeneChip Microarray Expression Analysis
GeneChip data was analyzed utilizing GeneSifter software (VizX Labs, Seattle, WA). GeneChip data was extracted, normalized and log base 2 transformed using GCRMA (28). Differential gene expression intensity was calculated between ++E and E groups using Pairwise Analysis (GeneSifter, VizX labs). Statistical significance was assessed by two-tailed Student's t test. Genes with a differential change in fold expression intensity ≥ 1.5 combined with a P < 0.05 were considered significant, n = 3 animals/dietary treatment with a separate genechip used for each animal.
Real-Time Quantitative PCR (RT-qPCR)
cDNA was generated from DNase treated RNA (5 μg) using the Superscript III First-strand Synthesis System for RT-PCR (Invitrogen, Carlsbad, CA) according to manufacturer's protocols. RT2 Primers (SuperArray, Frederick, MD) for each gene of interest, as well as the housekeeping gene, hypoxanthine guanine phosphoribosyl transferase 1 (Hprt1, Accession # NM_013556), were optimized for use on the Opticon 2 thermocycler (Bio-rad, Hercules, CA), per manufacturer. Melting curve analysis was used to confirm the presence of a single PCR product. cDNA from Universal Reference Total RNA (Mouse XpressRef, Cat# GA-005, SuperArray) was serial diluted starting with 200 ng RNA equivalence, down to 1.56 ng RNA equivalence, and used to determine the amplification efficiencies for all primer sets in comparison to the primer set for the housekeeping gene. Hprt1 was used as the housekeeping gene as it was determined by GeneChip analysis that, unlike β-actin and GAPDH, the expression of Hprt1 was unchanged in the ++E animals as compared to the E animals.
Replicate RNA samples from a control and a supplemented mouse were included on the same plate for analysis with the primers for one gene of interest, as well as primers for the Hprt1 gene to ensure that changes observed were not due to plate differences. In addition, cDNA generated from the Universal Reference Total RNA (SuperArrary) and relevant primers for the gene of interest and Hprt1 housekeeping gene were included on each plate as a between plate control. RT-qPCR was performed according to SuperArray protocols using RT2 Real-Timetm SYBR Green PCR Master Mix (SuperAray). Presence of double-stranded DNA PCR product was monitored using the Chroma4 Real Time PCR detection system (MJ Research, Waltham, MA). The average transcript expression for each gene of interest was determined for individual mice and normalized to the average transcript expression of Hprt1 for that mouse, as described in (29). The fold-change in transcript expression for each gene was determined in ++E mice relative to E mice using the 2-ΔΔCt method and standard propagation of error methods as described (29, 30).
Statistical analysis
α-Tocopherol, α-CEHC and RT-qPCR data were log transformed to normalize unequal variances between groups and analyzed by two-tailed Student's t test using Prism version 4.0 (Graphpad Software, San Diego, CA). Microarray data was analyzed by two-tailed Student's t test using GeneSifter software (VizX Labs). All data are expressed as mean ± SE with a value of P < 0.05 considered significant.
Results
α-Tocopherol and α-CEHC Concentrations
Mice were fed either control (E) or α-tocopherol supplemented (++E) diets for 4 months, sacrificed and livers harvested. Hepatic α-tocopherol concentrations increased 8-fold in response to the ++E diet (Figure 1A); α-CEHC levels in ++E mice also increased nearly 8-fold compared with those from E mice (Figure 1B). Clearly, hepatic conversion of α-tocopherol to a-CEHC was increased.
Fig. 1.
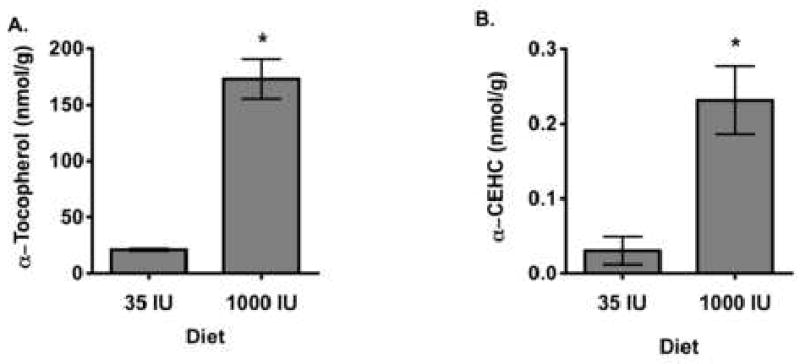
Hepatic a-tocopherol and α-CEHC concentrations in mice fed diet containing either 35 (E) or 1000 IU (++E) all-rac-α-tocopheryl acetate/kg diet. (A) Hepatic α-tocopherol and (B) Hepatic α-CEHC. Mice were fed either E or ++E diets for 4 m, then euthanized, tissues were excised and aliquots frozen in liquid nitrogen and stored at -80°C. α-Tocopherol and α-CEHC concentrations (nmol/g) were determined as described in Methods. All values are expressed as mean ± SE, ∗ = P < 0.01 compared to E mice (n = 6 mice/dietary treatment).
Gene Expression Data
Expression of 61 genes was increased by ≥ 1.5-fold, while expression of 24 genes were decreased by ≥ 1.5-fold, in ++E compared with E mice (see Supplementary Materials), as evaluated by statistical analysis of the normalized, log2 transformed intensity data from the 34,000 genes present on the Mouse 430 2.0 GeneChip. Our focus was on xenobiotic pathways, of which among these 85 genes that were changed in response to increased hepatic α-tocopherol were 9 genes associated with hepatic Phase I, II, and III pathways, including nuclear receptors, PXR and CAR (Table 1).
Table 1.
Genes involved in hepatic xenobiotic metabolism and excretion that were significantly altered in expression by dietary α-tocopherol supplementation (P < 0.05).
| Gene name | Gene ID | GenBank | Expression Intensity 1 (35 IU) |
Expression Intensity 1 (1000 IU) |
Fold-change2 | Direction |
|---|---|---|---|---|---|---|
| Sulfotransferase 2a | Sult2a | NM_009286 | 11.40 ± 0.54 | 14.84 ± 0.59 | 10.8 | up |
| ABC, sub-family B, member 1a | Mdr1a† | M30697 | 6.77 ± 0.15 | 7.70 ± 0.28 | 1.9 | up |
| Glutathione S-transferase, mu 3 | Gstm3 | J03953 | 7.00 ± 0.13 | 7.93 ± 0.26 | 1.9 | up |
| Constitutive Androstane receptor | Car | AS009328 | 11.69 ± 0.15 | 12.58 ± 0.19 | 1.8 | up |
| Pregnane X receptor | Pxr | AF031814 | 9.09 ± 9.09 | 9.74 ± 0.05 | 1.6 | up |
| P450 oxidoreductase | Por | NM_008898 | 12.49 ± 0.10 | 13.15 ± 0.07 | 1.5 | up |
| Cytochrome P450 3a11 | Cyp3a11 | BC010528 | 13.97 ± 0.13 | 14.37 ± 0.02 | 1.3 | up |
| Squalene epoxidase | Sqle | NM_009270 | 10.59 ± 0.08 | 9.16 ± 0.02 | 2.7 | down |
| Cytochrome P450 7b1 | Cyp7b1 | NM_007825 | 11.56 ± 0.13 | 10.53 ± 0.22 | 2.2 | down |
Mice were fed a diet containing either 35 IU or 1000 IU all-rac-α-tocopherol/kg diet, hepatic RNA was prepared and gene expression was determined by microarray analysis using the Mouse 430 2.0 GeneChip and GeneSifter Software as described in Methods.
Mdr1a is also referred to as Abcb1a.
Expression intensities are expressed as mean ± SE of log2 transformed data (arbitrary units), n = 3 / dietary treatment.
Fold-change in expression intensity is expressed for 1000 IU group relative to 35 IU group.
The ω-hydroxylation of the side chain of the vitamin E molecule is the initial step in its metabolism; we therefore examined the responses of cytochrome P450 genes to increased α-tocopherol. Gene expression of Cyp3a11 in ++E mice was 1.3-fold greater than E mice, a statistically significant increase (Table 1, P < 0.05); while mRNA levels of Cyp3a13, 16, 25, 41, and 44 isoforms were unchanged (Figure 2). Additionally, gene expression levels of Cyp2b and 2c isoforms, as well as isoforms of the Cyp1a, 1b, and Cyp2e families, were unchanged by dietary treatment (Figure 2). However, P450 oxidoreductase (Por) supplies reducing equivalents to the Cyp enzymes and its gene expression increased 1.6-fold (P < 0.05) with α-tocopherol supplementation (Table 1).
Fig. 2.
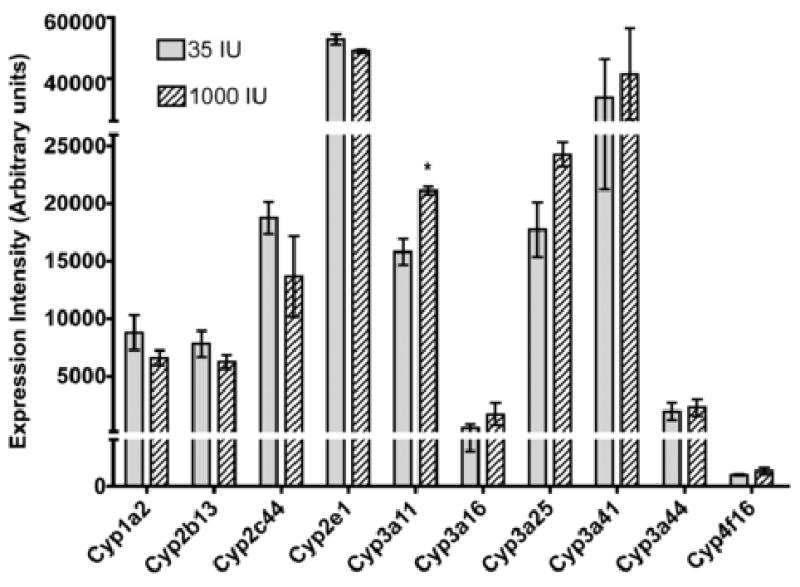
Expression intensity of hepatic cytochrome P450 genes involved in the metabolism of pharmaceutical and environmental agents§. Hepatic mRNA prepared individually from each mouse fed either E or ++E diet was hybridized to a separate Mouse 430 2.0 Affymetrix GeneChip and subjected to microarray analysis, as described in Methods. The expression intensity data (arbitrary units, AU) are expressed as mean ± SE (n=3 mice/dietary treatment), ∗ = P < 0.01 compared to E mice. §Expression intensities for the following Cyp isozymes were below 1000 units in ++E mice and did not significantly differ from E mice: 1a1, 1b1, 2b10, 2c39, and 4f18.
Human CYP4F2 has been shown in vitro to catalyze the first step in tocopherol metabolism (7, 15); thus, we were interested to determine the ability of increased hepatic α-tocopherol levels in mice to modulate Cyp4f isoforms. Remarkably, Cyp4f isoform gene expression was unchanged (Figure 2).
Phase II responses were also examined because α-CEHC is excreted from the body as either sulfate or glucuronide conjugates (10-12, 31). Interestingly, α-tocopherol supplementation resulted in a 10.8-fold increase (P < 0.05) in gene expression of the phase II enzyme sulfotransferase 2a (Sult2a) compared to expression in E mice (Table 1). Expression of an additional phase II gene, glutathione S-transferase mu3 (Gstm3) increased 1.9-fold with α-tocopherol supplementation (Table 1, P < 0.05).
Phase III transporters may also be involved in the disposition of vitamin E. The gene expression of the biliary transport protein Mdr1a (Abcb1a) increased 2.2-fold in ++E mice (Table 1, P < 0.05). In contrast, the gene expression of other biliary ABC transporters, mdr1b (Abcb1b), mdr2 (Abcb4), as well as Abcc2, Abcc6 and Abcg2, were unchanged.
The nuclear receptors, CAR and PXR, regulate the expression of several proteins involved in xenobiotic metabolism and disposition, including CYPs 2B and 3A, and MDR1, proteins that we have found to be increased in rats with supra-physiologic hepatic α-tocopherol concentrations (14, 18, 19, 32). Car gene expression increased 1.8-fold and Pxr gene expression increased 1.6-fold in ++E compared with E mice (Table 1, P < 0.05).
Real-Time Quantitative PCR Outcomes
To confirm the gene expression results obtained from the microarray experiments described above, RT-qPCR was performed using hepatic RNA isolated from mice fed either the ++E or E diet. Although some of the transcript expression fold-changes determined by RT-qPCR differ slightly from the microarray expression data, changes in expression occurred in the same direction.
Phase I genes were confirmed by RT-qPCR analysis to be modulated by α-tocopherol supplementation (Figure 3). Specifically, α-tocopherol supplementation increased Cyp3a11 by 4.0 ± 0.36-fold and Por expression increased by 1.5 ± 0.7-fold (P < 0.05). Additionally, the expression of Cyp1a1, a Phase I gene whose expression was unchanged as determined by microarray analysis (Figure 2), was also unchanged using RT-qPCR analysis (Figure 3). Moreover, two genes that were found to be decreased by microarray analysis were also decreased by RT-qPCR analysis. By microarray analysis, Cyp7b1 decreased 2.2-fold and squalene epoxidase (Sqle) decreased 2.7-fold in ++ E mice (Table 1), while by RT-qPCR analysis Sqle decreased 4.0 ± 0.37-fold (P < 0.01) and Cyp7b1 decreased 1.7 ± 0.3 fold (P < 0.05) (Figure 3).
Fig. 3.
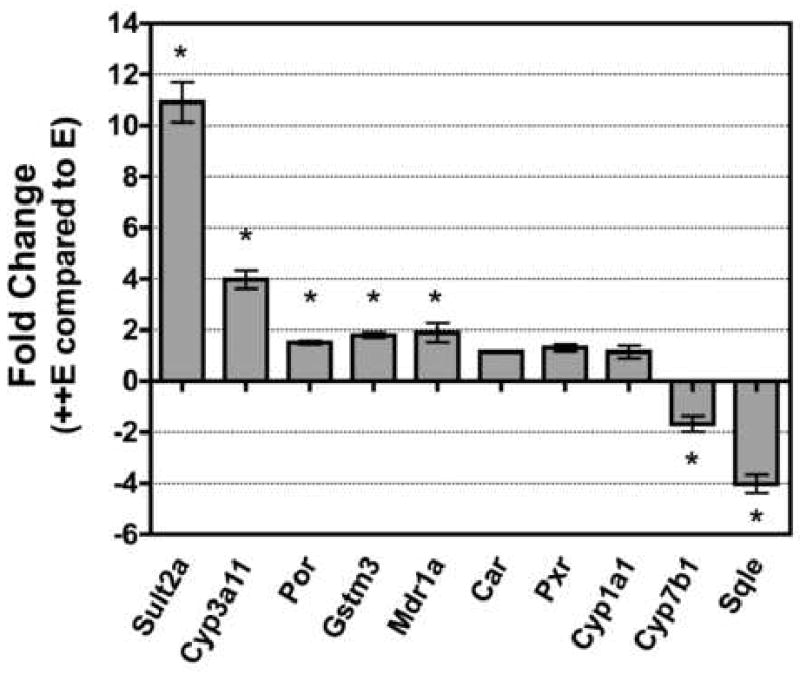
Transcript expression levels of genes involved in hepatic xenobiotic pathways (Phases I, II, and III) as determined by RT-qPCR. cDNA individually generated from hepatic RNA from E and ++E mice was subjected to RT-qPCR analysis (see Methods). Replicate samples were analyzed from each mouse with primers for each gene listed in Table 1, as well as CYP1a1 and the housekeeping gene Hprt1. The average transcript expression for each gene was determined for individual mice and normalized to the average transcript expression of Hprt1 for that mouse, as described in Methods. The fold-change in transcript expression for each gene was determined in ++E mice relative to E mice using the 2-ΔΔCt method and standard propagation of error methods as described in Methods and (29). Data are expressed as mean ± SE (n = 3 mice/dietary treatment), ∗ = P < 0.05 compared with E mice.
RT-qPCR analysis also shows similar increased expression of the Phase II enzymes Sult2a (10.9 ± 0.8-fold) and Gstm3 (1.8 ± 0.1-fold) in ++E mice compared to E mice (Figure 3, P < 0.01) that are in agreement with the microarray expression data. Also in agreement with the microarray expression data is the 1.9 ± 0.3-fold increase in the expression of the Phase III transporter Mdr1a in ++E mice (Figure 3, P < 0.05).
However, in contrast to the microarray expression data, the RT-qPCR results indicate that gene expression of the two nuclear receptors Car (1.1 ± 0.02) and Pxr (1.3 ± 0.13) was not significantly different in ++E mice compared to E mice (Figure 3).
Discussion
In support of our hypothesis that excess vitamin E up-regulates xenobiotic metabolism at the level of gene expression, we found that elevated dietary α-tocopherol intakes in mice result in increased expression of genes encoding proteins involved in hepatic Phase I, II, and III xenobiotic pathways. Previously, we found in studies using mice fed diets deficient in α-tocopherol compared to diets containing sufficient amounts of α- or γ-tocopherols that Cyp3a protein levels increased with increasing hepatic α-tocopherol levels (16).
Interestingly, Cyp3a11 transcript expression increased significantly in ++E mice, while the transcript expression of Cyp2b and Cyp2c isoforms was not altered following α-tocopherol supplementation. These data suggest that the mechanism by which α-tocopherol increases hepatic Cyp3a protein levels involves increased gene transcription and occurs with a 8-fold increase in hepatic α-tocopherol achieved by dietary α-tocopherol supplementation. On the other hand, hepatic α-tocopherol levels were increased 70-fold following the daily SQ α-tocopherol injections that resulted in increased hepatic CYP2B and CYP2C proteins (14). Thus the mechanism by which increased hepatic α-tocopherol increases CYP2B and CYP2C protein levels may require hepatic α-tocopherol levels that are only attained when α-tocopherol is given by a non-oral route, suggesting that the intestine may limit α-tocopherol absorption.
In studies using recombinant human proteins expressed in insect microsomes, CYP4F2 was identified as the putative tocopherol ω-hydroxylase (7) and as such may be expected to increase under conditions of increased tocopherol metabolism. In our current study, hepatic transcript expression of Cyp4f isoforms was unchanged, similar to our studies of CYP4F protein in rats (14, 33). Together these results suggest that elevated hepatic α-tocopherol does not modulate the expression of CYP4F family members at either the protein or mRNA level in rodents.
Modulation by α-tocopherol of genes involved in hepatic Phase II xenobiotic metabolism to our knowledge has not been previously reported. Following ω-hydroxylation by Phase I enzymes, α-tocopherol undergoes several steps of β-oxidation to form α-CEHC. It has yet to be determined at what step along the metabolic pathway either sulfation or glucuronidation by Phase II enzymes occurs, but α-CEHC is excreted as sulfated or glucuronidated conjugates (2, 10, 34, 35). In addition, sulfated conjugates of intermediate α-tocopherol metabolites have been identified in rat liver and human lung cancer cell lines (12). Our data show that gene expression of the Phase II enzymes, Sult2a and Gstm3, but not those of Ugts, was increased in E++ mice. The respective amounts of glucuronidated and sulfated α-CEHC in urine and/or bile in mice have not to date been reported. Thus it is possible that the up-regulation of Sult enzymes in mice may reflect the preferred pathway of conjugation in mice.
GSTs catalyze the conjugation of glutathione to compounds containing an electrophilic carbon, nitrogen or sulfur atom and are responsible for the detoxification of numerous exogenous compounds including drugs, pesticides, environmental pollutants and carcinogens, as well as endogenous by-products of oxidative stress (36). In α-tocopherol supplemented rats compared with controls, GST activity increased nearly 2-fold towards CDNB (1-chloro-2,4-dinitrobenzene, a substrate used to measure total GST activity), and, increased nearly 3-fold towards DCNB (1,2-dichloro-4-nitrobenzene, a substrate considered specific for GST mu class enzymes) (37, 38). These data are in agreement with the increased mRNA expression of Gstm3 in our study and together suggest that α-tocopherol modulates GST by increasing mRNA expression. To our knowledge glutathione-vitamin E conjugates have not to date been detected.
The Phase III MDR1 (ABCB1) transport protein is responsible for biliary excretion of a diverse array of xenobiotics, including numerous pharmaceutical drugs and environmental toxicants (39). Hepatic MDR1 shares many substrates with CYP3A enzymes and conversely many compounds simultaneously modulate both MDR1 and CYP3A (18, 40). Rats and humans have one MDR1 gene, while mice have two Mdr1 genes, Mdr1a (Abcb1a) and Mdr1b (Abcb1b). Our data show that gene expression of both Cyp3a11 and Mdr1a are increased in mice supplemented with α-tocopherol. This is in agreement with the increased protein expression of hepatic CYP3A and MDR1 in rats given SQ injections of α-tocopherol (14). Thus, modulation of hepatic CYP3A and MDR1 by α-tocopherol may occur by a mechanism that is conserved across species and involves regulation of transcription, perhaps at the nuclear receptor level.
The gene array data suggested increases in both CAR and PXR, although our RT-qPCR data indicate that hepatic gene expression of CAR and PXR was unchanged by α-tocopherol supplementation. Thus, it is unclear if CAR or PXR genes are up-regulated. However, transcriptional activation of genes by either CAR or PXR does not require an increase in the expression of these receptors (18). Thus our results do not preclude a role for these nuclear receptors in the modulation of gene expression by α-tocopherol.
Nuclear receptors regulate genes representing all three phases of xenobiotic metabolism and excretion (18). In addition to PXR and CAR, the aryl hydrocarbon receptor (AhR) also modulates the inducible expression of CYP genes, the most highly characterized of which is the modulation of CYP1A and CYP1B subfamilies (41, 42). However our data indicate that hepatic transcript levels of Cyp1a1, 1a2, and 1b, were unchanged by α-tocopherol supplementation. This is in agreement with hepatic protein levels of the CYP1A subfamily that were unchanged by SQ administration of α-tocopherol (33). Lack of induction of the Cyp1 family in both these studies suggests that α-tocopherol does not modulate xenobiotic pathways via the AhR. On the other hand, PXR and CAR have overlapping specificity with respect to hepatic up-regulation of CYP3A, CYP2B and CYP2C subfamilies, Por, GST mu, MDR1 and Mdr1a (18, 19, 21, 32, 43, 44). The specific subset of Phase I, II, and III genes modulated in the current study supports a role for PXR and/or CAR. However, the low level of PXR activation by α-tocopherol reported in HepG2 cells (22) and inability of α-tocopherol to activate PXR in primary hepatocytes (23), in combination with the data reported herein, suggest that CAR is the more likely candidate nuclear receptor to play a role in the mechanism by which α-tocopherol modulates xenobiotic gene expression. Thus, our gene array data has provided important clues for the further analysis of nuclear receptors in the regulation of xenobiotic metabolism by α-tocopherol.
In summary, our results indicate that α-tocopherol modulates the gene expression of a subset of hepatic proteins involved in xenobiotic metabolism and excretion (Phases I, II, and III). Induction by α-tocopherol of these pathways warrants further experimentation as alterations in xenobiotic metabolism and disposition could alter the efficacy of therapeutic drugs. In addition, CYPs, SULTs, and GSTs, are involved in the metabolism of phytochemicals, such as phylloquinone, tocotrienols and alkylresorcinols (45-47). Thus induction of this battery of genes by α-tocopherol may alter the metabolism of other phytochemicals. These data provide unique insight into the regulatory role of vitamin E in the liver.
Supplementary Material
Supplemental Table 1. Genes from the Mouse 430 2.0 GeneChip that were significantly altered in expression by dietary α-tocopherol supplementation (P < 0.05).
Acknowledgments
This work was supported by a grant to MGT and DJM (ODS and NIH DK 067930), grants to CEC and MGT (NIH ES011985 and USDA NRI 2003-009515) and pilot grants to KG (Clinical Nutritional Research Unit and Center for Human Nutritional Research, University of California, and Philip Morris USA). The authors would also like to thank Valerie Elias and Rachel Haefling for their technical assistance.
Abbreviations
- CEHC
carboxyethyl hydroxychroman
- α-CEHC
2,5,7,8-tetramethyl-2-(2′-carboxyethyl)-6-hydroxychroman
- CMBHC
- CYP
cytochrome P450
- αTTP
α-tocopherol transfer protein
- MDR
multidrug resistance
- LC-MS
liquid chromatography-mass spectrometry
- TBS
tris-buffered saline
- ATP-binding cassette transport protein
ABC transport protein
- GST
glutathione S-transferase
- SULT
sulfotransferase
- UGT
UDP-glucuronosyltransferase
- AhR
aryl hydrocarbon receptor
- Sqle
squalene epoxidase
- Por
P450 oxidoreductase
- CAR
constitutive androstane receptor
- PXR
pregnane × receptor
- TCPOBOP
1,4-bis[2-(3,5-dichloropyridyxloxy)] benzene
- CDNB
1-chloro-2,4-dinitrobenzene
- DCNB
1,2-dichloro-4-nitrobenzene
Footnotes
Publisher's Disclaimer: This is a PDF file of an unedited manuscript that has been accepted for publication. As a service to our customers we are providing this early version of the manuscript. The manuscript will undergo copyediting, typesetting, and review of the resulting proof before it is published in its final citable form. Please note that during the production process errors may be discovered which could affect the content, and all legal disclaimers that apply to the journal pertain.
References
- 1.Traber MG. Vitamin E regulatory mechanisms. Annu Rev Nutr. 2007;27:347–362. doi: 10.1146/annurev.nutr.27.061406.093819. [DOI] [PubMed] [Google Scholar]
- 2.Schultz M, Leist M, Petrzika M, Gassmann B, Brigelius-Flohé R. Novel urinary metabolite of alpha-tocopherol, 2,5,7,8-tetramethyl-2(2′-carboxyethyl)-6-hydroxychroman, as an indicator of an adequate vitamin E supply? Am J Clin Nutr. 1995;62(suppl):1527S–1534S. doi: 10.1093/ajcn/62.6.1527S. [DOI] [PubMed] [Google Scholar]
- 3.Guengerich FP. Cytochromes P450, drugs, and diseases. Mol Interv. 2003;3:194–204. doi: 10.1124/mi.3.4.194. [DOI] [PubMed] [Google Scholar]
- 4.Chapman E, Best MD, Hanson SR, Wong CH. Sulfotransferases: structure, mechanism, biological activity, inhibition, and synthetic utility. Angew Chem Int Ed Engl. 2004;43:3526–3548. doi: 10.1002/anie.200300631. [DOI] [PubMed] [Google Scholar]
- 5.Tukey RH, Strassburg CP. Human UDP-glucuronosyltransferases: metabolism, expression, and disease. Annu Rev Pharmacol Toxicol. 2000;40:581–616. doi: 10.1146/annurev.pharmtox.40.1.581. [DOI] [PubMed] [Google Scholar]
- 6.Schinkel AH, Jonker JW. Mammalian drug efflux transporters of the ATP binding cassette (ABC) family: an overview. Adv Drug Deliv Rev. 2003;55:3–29. doi: 10.1016/s0169-409x(02)00169-2. [DOI] [PubMed] [Google Scholar]
- 7.Sontag TJ, Parker RS. Cytochrome P450 omega-hydroxylase pathway of tocopherol catabolism: Novel mechanism of regulation of vitamin E status. J Biol Chem. 2002;277:25290–25296. doi: 10.1074/jbc.M201466200. [DOI] [PubMed] [Google Scholar]
- 8.Brigelius-Flohé R, Traber MG. Vitamin E: function and metabolism. FASEB J. 1999;13:1145–1155. [PubMed] [Google Scholar]
- 9.Kiyose C, Saito H, Kaneko K, Hamamura K, Tomioka M, Ueda T, Igarashi O. Alpha-tocopherol affects the urinary and biliary excretion of 2,7,8-trimethyl-2 (2′-carboxyethyl)-6-hydroxychroman, gamma-tocopherol metabolite, in rats. Lipids. 2001;36:467–472. doi: 10.1007/s11745-001-0744-2. [DOI] [PubMed] [Google Scholar]
- 10.Stahl W, Graf P, Brigelius-Flohe R, Wechter W, Sies H. Quantification of the alpha- and gamma-tocopherol metabolites 2,5,7,8-tetramethyl-2-(2′-carboxyethyl)-6-hydroxychroman and 2,7,8-trimethyl-2-(2′-carboxyethyl)-6-hydroxychroman in human serum. Anal Biochem. 1999;275:254–259. doi: 10.1006/abio.1999.4312. [DOI] [PubMed] [Google Scholar]
- 11.Pope SA, Burtin GE, Clayton PT, Madge DJ, Muller DP. Synthesis and analysis of conjugates of the major vitamin E metabolite, alpha-CEHC. Free Radic Biol Med. 2002;33:807–817. doi: 10.1016/s0891-5849(02)00974-7. [DOI] [PubMed] [Google Scholar]
- 12.Jiang Q, Freiser H, Wood KV, Yin X. Identification and quantification of novel vitamin E metabolites, sulphated long-chain carboxychromanols, in human A549 cells and rats. J Lipid Res. 2007;48:1221–1230. doi: 10.1194/jlr.D700001-JLR200. [DOI] [PMC free article] [PubMed] [Google Scholar]
- 13.Mustacich DJ, Shields J, Horton RA, Brown MK, Reed DJ. Biliary secretion of alpha-tocopherol and the role of the mdr2 P-glycoprotein in rats and mice. Arch Biochem Biophys. 1998;350:183–192. doi: 10.1006/abbi.1997.0529. [DOI] [PubMed] [Google Scholar]
- 14.Mustacich DJ, Leonard SW, Devereaux MW, Sokol RJ, Traber MG. α-Tocopherol regulation of hepatic cytochrome P450s and ABC transporters in rats. Free Radic Biol Med. 2006;41:1069–1078. doi: 10.1016/j.freeradbiomed.2006.06.022. [DOI] [PubMed] [Google Scholar]
- 15.Sontag TJ, Parker RS. Influence of major structural features of tocopherols and tocotrienols on their omega-oxidation by tocopherol-omega-hydrolase. J Lipid Res. 2007;48:1090–1098. doi: 10.1194/jlr.M600514-JLR200. [DOI] [PubMed] [Google Scholar]
- 16.Traber MG, Siddens LK, Leonard SW, Schock B, Gohil K, Krueger SK, Cross CE, Williams DE. α-Tocopherol modulates Cyp3a expression, increases γ-CEHC production and limits tissue γ-tocopherol accumulation in mice fed high γ-tocopherol diets. Free Radic Biol Med. 2005;38:773–785. doi: 10.1016/j.freeradbiomed.2004.11.027. [DOI] [PubMed] [Google Scholar]
- 17.Kluth D, Landes N, Pfluger P, Muller-Schmehl K, Weiss K, Bumke-Vogt C, Ristow M, Brigelius-Flohe R. Modulation of Cyp3a11 mRNA expression by alpha-tocopherol but not gamma-tocotrienol in mice. Free Radic Biol Med. 2005;38:507–514. doi: 10.1016/j.freeradbiomed.2004.11.010. [DOI] [PubMed] [Google Scholar]
- 18.Maglich JM, Stoltz CM, Goodwin B, Hawkins-Brown D, Moore JT, Kliewer SA. Nuclear pregnane × receptor and constitutive androstane receptor regulate overlapping but distinct sets of genes involved in xenobiotic detoxification. Mol Pharmacol. 2002;62:638–646. doi: 10.1124/mol.62.3.638. [DOI] [PubMed] [Google Scholar]
- 19.Pascussi JM, Gerbal-Chaloin S, Drocourt L, Maurel P, Vilarem MJ. The expression of CYP2B6, CYP2C9 and CYP3A4 genes: a tangle of networks of nuclear and steroid receptors. Biochim Biophys Acta. 2003;1619:243–253. doi: 10.1016/s0304-4165(02)00483-x. [DOI] [PubMed] [Google Scholar]
- 20.Bauer B, Hartz AM, Fricker G, Miller DS. Pregnane X receptor up-regulation of P-glycoprotein expression and transport function at the blood-brain barrier. Mol Pharmacol. 2004;66:413–419. doi: 10.1124/mol.66.3.. [DOI] [PubMed] [Google Scholar]
- 21.Cerveny L, Svecova L, Anzenbacherova E, Vrzal R, Staud F, Dvorak Z, Ulrichova J, Anzenbacher P, Pavek P. Valproic Acid Induces CYP3A4 and MDR1 Gene Expression by Activation of Constitutive Androstane Receptor and Pregnane X Receptor Pathways. Drug Metab Dispos. 2007;35:1032–1041. doi: 10.1124/dmd.106.014456. [DOI] [PubMed] [Google Scholar]
- 22.Landes N, Pfluger P, Kluth D, Birringer M, Ruhl R, Bol GF, Glatt H, Brigelius-Flohe R. Vitamin E activates gene expression via the pregnane X receptor. Biochem Pharmacol. 2003;65:269–273. doi: 10.1016/s0006-2952(02)01520-4. [DOI] [PubMed] [Google Scholar]
- 23.Zhou C, Tabb MM, Sadatrafiei A, Grun F, Blumberg B. Tocotrienols activate the steroid and xenobiotic receptor, SXR, and selectively regulate expression of its target genes. Drug Metab Dispos. 2004;32:1075–1082. doi: 10.1124/dmd.104.000299. [DOI] [PubMed] [Google Scholar]
- 24.Sakuma T, Takai M, Endo Y, Kuroiwa M, Ohara A, Jarukamjorn K, Honma R, Nemoto N. A novel female-specific member of the CYP3A gene subfamily in the mouse liver. Arch Biochem Biophys. 2000;377:153–162. doi: 10.1006/abbi.2000.1747. [DOI] [PubMed] [Google Scholar]
- 25.Sakuma T, Endo Y, Mashino M, Kuroiwa M, Ohara A, Jarukamjorn K, Nemoto N. Regulation of the expression of two female-predominant CYP3A mRNAs (CYP3A41 and CYP3A44) in mouse liver by sex and growth hormones. Arch Biochem Biophys. 2002;404:234–242. doi: 10.1016/s0003-9861(02)00329-6. [DOI] [PubMed] [Google Scholar]
- 26.Podda M, Weber C, Traber MG, Packer L. Simultaneous determination of tissue tocopherols, tocotrienols, ubiquinols and ubiquinones. J Lipid Res. 1996;37:893–901. [PubMed] [Google Scholar]
- 27.Leonard SW, Gumpricht E, Devereaux MW, Sokol RJ, Traber MG. Quantitation of rat liver vitamin E metabolites by LC-MS during high-dose vitamin E administration. J Lipid Res. 2005;46:1068–1075. doi: 10.1194/jlr.D400044-JLR200. [DOI] [PubMed] [Google Scholar]
- 28.Irizarry RA, Hobbs B, Collin F, Beazer-Barclay YD, Antonellis KJ, Scherf U, Speed TP. Exploration, normalization, and summaries of high density oligonucleotide array probe level data. Biostatistics. 2003;4:249–264. doi: 10.1093/biostatistics/4.2.249. [DOI] [PubMed] [Google Scholar]
- 29.Livak KJ, Schimittgen TD. Analysis of relative gene expression data using real-time quantitative PCR and the 2−ΔΔCT method. Methods. 2001;25:402–408. doi: 10.1006/meth.2001.1262. [DOI] [PubMed] [Google Scholar]
- 30.Bookout AL, Mangelsdorf DJ. Quantitative real-time PCR protocol for analysis of nuclear receptor signaling pathways. Nuclear Receptor Signaling. 2003;1:e012. doi: 10.1621/nrs.01012. [DOI] [PMC free article] [PubMed] [Google Scholar]
- 31.Pope SA, Clayton PT, Muller DP. A new method for the analysis of urinary vitamin E metabolites and the tentative identification of a novel group of compounds. Arch Biochem Biophys. 2000;381:8–15. doi: 10.1006/abbi.2000.1950. [DOI] [PubMed] [Google Scholar]
- 32.Synold TW, Dussault I, Forman BM. The orphan nuclear receptor SXR coordinately regulates drug metabolism and efflux. Nat Med. 2001;7:584–590. doi: 10.1038/87912. [DOI] [PubMed] [Google Scholar]
- 33.Mustacich DJ, Vo AT, Elias VD, Payne K, Sullivan L, Leonard SW, Traber MG. Regulatory mechanisms to control tissue alpha-tocopherol. Free Radic Biol Med. 2007;43:610–618. doi: 10.1016/j.freeradbiomed.2007.05.027. [DOI] [PMC free article] [PubMed] [Google Scholar]
- 34.Swanson JE, Ben RN, Burton GW, Parker RS. Urinary excretion of 2,7, 8-trimethyl-2-(beta-carboxyethyl)-6-hydroxychroman is a major route of elimination of gamma-tocopherol in humans. J Lipid Res. 1999;40:665–671. [PubMed] [Google Scholar]
- 35.Pope SA, Burtin GE, Clayton PT, Madge DJ, Muller DP. New synthesis of (+/-)-alpha-CMBHC and its confirmation as a metabolite of alpha-tocopherol (vitamin E) Bioorg Med Chem. 2001;9:1337–1343. doi: 10.1016/s0968-0896(01)00010-4. [DOI] [PubMed] [Google Scholar]
- 36.Hayes JD, Flanagan JU, Jowsey IR. Glutathione transferases. Annu Rev Pharmacol Toxicol. 2005;45:51–88. doi: 10.1146/annurev.pharmtox.45.120403.095857. [DOI] [PubMed] [Google Scholar]
- 37.Manson MM, Ball HW, Barrett MC, Clark HL, Judah DJ, Williamson G, Neal GE. Mechanism of action of dietary chemoprotective agents in rat liver: induction of phase I and II drug metabolizing enzymes and aflatoxin B1 metabolism. Carcinogenesis. 1997;18:1729–1738. doi: 10.1093/carcin/18.9.1729. [DOI] [PubMed] [Google Scholar]
- 38.Habig WH, Jocoby WB. Assays for differentiation of glutathione S-transferase. Methods Enzymol. 1981;77:398–405. doi: 10.1016/s0076-6879(81)77053-8. [DOI] [PubMed] [Google Scholar]
- 39.Borst P, Elferink RO. Mammalian ABC transporters in health and disease. Annu Rev Biochem. 2002;71:537–592. doi: 10.1146/annurev.biochem.71.102301.093055. [DOI] [PubMed] [Google Scholar]
- 40.Christians U. Transport proteins and intestinal metabolism: P-glycoprotein and cytochrome P4503A. Ther Drug Monit. 2004;26:104–106. doi: 10.1097/00007691-200404000-00002. [DOI] [PubMed] [Google Scholar]
- 41.Rowlands JC, Gustafsson JA. Aryl hydrocarbon receptor-mediated signal transduction. Critical Reviews in Toxicology. 1997;27:109–134. doi: 10.3109/10408449709021615. [DOI] [PubMed] [Google Scholar]
- 42.Marlowe JL, Puga A. Aryl hydrocarbon receptor, cell cycle regulation, toxicity and tumorigenesis. J Cell Biochem. 2005;96:1174–1184. doi: 10.1002/jcb.20656. [DOI] [PubMed] [Google Scholar]
- 43.Waxman DJ. P450 gene induction by structurally diverse xenochemicals: central role of nuclear receptors CAR, PXR, and PPAR. Arch Biochem Biophys. 1999;369:11–23. doi: 10.1006/abbi.1999.1351. [DOI] [PubMed] [Google Scholar]
- 44.Chirulli V, Longo V, Marini S, Mazzaccaro A, Fiorio R, Gervasi PG. CAR and PXR expression and inducibility of CYP2B and CYP3A activities in rat and rabbit lungs. Life Sci. 2005;76:2535–2546. doi: 10.1016/j.lfs.2004.09.042. [DOI] [PubMed] [Google Scholar]
- 45.Birringer M, Pfluger P, Kluth D, Landes N, Brigelius-Flohe R. Identities and differences in the metabolism of tocotrienols and tocopherols in HepG2 cells. J Nutr. 2002;132:3113–3118. doi: 10.1093/jn/131.10.3113. [DOI] [PubMed] [Google Scholar]
- 46.Harrington DJ, Booth SL, Card DJ, Shearer MJ. Excretion of the urinary 5C- and 7C-aglycone metabolites of vitamin K by young adults responds to changes in dietary phylloquinone and dihydrophylloquinone intakes. J Nutr. 2007;137:1763–1768. doi: 10.1093/jn/137.7.1763. [DOI] [PubMed] [Google Scholar]
- 47.Ross AB, Åmen P, Kamal-Eldin A. Identification of cereal alkylresorcinol metabolites in human urine –potential biomarkers of wholegrain wheat and rye intake. J Chroma. 2004;809:125–130. doi: 10.1016/j.jchromb.2004.06.015. [DOI] [PubMed] [Google Scholar]
Associated Data
This section collects any data citations, data availability statements, or supplementary materials included in this article.
Supplementary Materials
Supplemental Table 1. Genes from the Mouse 430 2.0 GeneChip that were significantly altered in expression by dietary α-tocopherol supplementation (P < 0.05).