Abstract
Purpose
The existence of learning effects in perimetry, whereby a subject’s first test is more variable and has lower mean sensitivity (MS) than subsequent tests, is well established. However, studies have typically examined this issue by testing subjects at a frequency that would be unusual in a clinical setting. This study seeks to determine the validity of these conclusions for less frequent, yet more clinically realistic, testing rates.
Methods
One hundred sixty eyes of 80 subjects with suspected or early glaucoma were included. Subjects were tested annually for 8 years using white-on-white standard automated perimetry (SAP) and short wavelength automated perimetry (SWAP). All subjects had undergone at least one test with both paradigms before entering the study.
Results
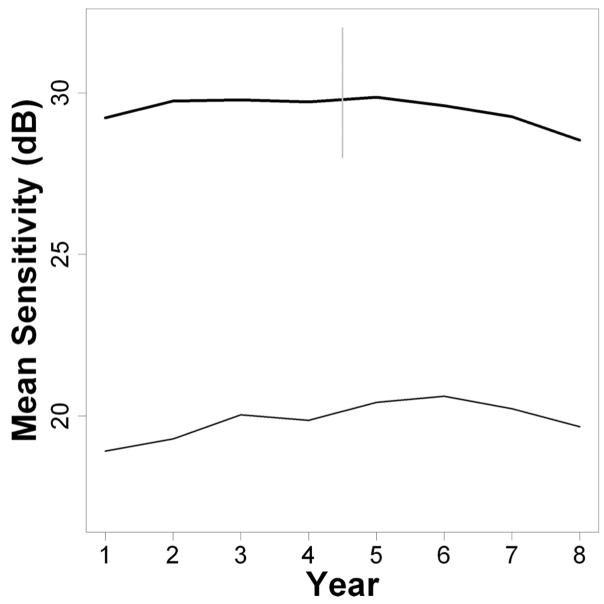
For SAP, MS increased by 0.5 dB over the first year, and then showed no significant change until after year 5 (despite expected effects of aging and disease progression), after which it started to decline. For SWAP, MS of the average eye continued to improve until year 6 of the study.
Conclusions
Our findings seem to indicate a prolonged learning effect for SWAP, with MS increasing for several years. A smaller prolonged learning effect may also be present for SAP, counteracting the effects of aging and disease progression. Deterioration of the subject’s visual field may be underestimated within this period.
Keywords: perimetry, visual fields, learning effects, longitudinal study, progression
Glaucoma is one of the leading causes of blindness worldwide. However, progression from first onset to significant loss of vision is slow, usually taking many years.1 There-fore, it is vital to be able to follow patients’ vision over time, in order to detect and quantify change.
Currently, methods for identifying and following glaucomatous damage fall into two main categories; structural and functional tests. Optic disc photographs and structural tests such as Scanning Laser Tomography and Optical Coherence Tomography aim to find changes in the structure of the retinal nerve fiber layer and/or optic nerve head that could be indicative of damage.2 However, the correlation between these measures and a patient’s vision are weak.3,4 The reasons for this structure-function dissociation are unclear. It may be that some eyes have more functional redundancy than others, or are otherwise less susceptible to damage, and so the same amount of structural damage has a smaller effect on vision. It is also possible that some retinal cells that contribute to structural measures are not functioning correctly, if at all.5 Certainly, using structural measures as a surrogate of function introduces a layer of uncertainty. For all these reasons, directly measuring a patient’s functional vision as accurately as possible remains an essential part of glaucoma management and the focus of much clinical glaucoma research.
Functional tests most commonly take the form of automated perimetry. Standard Automated Perimetry (SAP)6 was developed in the 1970s and 1980s using a white stimulus on a white background, for example as implemented in the Humphrey Field Analyzer (HFA II, Carl Zeiss Meditec, Dublin, CA) and the Octopus Field Analyzer (Haag-Streit, Bern, Switzerland). More recently, other testing paradigms have been developed. These include Frequency Doubling Technology perimetry,7 which presents a counterphase flickering sinusoidal stimulus; and Short Wavelength Automated Perimetry (SWAP),8 which presents a short wavelength (blue) stimulus on a broadband middle wavelength (yellow) background to assess the function of short wavelength sensitive pathways. These paradigms may detect some defects earlier by stimulating a smaller subset of visual neural pathways, either because those pathways are disproportionately more damaged, or because reduced redundancy makes damage easier to detect.9
Unfortunately, functional testing is limited by variability, both intrinsic to the visual system (e.g., the natural variability of neural spiking) and extrinsic to the visual system (e.g., attention lapses, fatigue, errors in pushing a response button). One of the largest sources of variability extrinsic to the visual system may be instability in the subject’s decision rule, or response criterion, over time; i.e., how certain they have to be that they saw the stimulus before they will respond. A subject who is more experienced in perimetry may be more confident that a visual signal was caused by a perimetric stimulus, due to prior knowledge of characteristics of the stimulus such as duration and spatial properties. This may cause their measured sensitivity to increase, since they will correctly identify a higher proportion of stimuli at or near threshold. It may also cause the subject’s intra-test variability to be reduced, as their frequency-of-seeing curve will steepen.
An increase in sensitivity and/or decrease in short-term variability with experience have been reported in the literature. They are commonly referred to as a ‘learning effect,’ so that is the terminology used in this paper; however, it may be more correct to call it an ‘experience effect’ or a ‘practice effect.’ A significant learning effect between the first and second tests undertaken by normal and glaucomatous subjects has been reported for SAP.10–12 It is typically reported as being greatest between the first and second tests, with the literature varying over whether a further significant learning effect takes place between the second and third tests, whether its magnitude varies among subjects, and whether its magnitude is greater peripherally than centrally. SWAP also exhibits a learning effect that may be larger than for SAP,13 even among subjects experienced with other testing paradigms.14 The reason for this is unclear, although part of the difference may be due to the higher variability of SWAP.8,15,16 However, these studies tested subjects multiple times within a very short time period (typically less than 1 month). By comparison, patients are usually tested less frequently during their clinical management, often just once or twice annually. Intuitively it would be expected that some portion of the improvement attributable to learning would be lost over time, i.e., ‘unlearning’ or forgetting. This could result in the clinically observed learning effect being of lesser magnitude, and/or taking a greater total number of tests to stabilize because at each test some relearning needs to occur. There are fewer studies of learning effects with infrequent testing. Werner et al.17 performed SAP on the Octopus perimeter, with tests performed over an average 24 month period, and found a learning effect stabilizing after the second test. However, this finding has been disputed.18
In this paper, we aim to characterize the learning effect with both SAP and SWAP when a more clinically realistic schedule is used. In particular, we ask whether the conclusions from previous studies remain valid with less frequent testing. Glaucoma suspects and subjects with early glaucoma were tested annually over 8 years, and changes over time examined to determine whether the problems associated with learning effects have been underestimated.
METHODS
Data were obtained from the ongoing Perimetry and Psychophysics in Glaucoma (PPIG) project, using glaucoma suspects and patients with early glaucoma recruited and tested in Portland, Oregon, US. Subjects were tested at baseline and then re-examined with SAP and SWAP annually. Except for a few cases, testing was carried out within 1 month of the anniversary of the first test. Both tests were carried out on the same day. The study adhered to the tenets of the Declaration of Helsinki, and all subjects signed an informed consent form before participation in the study and reaffirmed their consent at each visit.
Detailed inclusion criteria for the PPIG study are described elsewhere.19 Briefly, these included previously diagnosed glaucomatous optic neuropathy, or risk factors including ‘suspicious’ ONH appearance (cup-disc ratio asymmetry >0.2 with no disc size asymmetry, potential neuroretinal rim notching or narrowing, disc hemorrhage), ocular hypertension (untreated intraocular pressure ≥22 mm Hg), family history of glaucoma, history of migraine or Raynaud syndrome, African-American ancestry, age over 70 years, history of systemic hypertension, or diet-controlled diabetes. All participants in the study had an elevated IOP (before treatment) plus at least one additional risk factor. Exclusion criteria included other previous or current serious ocular pathology, previous ocular surgery (except uneventful cataract surgery), best-corrected visual acuity worse than 20/40 in either eye, diabetes requiring medication, and mean deviation (MD) on Full Threshold 24 to 2 SAP worse than −6 dB. Other than excluding subjects with moderate and severe glaucoma, and ensuring acceptable reliability parameters, visual fields did not form part of the inclusion or exclusion criteria. All subjects had previously undergone both SAP and SWAP testing at least once before entry into the study.
SAP and SWAP visual field testing were performed using the Humphrey Field Analyzer II, with the 24 to 2 pattern and conventional test procedures. For SAP the Full Threshold testing algorithm was used for years 1 to 4, and the SITA Standard testing algorithm for years 5 to 8. This change was undertaken because SITA has now become the more commonly used algorithm for SAP testing. Although results from the two algorithms have been reported to be generally equivalent, SITA sensitivities are on average approximately 1 dB higher than Full Threshold sensitivities,20 since the latter reports the last-seen stimulus intensity, on average 1 dB below the actual sensitivity (the average of the last-seen and last-unseen). Therefore, 1 dB was retrospectively added to all sensitivities recorded with the Full Threshold algorithm. For SWAP, the Full Threshold testing algorithm was used. For both paradigms, an optimal lens correction was placed before the tested eye, and the fellow eye occluded with an eye patch.21
For inclusion in this study, subjects were required to have undertaken testing as described above for 8 consecutive years, without missing any visits. One hundred sixty eyes of 80 subjects satisfied these criteria and were included. Both eyes were evaluated in the study.
The principal outcome measure for this study was mean sensitivity (MS), defined as the arithmetic mean of the sensitivities at the 52 non-blind spot locations in the 24 to 2 visual field. This was chosen over either MD or number of abnormal locations to avoid complications caused by the different normative datasets of different testing paradigms and algorithms. In an experienced normal observer, MS would be expected to decrease over time due to aging,13 by around 0.1 dB per year for SAP22 but perhaps more rapidly for SWAP.23 Since subjects in this study had suspected or early glaucoma, it is possible that their MS would decrease at a greater rate than normal subjects due to progression of their disease. As a secondary analysis, each subject’s change in MS from the previous year was calculated, and compared to the null hypothesis of zero change, using generalized estimating equation (GEE) techniques24 as implemented in the R language for statistical computing (R Development Core Team 2004, www.R-project.org). GEE generates estimates of parameters and p-values while adjusting for inter-eye correlations and repeated testing over time. To compare the learning effect at different eccentricities, the analyses were repeated after dividing the field into two zones, Central and Peripheral, as shown in Fig. 1.
FIGURE 1.
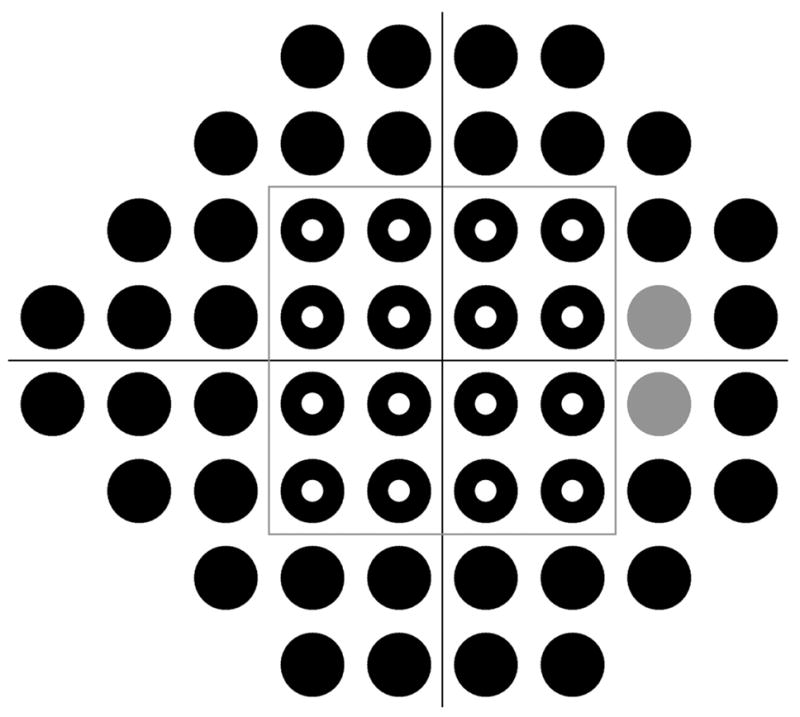
The locations in the visual field tested in this study, as shown in the format for a right eye. The gray locations correspond to the location of the blind spot and were excluded from analysis. The gray box at (±12°, ±12°) separates the field into Central (16 locations, hollow circles) and Peripheral (36 locations, excluding the blind spot, solid circles) zones.
RESULTS
Fig. 2 shows the change in MS over time of the average (mean) eye, for SAP (upper, thick black line) and SWAP (lower, thin black line). SAP sensitivities are higher than SWAP sensitivities due to the different stimulus characteristics of the two testing paradigms. Average MS in year 1 was 29.2 dB for SAP (5th percentile 24.0 dB, 95th percentile 32.7 dB), and was 18.9 dB for SWAP (5th percentile 8.2 dB, 95th percentile 27.5 dB), varying according to the different ages and disease statuses of subjects. For SAP, the MS tended to increase between years 1 and 2, before remaining approximately stable for several years, and finally starting to decline from about year 6 onwards. For SWAP, the MS tended to increase until year 6 before starting to decline. Fig. 3 shows the changes when the field was split into central (solid lines) and peripheral (dashed lines) zones, as in Fig. 1. The increase in MS, potentially indicating a learning effect, was slightly greater peripherally than centrally for both testing modalities. This was only statistically significant for two of the time intervals for SAP (years 2 to 3, mean effect greater peripherally by 0.21 dB, p = 0.042; and years 4 to 5, when SITA was introduced, greater by 0.36 dB, p = 0.001; all other consecutive year pairs p > 0.05) and for two time intervals for SWAP (years 1 to 2, greater by 0.31 dB, p = 0.041; years 2 to 3, greater by 0.31 dB, p = 0.014; all other consecutive year pairs p 18q0.05), using GEE regression.24 There were no significant differences between the magnitudes of the learning effect at the four locations (±9°, ±9°) tested first in the thresholding algorithm and the magnitudes at other central locations.
FIGURE 2.
Changes in MS over time for SAP (thick line, at top) and SWAP (thin line, at bottom). The vertical gray line indicates the point at which the SITA algorithm was first used for SAP.
FIGURE 3.
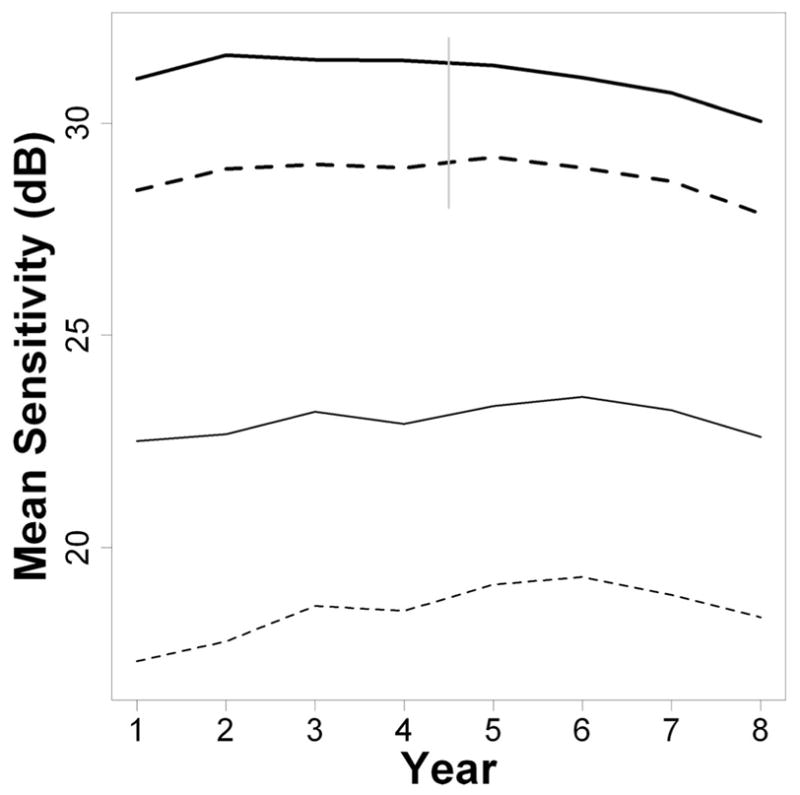
Changes in MS over time for SAP (thick lines, at top) and SWAP (thin lines, at bottom), after splitting the visual field into Central (solid lines) and Peripheral (dashed lines) zones as depicted in Fig. 1. The vertical gray line indicates the point at which the SITA algorithm was first used for SAP.
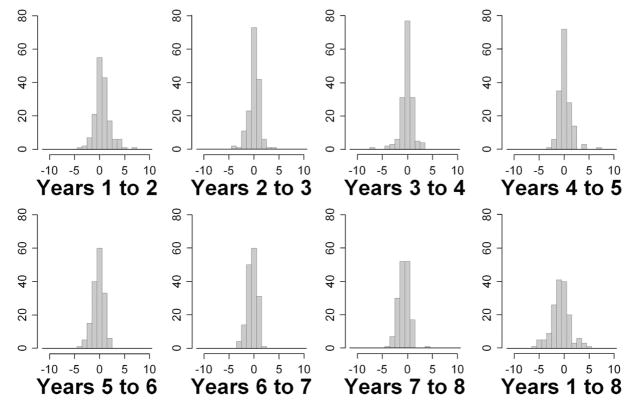
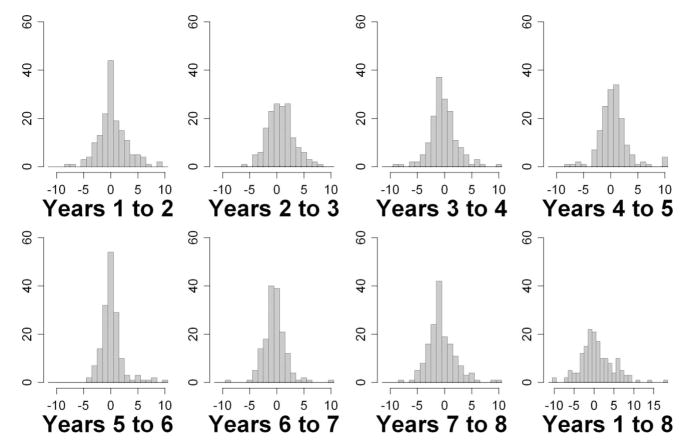
Figs. 4 and 5 show histograms of the changes in MS from 1 year to the next, for SAP and SWAP, respectively, for all eyes in the study. Also shown are the changes in MS from year 1 to year 8, the entire range of the study. Table 1 summarizes the changes. Absolute changes are on average larger for SWAP than for SAP, reflecting its greater variability. There is no obvious evidence with either modality of bimodal distributions within the histograms, as would be expected if there were a clear distinction between a group of subjects exhibiting a large learning effect and a group of subjects exhibiting little or no learning effect.
FIGURE 4.
Changes in SAP MS between years for all eyes.
FIGURE 5.
Changes in SWAP MS between years for all eyes. Changes greater than +11 dB or less than −11 dB are censored at those limits for ease of viewing, except in the last histogram showing changes over the entire series (hence the different horizontal scale on that histogram).
TABLE 1.
Changes in mean sensitivity from the previous year, for all eyes in the study, for SAP and SWAP
| SAP sensitivity (dB) | SWAP sensitivity (dB) | |||||
|---|---|---|---|---|---|---|
| Year | Mean | Median | p | Mean | Median | p |
| 2 | +0.523 | +0.404 | <0.001 | +0.378 | +0.029 | 0.169 |
| 3 | +0.039 | +0.067 | 0.711 | +0.739 | +0.596 | 0.002 |
| 4 | −0.061 | −0.019 | 0.614 | −0.168 | −0.471 | 0.502 |
| 5 | +0.139 | +0.019 | 0.223 | +0.560 | +0.385 | 0.073 |
| 6 | −0.264 | −0.288 | 0.008 | +0.189 | −0.029 | 0.342 |
| 7 | −0.336 | −0.231 | <0.001 | −0.389 | −0.433 | 0.056 |
| 8 | −0.726 | −0.558 | <0.001 | −0.559 | −0.788 | 0.026 |
Mean and median values are given in decibels. The p-values are for a two-tail test of the null hypothesis of zero change, using the generalized estimating equation technique to adjust for inter-eye correlations within subjects.
DISCUSSION
Although knowledge of the existence of a learning effect in perimetry is nothing new, these results suggest that the duration of the problem may have been underestimated, particularly for SWAP. This occurs because most previous studies have approached the issue by testing subjects on multiple occasions over a relatively short time interval, typically about 1 month. It can then be assumed that no true disease progression or aging related change has occurred. Any change in sensitivity can be attributed to learning, and a more accurate measure obtained. However, this may not be applicable in a more typical clinical situation, where patients are tested infrequently, often just once or twice per year. Some of the improvement due to learning may be lost during the interval between tests. This causes the learning effect between consecutive tests to be smaller, but also to be prolonged over more tests instead of stabilizing by the second or third test.
The change in sensitivity may have several contributing causes, combining to form what has become known as a learning effect. Learning how to perform the test (for example, when to press the response button) is unlikely to take a long time, which is why the term ‘learning effect’ may be misleading; subjects could be expected to remember this within the first few stimulus presentations if they have undergone at least one prior visual field test. Memory of the duration of the test may help the subject maintain concentration throughout, and this would be learnt over the course of several tests. Knowledge of the stimulus characteristics and appearance will also likely improve more gradually. In particular, knowledge of the temporal and spatial qualities of the stimulus will increase the confidence with which the subject can determine whether a visual signal was caused by a true stimulus. They can then concentrate on signals matching the stimulus characteristics, and pay less attention to other signals received by the retina and visual cortex (for example caused by random thermal isomerizations of rhodopsin, and the ongoing random firing of retinal ganglion cells and cortical cells). This increased confidence may result in a shift in their response criterion, and hence a change in the measured sensitivity. There may also be other components of the learning effect that remain as yet uncharacterized, for example the effect on the sensitivity measurement of changes in the rate of false negative and false positive responses.
As with any clinical study, the conclusions are contingent on the quality of the data used. The PPIG study provides an exceptionally well-controlled dataset, in particular the testing frequency being so close to annual for all subjects. Only subjects with 8 complete years of testing were included, removing problems with missing data. However, it is always possible that different conclusions would have been reached with an independent study population.
Estimates of the learning effect in this study are almost certainly underestimates rather than overestimates. Every subject tested had previously undergone at least one SAP test and at least one SWAP test before entering the study. It is likely that some had been tested multiple times (in particular with SAP) during the course of their routine clinical care. Unfortunately, we do not have the kind of data that would allow this issue to be quantified, but it is clear that the true magnitude of the learning effect over the first two tests would be larger than presented here.
Subjects with early glaucoma whose true sensitivity may be declining due to progression were included, instead of restricting the study to normal observers whose true sensitivity would only be declining by a lesser amount due to aging. An advantage of this is that the population is more clinically realistic, since normal subjects would not be followed annually. The main disadvantage is that the proportion of any change in MS that is caused by learning cannot be quantified as accurately. It is likely that the actual mean sensitivities of some of these patients would have been declining due to disease progression, in the manner seen from year 5 onwards with SAP. This suggests that the lack of any significant reduction in MS could be indicative of a prolonged learning effect for SAP, although this conclusion cannot be made with the same degree of confidence as the conclusions that can be drawn with SWAP. More importantly, however, learning would cause an increase in MS, whereas progression and aging would both cause a decrease in MS. This means that if the MS appears to increase by xdB, the change attributable to learning is actually greater than xdB. As with the prior testing issue discussed in the previous paragraph, it can be concluded that estimates of the learning effect presented in this paper are likely to be underestimates. We believe that this adds more weight to our conclusion that duration and possibly magnitude of the learning effect may have previously been underestimated.
A corollary of this study is the effect of switching from the Full Threshold algorithm to the SITA algorithm, due to a desire to reflect current clinical practice. A rise of approximately 1 dB in sensitivities for SAP when switching from Full Threshold to SITA is due to the different definitions of threshold, and is well known.20 The data presented here suggests that there may be an additional small increase in MS. As seen in Table 1, MS in year 5 using SITA was on average 0.14 dB higher than in year 4 using Full Threshold, even after applying a 1 dB correction. The shorter testing time of the SITA algorithm may cause a reduction in fatigue and so increase peripheral sensitivities (since these locations are tested last by the Full Threshold algorithm), although this will be partly compensated for by the fact that better light adaptation later in a Full Threshold test will increase those sensitivities.25
It is possible that repeating baseline visual field testing over a short period of time would reduce the magnitude and duration of the subsequent learning effect, with the MS asymptoting to a stable level after fewer tests. Another informative future study could involve examining the effect of more frequent (but still clinically realistic) testing on the learning effect, for example two or three tests per year.
When interpreting series of visual fields, the possibility of a prolonged learning effect needs to be taken into consideration. An apparent improvement in MS or MD, over the first few fields from a patient should not be taken as definitive evidence that their disease is not progressing. In such cases, it may be advisable to pay more attention to changes in the pattern deviation plot and pattern standard deviation value, rather than concentrating on raw sensitivities, the total deviation plot or the MD. Indeed, although the mean pattern standard deviation in this study decreased slightly over the first few years (2.54 in year 1; 2.51 in year 2; 2.43 in year 3; and 2.47 in year 4), as would be expected if learning was reducing variability, it was much more stable than MS, with only the change from year 2 to year 3 reaching statistical significance (p = 0.01). Once the patient has been followed for sufficient time for learning effects to have asymptoted, trends in the raw sensitivities, total deviation plot or MD become more reliable,26 but the first few fields in the series may have to be discounted when determining these trends.
Our results indicate an extended learning effect in SWAP, lasting for several years, and the strong possibility of a similar (if smaller) extended learning effect in SAP. Clinicians and researchers should be aware of the possibility of an extended learning effect in perimetry lasting for several years when using clinically realistic testing intervals, which may mask true changes in the subject’s visual field.
Acknowledgments
This work was supported by National Eye Institute, National Institute of Health grant R01-EY-03,424 (CAJ).
Footnotes
This paper was presented, in part, as a poster at the ARVO meeting, May 2006, Fort Lauderdale, Florida.
The authors have no financial interest in any of the techniques or instruments used in this study.
References
- 1.Spry PG, Johnson CA. Identification of progressive glaucomatous visual field loss. Surv Ophthalmol. 2002;47:158–73. doi: 10.1016/s0039-6257(01)00299-5. [DOI] [PubMed] [Google Scholar]
- 2.Zangwill LM, Bowd C, Berry CC, Williams J, Blumenthal EZ, Sanchez-Galeana CA, Vasile C, Weinreb RN. Discriminating between normal and glaucomatous eyes using the Heidelberg Retina Tomograph, GDx Nerve Fiber Analyzer, and Optical Coherence Tomograph. Arch Ophthalmol. 2001;119:985–93. doi: 10.1001/archopht.119.7.985. [DOI] [PubMed] [Google Scholar]
- 3.Girkin CA. Relationship between structure of optic nerve/nerve fiber layer and functional measurements in glaucoma. Curr Opin Ophthalmol. 2004;15:96–101. doi: 10.1097/00055735-200404000-00007. [DOI] [PubMed] [Google Scholar]
- 4.Gardiner SK, Johnson CA, Cioffi GA. Evaluation of the structure-function relationship in glaucoma. Invest Ophthalmol Vis Sci. 2005;46:3712–7. doi: 10.1167/iovs.05-0266. [DOI] [PubMed] [Google Scholar]
- 5.Gardiner SK, Demirel S, Johnson CA. Modeling the sensitivity to variability relationship in perimetry. Vision Res. 2006;46:1732–45. doi: 10.1016/j.visres.2005.11.019. [DOI] [PubMed] [Google Scholar]
- 6.Anderson DR, Patella VM. Automated Static Perimetry. 2. St. Louis: Mosby; 1999. [Google Scholar]
- 7.Anderson AJ, Johnson CA, Fingeret M, Keltner JL, Spry PG, Wall M, Werner JS. Characteristics of the normative database for the Humphrey matrix perimeter. Invest Ophthalmol Vis Sci. 2005;46:1540–8. doi: 10.1167/iovs.04-0968. [DOI] [PMC free article] [PubMed] [Google Scholar]
- 8.Wild JM. Short wavelength automated perimetry. Acta Ophthalmol Scand. 2001;79:546–59. doi: 10.1034/j.1600-0420.2001.790602.x. [DOI] [PubMed] [Google Scholar]
- 9.Johnson CA. Selective versus nonselective losses in glaucoma. J Glaucoma. 1994;3:S32–44. [PubMed] [Google Scholar]
- 10.Heijl A, Lindgren G, Olsson J. The effect of perimetric experience in normal subjects. Arch Ophthalmol. 1989;107:81–6. doi: 10.1001/archopht.1989.01070010083032. [DOI] [PubMed] [Google Scholar]
- 11.Wild JM, Dengler-Harles M, Searle AE, O’Neill EC, Crews SJ. The influence of the learning effect on automated perimetry in patients with suspected glaucoma. Acta Ophthalmol (Copenh) 1989;67:537–45. doi: 10.1111/j.1755-3768.1989.tb04105.x. [DOI] [PubMed] [Google Scholar]
- 12.Heijl A, Bengtsson B. The effect of perimetric experience in patients with glaucoma. Arch Ophthalmol. 1996;114:19–22. doi: 10.1001/archopht.1996.01100130017003. [DOI] [PubMed] [Google Scholar]
- 13.Gardiner SK, Johnson CA, Spry PG. Normal age-related sensitivity loss for a variety of visual functions throughout the visual field. Optom Vis Sci. 2006;83:438–43. doi: 10.1097/01.opx.0000225108.13284.fc. [DOI] [PubMed] [Google Scholar]
- 14.Wild JM, Kim LS, Pacey IE, Cunliffe IA. Evidence for a learning effect in short-wavelength automated perimetry. Ophthalmology. 2006;113:206–15. doi: 10.1016/j.ophtha.2005.11.002. [DOI] [PubMed] [Google Scholar]
- 15.Blumenthal EZ, Sample PA, Zangwill L, Lee AC, Kono Y, Weinreb RN. Comparison of long-term variability for standard and short-wavelength automated perimetry in stable glaucoma patients. Am J Ophthalmol. 2000;129:309–13. doi: 10.1016/s0002-9394(99)00432-8. [DOI] [PubMed] [Google Scholar]
- 16.Hutchings N, Hosking SL, Wild JM, Flanagan JG. Long-term fluctuation in short-wavelength automated perimetry in glaucoma suspects and glaucoma patients. Invest Ophthalmol Vis Sci. 2001;42:2332–7. [PubMed] [Google Scholar]
- 17.Werner EB, Krupin T, Adelson A, Feitl ME. Effect of patient experience on the results of automated perimetry in glaucoma suspect patients. Ophthalmology. 1990;97:44–8. doi: 10.1016/s0161-6420(90)32628-3. [DOI] [PubMed] [Google Scholar]
- 18.Schultz JS. The “learning effect” in automated perimetry. Ophthalmology. 1990;97:838. [PubMed] [Google Scholar]
- 19.Spry PG, Johnson CA, Mansberger SL, Cioffi GA. Psychophysical investigation of ganglion cell loss in early glaucoma. J Glaucoma. 2005;14:11–9. doi: 10.1097/01.ijg.0000145813.46848.b8. [DOI] [PubMed] [Google Scholar]
- 20.Artes PH, Iwase A, Ohno Y, Kitazawa Y, Chauhan BC. Properties of perimetric threshold estimates from Full Threshold, SITA Standard, and SITA Fast strategies. Invest Ophthalmol Vis Sci. 2002;43:2654–9. [PubMed] [Google Scholar]
- 21.Sample PA, Johnson CA, Haegerstrom-Portnoy G, Adams AJ. Optimum parameters for short-wavelength automated perimetry. J Glaucoma. 1996;5:375–83. [PubMed] [Google Scholar]
- 22.Johnson CA, Adams AJ, Lewis RA. Evidence for a neural basis of age-related visual field loss in normal observers. Invest Ophthalmol Vis Sci. 1989;30:2056–64. [PubMed] [Google Scholar]
- 23.Johnson CA, Adams AJ, Twelker JD, Quigg JM. Age-related changes in the central visual field for short-wavelength-sensitive pathways. J Opt Soc Am A. 1988;5:2131–9. doi: 10.1364/josaa.5.002131. [DOI] [PubMed] [Google Scholar]
- 24.Liang KY, Zeger SL. Longitudinal data analysis using generalized linear models. Biometrika. 1986;73:13–22. [Google Scholar]
- 25.Anderson AJ, McKendrick AM. Quantifying adaptation and fatigue effects in frequency doubling perimetry. Invest Ophthalmol Vis Sci. 2007;48:943–8. doi: 10.1167/iovs.06-0685. [DOI] [PubMed] [Google Scholar]
- 26.Artes PH, Nicolela MT, LeBlanc RP, Chauhan BC. Visual field progression in glaucoma: total versus pattern deviation analyses. Invest Ophthalmol Vis Sci. 2005;46:4600–6. doi: 10.1167/iovs.05-0827. [DOI] [PubMed] [Google Scholar]


