Abstract
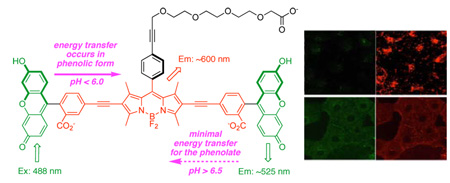
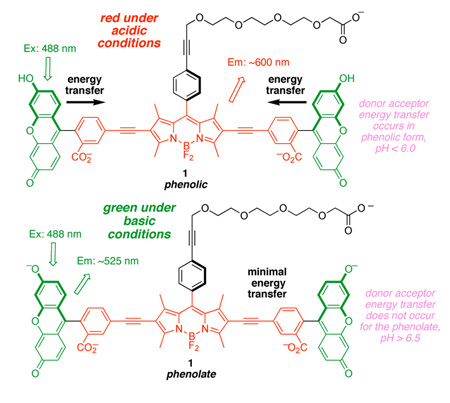
A molecule that transfers energy through bonds from a donor to an acceptor was prepared with a pH sensitive donor function (fluorescein). At pH values above 6.5, minimal energy transfer occurred, and the probe emits green fluorescence (ca 520 nm) when excited at the donor (488 nm). Below pH 6 however, energy transfer is efficient hence excitation at the donor causes emission at the acceptor part (600 nm). This probe was used to image a conjugate of the probe with bovine serum albumin that was imported into endosomes or in the cytosol using the non-covalently bound carrier, Pep-1, at 37 and 4 °C, respectively. The more acidic environment of the endosomes was conspicuous from the red fluorescence of the probe.
Of the numerous fluorescent small molecule pH probes that have been reported, only a small number are practical for intracellular imaging.1–7 This is unfortunate because pH changes within cells are indicative of many cellular processes.8–12 The most useful probes are the ratiometric ones that absorb UV excitation at a fixed wavelength, and emit at two different fluorescence wavelengths in a pH dependent manner. These probes do not give dark regions in the cell at extreme pH environments, and simply areas where the dye did not permeate are clear. A widely used, commercially available pH-sensitive probe is SNARF-1 (Invitrogen Inc.). This communication focuses on the pH probe 1 based on a through-bond energy transfer cassette.13–15 Data are presented to demonstrate that probe 1 tends to fluoresce with higher quantum yields than SNARF over a physiologically relevant pH range. The ideal pH ranges of operation for 1 and for SNARF are complementary (4.0 – 6.5 and 7.0 – 8.0, respectively).
Xanthene (the fluorescent core of fluorescein) is highly emissive at pH values above 7 (ϕ = 0.9); under those conditions it exists predominantly in the phenolate form. As the pH is lowered to around 6, it transforms into the phenolic state that is somewhat less emissive (ϕ = 0.4).16–18 The pH probe 1, which has two xanthene donors and one BODIPY acceptor, was designed to harness changes in the oxidation potentials associated with these protonation states. We hypothesized that the efficiency of the energy transfer from the xanthene donors to the BODIPY core would be governed by oxidation potentials which in turn depend on the protonation state of the xanthenes, making the whole cassette sensitive to pH changes in the range of cellular physiological processes. Perfect energy transfer, when the probe is excited near the fluorescein absorption maxima (ca 495 nm), would give red fluorescence (600 nm). Conversely, if the energy transfer was completely eliminated at certain pH values then the cassette would fluoresce from the xanthene core (ie around 520 nm). In either case, the cassette would remain fluorescent as the cellular pH changes.
Cassette 1 was prepared via Sonogashira coupling of two 5’-alkynyl fluorescein diacetate molecules13 with an appropriate diiodo-BODIPY, followed by deprotection (see supporting information). It is slightly water soluble at neutral pH, and more so at pH 8.
Absorbance spectra for the conjugate of this probe with bovine serum albumin, ie BSA-1 were measured as a function of pH in aqueous media. The absorption maxima for the acceptor BODIPY part is around 576 nm, and is impervious to pH changes between 4.1 and 7.9. However, the extinction coefficient for the fluorescein part at around 495 nm diminishes markedly from pH 7.9 to 4.1 (Supporting information, Figure S2).
Fluorescence spectra for BSA-1 as a function of pH are shown in Supporting information, Figure S3. Under neutral and basic conditions, pH 7.0 and 7.9, the probe emits almost exclusively at around 520 nm, ie green fluorescence. Conversely, at the acidic extreme, pH 4.1 and 5.0, the cassette fluoresces almost completely red, ie from the BODIPY acceptor. The inset of Figure S3 shows that the ratio of red-to-green fluorescence for BSA-1 is highly sensitive to pH in the 4.0 – 6.5 range. A crossover occurs around pH 6.0 where significant red and green fluorescence are observed. If the measurement at pH 7.9 is excluded from consideration in Figure S3 (this is justifiable because we do not claim that the probe is sensitive above pH 7), then an isobestic point is apparent. Quantum yield measurements for BSA-1 at the pH extremes of 4.1 and 8.8 were 0.18 and 0.14. By comparison, literature quantum yields for SNARF are 0.03 (pH 5 – 6) and 0.09 (pH 10 – 12).19 The fluorescence response of 1 as the pH is cycled between acidic (3.4) and basic media (8.0) demonstrated that the probe is stable to this treatment (Supporting information, Figure S4)
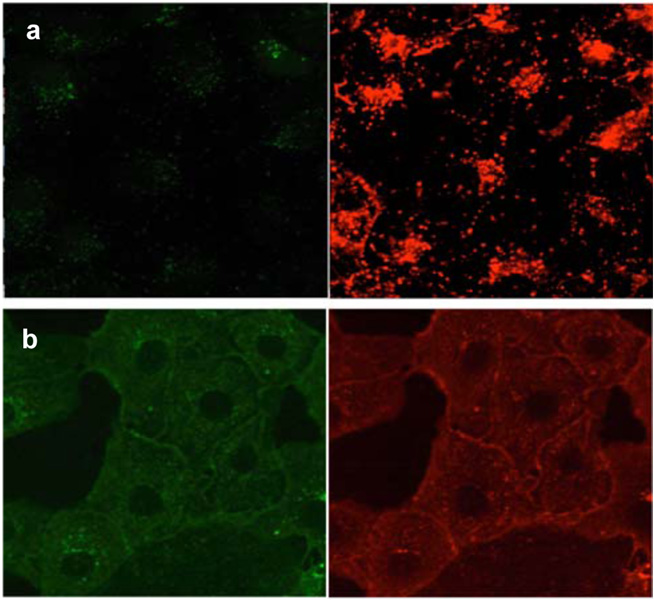
Endosomes within cells (pH 5.0 – 5.5) are markedly more acidic than the cytosol.20 We have observed that when the non-covalently bound carrier peptide “Pep-1”21 imports dye labeled proteins into COS-7 cells the protein-dye conjugates tend to be encapsulated in endosomes.22 Consequently, we anticipated that when BSA-1 was imported into cells using Pep-1, it would localize in endosomes and, in that acidic environment the probe would emit around 600 nm. When BSA-1 was imported into COS-7 cells using Pep-1 (1 µM protein; 1:20 mol ratio protein:carrier, 37 °C, 1h), irradiation at 488 nm resulted predominantly in red fluorescence localized in punctate vesicular structures (Figure 1a).
Figure 1.
Pep-1 mediated cellular uptake of BSA-1 (1 µM) into COS-7 cells after 1h incubation at a 37 °C and b 4 °C. The cells were irradiated at 488 nm and fluorescence from donor (503–553 nm) and acceptor (575–625 nm) was detected respectively.
A recent discovery from our laboratories shows that Pep-1 mediated import into COS-7 cells tends to deposit the dye-labeled protein cargoes into the cytosol when the experiment is performed at 4 °C.22 Thus, BSA-1 under these conditions would be expected to fluoresce with diminished red-to-green ratios. The fluorescence intensity for BSA-1 is distributed within the cytosol, hence the images in Figure 1b appear to be deceptively weak relative to situations (eg Figure 1a) where the probe is concentrated in punctates. A better impression of the relative intensities in the red and green channels for both experiments (37 and 4 °C) after correction for autofluorescence and donor bleed through is shown in the Supporting information (page S8).
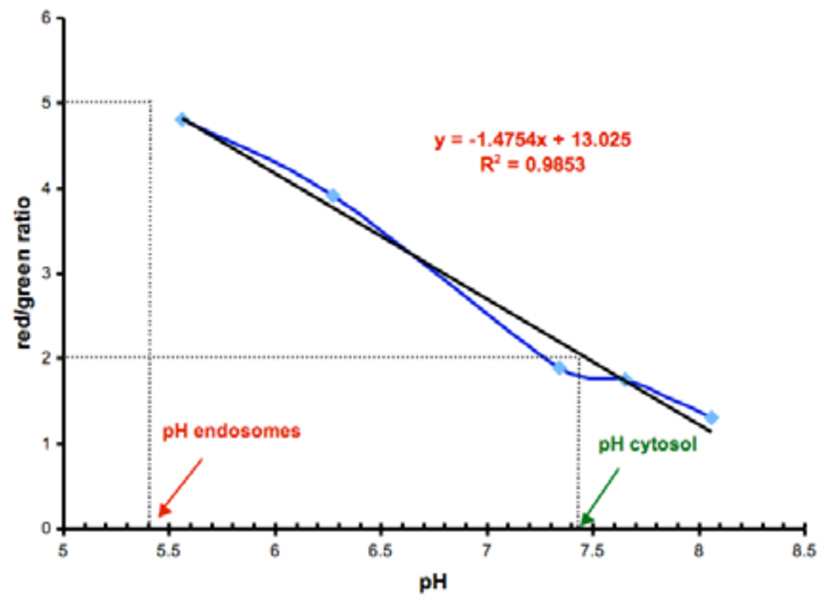
Quantitative data for pH measurements in cells were obtained via a calibration experiment. Details of this are provided in the supporting information, but the salient feature is that the ionophore nigericin was used to produce “leaky cells” that were then bathed in buffers. This is a standard approach that has been used for the same purpose to calibrate other pH measurements ex-vivo.7,23,24 A curve generated with the calibration experiment (Figure 2) was used to determine pH values for the endosomes and the cytosol for the experiments shown in Figure 1. The pH values, obtained from the red/green ratio (R/G = 5.03 and 2.03 at 37 and 4 °C, respectively), were 5.4 and 7.4 and were in good agreement with those expected for such intracellular regions. When SNARF (not protein conjugated) was imported into COS-7 cells (at 37 and 4 °C) as a lipophilic, hydrolysable form, a pH value of 7.1 was determined (see Supporting); this is very close to the value cited above for probe 1 (ie 7.4).
Figure 2.
ex-vivo calibration curve with pH values corresponding to those observed within endosomes (red/green = 5.03; import at 37 °C) and the cytosol (red/green = 2.03; import at 4 °C).
Our interpretation of the SNARF literature indicates that this probe is usually used as a non-conjugated form (ie not attached to proteins); presumably this is because it has a low quantum yield and cannot easily be visualized when present at low concentrations.19 By contrast, the data presented in this study show that visualization of proteins conjugated to 1 is possible. This is highly significant because the new probe should facilitate observation of processes within the cell. Further, the energy transfer approach to pH probes for intracellular imaging has considerable potential for modifications with other pH sensitive donors to give a spectrum of probes with systematically varied pH response transitions. Design of probes of this type requires an understanding of the parameters underlying the fluorescence energy transfer processes. These parameters although not simple, have been elucidated in a parallel study that focuses on the redox behavior of the cassette components; this is to be reported elsewhere in detail
Supplementary Material
Experimental procedures for the preparation of compounds 1 and BSA-1 conjugate are available free of charge via Internet at http://pubs.acs.org.
Acknowledgment
We thank the National Institutes of Health (GM72041) and The Robert A. Welch Foundation for financial support, the TAMU/LBMS-Applications Laboratory directed by Dr Shane Tichy for assistance with mass spectrometry, and Dr Jean Philippe Pellois for useful suggestions.
References
- 1.Galindo F, Burguete MI, Vigara L, Luis SV, Kabir N, Gavrilovic J, Russell DA. Angew. Chem., Int. Ed. 2005;44:6504–6508. doi: 10.1002/anie.200501920. [DOI] [PubMed] [Google Scholar]
- 2.Bradley M, Alexander L, Duncan K, Chennaoui M, Jones AC, Sanchez-Martin RM. Bioorg. Med. Chem. Lett. 2008;18:313–317. doi: 10.1016/j.bmcl.2007.10.075. [DOI] [PubMed] [Google Scholar]
- 3.Tang B, Liu X, Xu K, Huang H, Yang G, An L. Chem. Commun. 2007;36:3726–3728. doi: 10.1039/b707173f. [DOI] [PubMed] [Google Scholar]
- 4.Thomas JA, Buchsbaum RN, Zimniak A, Racker E. Biochemistry. 1979;18:2210–2218. doi: 10.1021/bi00578a012. [DOI] [PubMed] [Google Scholar]
- 5.Balut C, vande Ven M, Despa S, Lambrichts I, Ameloot M, Steels P, Smets I. Kidney International. 2008;73:226–232. doi: 10.1038/sj.ki.5002632. [DOI] [PubMed] [Google Scholar]
- 6.Pal R, Parker D. Chem. Commun. 2007;5:474–476. doi: 10.1039/b616665b. [DOI] [PubMed] [Google Scholar]
- 7.Wieder ED, Hang H, Fox MH. Cytometry. 1993;14:916–921. doi: 10.1002/cyto.990140810. [DOI] [PubMed] [Google Scholar]
- 8.Chesler M. Physiological Reviews. 2003;83:1183–1221. doi: 10.1152/physrev.00010.2003. [DOI] [PubMed] [Google Scholar]
- 9.Izumi H, Torigoe T, Ishiguchi H, Uramoto H, Yoshida Y, Tanabe M, Ise T, Murakami T, Yoshida T, Nomoto M, Kohno K. Cancer Treatment Reviews. 2003;29:541–549. doi: 10.1016/s0305-7372(03)00106-3. [DOI] [PubMed] [Google Scholar]
- 10.Mellman I, Fuchs R, Helenius A. Annu. Rev. Biochem. 1986;55:663–700. doi: 10.1146/annurev.bi.55.070186.003311. [DOI] [PubMed] [Google Scholar]
- 11.Gerweck LE, Seetharaman K. Cancer Res. 1996;56:1194–1198. [PubMed] [Google Scholar]
- 12.Deitmer JW, Rose CR. Progress in Neurobiology (Oxford) 1996;48:73–103. doi: 10.1016/0301-0082(95)00039-9. [DOI] [PubMed] [Google Scholar]
- 13.Jiao G-S, Thoresen LH, Burgess K. J. Am. Chem. Soc. 2003;125:14668–14669. doi: 10.1021/ja037193l. [DOI] [PubMed] [Google Scholar]
- 14.Han J, Jose J, Mei E, Burgess K. Angew. Chem., Int. Ed. 2007;46:1684–1687. doi: 10.1002/anie.200603307. [DOI] [PubMed] [Google Scholar]
- 15.Bandichhor R, Petrescu AD, Vespa A, Kier AB, Schroeder F, Burgess K. J. Am. Chem. Soc. 2006;128:10688–10689. doi: 10.1021/ja063784a. [DOI] [PubMed] [Google Scholar]
- 16.Klonis N, Sawyer WH. J. Fluoresc. 1996;6:147–157. doi: 10.1007/BF00732054. [DOI] [PubMed] [Google Scholar]
- 17.Molecular Probes. Invitrogen Corporation; 2006. http://probes.invitrogen.com. [Google Scholar]
- 18.Zanker V, Peter W. Chem. Ber. 1958;91:572–580. [Google Scholar]
- 19.Brasselet S, Moerner WE. Single Mol. 2000;1:17–23. [Google Scholar]
- 20.Geisow MJ, Evans WH. Exp. Cell. Res. 1984;150:36–46. doi: 10.1016/0014-4827(84)90699-2. [DOI] [PubMed] [Google Scholar]
- 21.Morris MC, Depollier J, Mery J, Heitz F, Divita G. Nature Biotech. 2001;19:1173–1176. doi: 10.1038/nbt1201-1173. [DOI] [PubMed] [Google Scholar]
- 22.Loudet A, Han J, Barhoumi R, Pellois J-P, Burghardt RC, Burgess K. Org. Biomol. Chem. 2008;6:4516–4522. doi: 10.1039/b809006h. [DOI] [PubMed] [Google Scholar]
- 23.Seksek O, Henry-Toulme N, Sureau F, Bolard J. Anal. Biochem. 1991;193:49–54. doi: 10.1016/0003-2697(91)90042-r. [DOI] [PubMed] [Google Scholar]
- 24.Llopis J, McCaffery JM, Miyawaki A, Farquhar MG, Tsien RY. Proc. Natl. Acad. Sci. 1998;95:6803–6808. doi: 10.1073/pnas.95.12.6803. [DOI] [PMC free article] [PubMed] [Google Scholar]
Associated Data
This section collects any data citations, data availability statements, or supplementary materials included in this article.
Supplementary Materials
Experimental procedures for the preparation of compounds 1 and BSA-1 conjugate are available free of charge via Internet at http://pubs.acs.org.


