Abstract
In Drosophila, widely-used mitotic recombination-based strategies generate mosaic flies with positive readout for only one daughter cell after division. To differentially label both daughter cells, we developed the Twin Spot Generator technique (TSG) and demonstrate that through mitotic recombination, TSG generates green and red twin spots in internal fly tissues, visible even as single cells. We discuss the wide applications of TSG to lineage and genetic mosaic studies.
Induction of labeled clones of cells, either wildtype or mutant, in whole organisms is arguably one of the most powerful experimental approaches of developmental biology. Mosaic analyses have been used extensively to answer questions concerning cell migration, proliferation, death and cell-shape changes, and to provide insights into the function of genes that, when mutated, would be lethal if homozygous in every cell. In recent years, the most powerful approach in Drosophila mosaic analyses has been the MARCM system (Mosaic Analysis with a Repressible Cell Marker1,2), which has provided cellular resolution to lineage analyses; but, because MARCM labels only one of the two daughter cells, its use precludes direct analysis of differential cell lineages or inter-lineage competition. Furthermore, expression of the marker following recombination in MARCM is not immediate as it relies on the loss of the GAL80 repressor, which can have variable perdurance. While specific approaches3,4 have been developed to mark multiple clones, we have developed a general technique, the Twin Spot Generator (TSG), whereby both daughter cells are directly and positively marked.
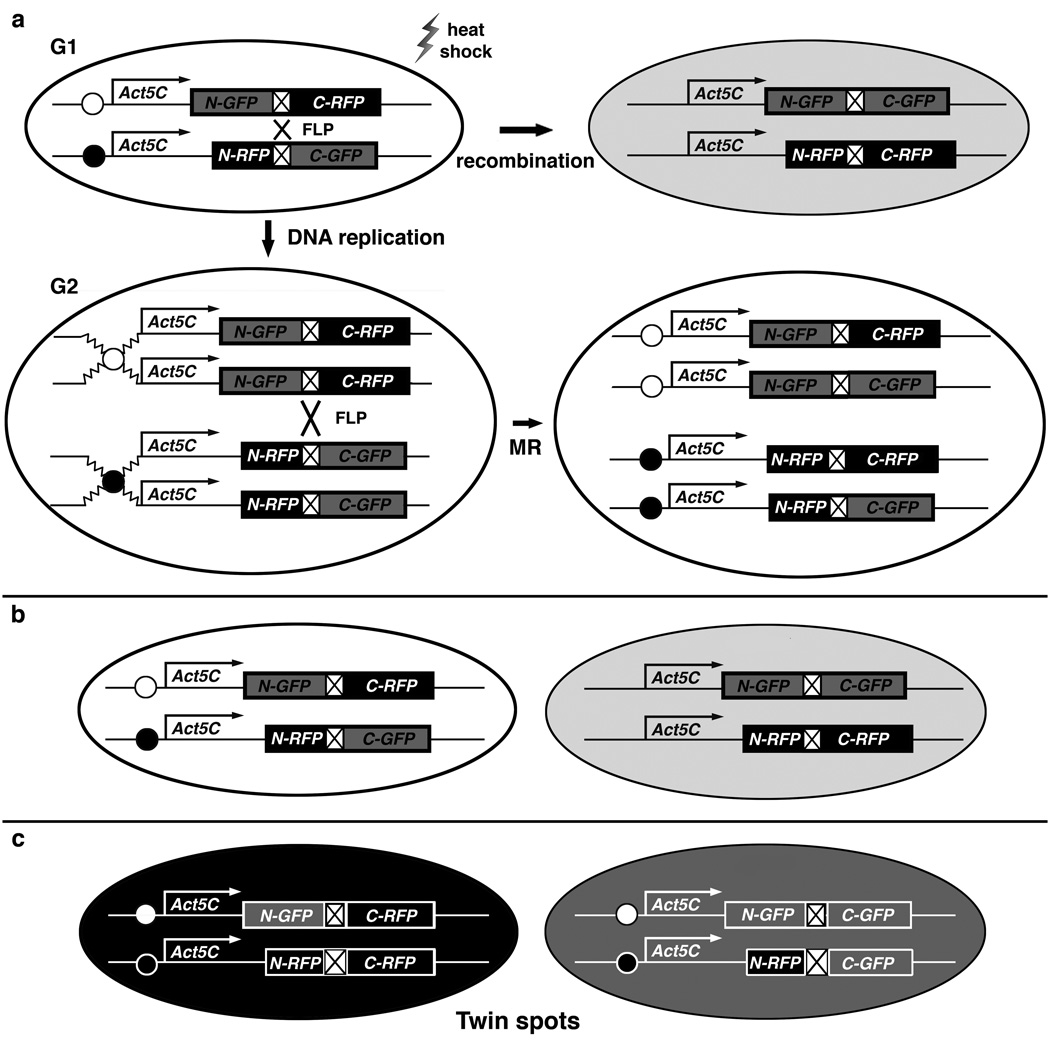
TSG is adapted from Mosaic Analysis with Double Markers (MADM), a Cre-lox recombination-based system in mice5. TSG induces MR through the FLP-FRT system of yeast6 to generate mosaic flies with red vs. green daughter cells or “twin spots“7 after cell division. As shown in Fig. 1, two perfectly-reciprocal hybrid sequences termed GR and RG coding for complementary regions of EGFP8 and mRFP19, are separated at their junctions by the same FRT-containing intron10 (Supplementary Tables 1 and 2). After induction of the FLP protein from a transgene driven by the heat shock (hs) promotor, recombination occurs at the FRT site with high efficiency. Transcriptional splicing generates full-length coding sequences, producing GFP and RFP to specifically mark recombinant cells; the color depends upon the stage at which recombination takes place and the subsequent segregation of the recombined chromosomes.
Fig. 1. TSG strategy.
(a) Top: G1 recombination between homologous chromosomes generates two genotypically-identical yellow daughter cells expressing both GFP and RFP (Only one daughter cell is shown in light gray). Bottom left: duplicated chromosomes at G2. Bottom right: chromatids in cell just after mitotic recombination (MR). (b–c) MR occurs after DNA replication at G2. (b) In G2-Z segregation, recombinant chromosomes go to the same pole to generate a yellow daughter cell carrying both recombinant chromosomes, and a colorless daughter cell, carrying both non-recombinant chromosomes. (c) In G2-X segregation, recombinant chromosomes go to opposite poles to generate twin spots; that is, one red daughter cell, shown in black, and one green, shown in gray, each carrying one recombinant chromosome.
In our experimental protocol (Supplementary Fig. 1), we constructed reciprocal GR and RG hybrid cassettes using PCR amplification (Supplementary Methods). We cloned GR and RG into a Gateway-based vector AWM which we had re-engineered to drive integration of inserted DNA into the Drosophila genome using the ϕC31 integrase for targeted genome transformation11 coupled with Recombination-Mediated-Cassette-Exchange (RMCE)12 (Supplementary Methods). Once inserted into this universal RMCE Destination vector AWM-2attB, we tested hybrid cassette function in tissue culture assays (Supplementary Fig. 2 and Supplementary Methods). We selected TSG candidate flies on the basis of eye color, amplified them, and isolated derivative lines (Supplementary Methods, for available TSG lines see Supplementary Table 3).
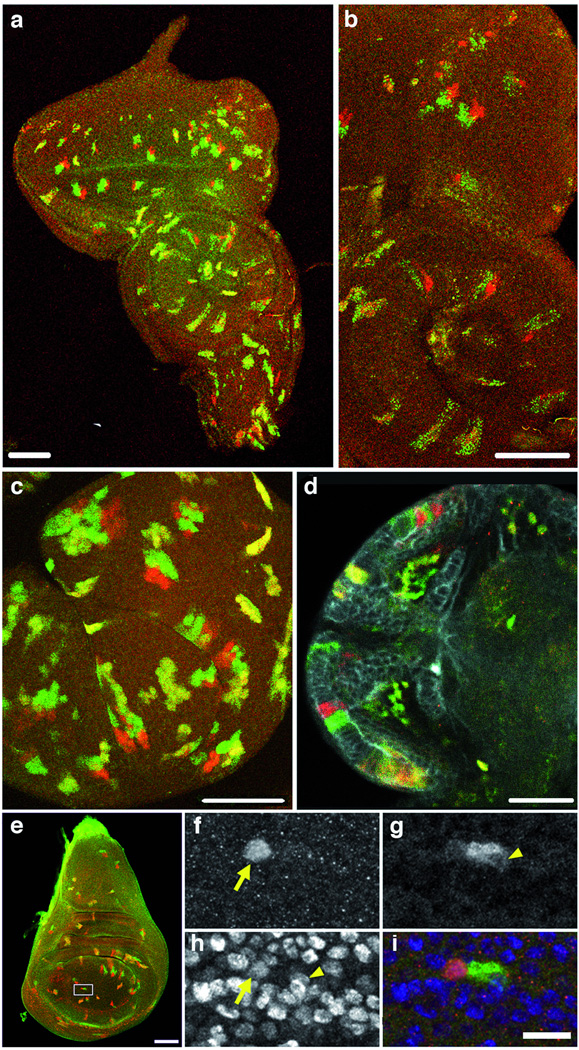
To test for twin spot appearance, we crossed flies, each homozygous for either GR or RG at the 82F7 site in the genome, to generate heterozygous GR-RG progeny (Fig. 1a, top left). We induced the hs-FLP transgene at different stages of development. Our results demonstrate that TSG flies generate signature red and green twin spots, detectable even as 2-cell clones, in tissues where progenitor cells were actively dividing at the time of the heat shock; control flies (not heat-shocked) showed no detectable signal (data not shown). Examples of TSG in flies are shown in Fig. 2 and Supplementary Fig. 3. Confocal imaging of imaginal discs without antibody staining detects bona fide red and green twin spots (representing G2-X segregation) as well as doubly-marked yellow cells (representing G1 or G0 recombination, or G2-Z segregation) (Fig. 2 a–c). The ratios of red-green twin spots to yellow clones in the imaginal discs and brain tissues varied (Supplementary Table 4) most likely reflecting differences in the fraction of cells in G1 and G2. We used antibody amplification of the fluorescent signals to detect twin spots in a larval brain (Fig. 2d). We show an example of a 2-cell clone issuing from the first cell division in an imaginal wing disc in Fig. 2e–i.
Fig. 2. TSG examples.
Red and green twin spots, and yellow clones, generated after MR at 82F7. (a–e) Bar scale: 50 um. (a–b) Initial GR-RG constructs, split at position 18 (Supplementary Methods). Eye-antennal imaginal disc. Dorsal up. Unstaged larvae: hs, 30–45 min, dissected at wandering third instar. (b) Enlargement reveals punctate GFP signal (Supplementary Table 1). (c–i) Final GR-RG constructs, split at position 349. GFP signal is homogeneous. (c) Haltere disc. Mid-third instar larvae: 30 min hs, dissected 24 h later. (d) Larval brain; anti-DsRed; anti-GFP; anti–DE-Cadherin stains the neuropil which gives rise to the optic lobe. Second instar larvae: 40 min hs, dissected 3–6 h later. (e) 2-cell clone in imaginal wing disc. Rectangle area enlarged in (f–i) Bar scale: 10 um. Yellow arrows point to one nucleus, and arrowheads to the other. (f) RFP expression. (g) GFP expression. (h) Nuclei stained with anti-histone. (i) Merged image.
We undertook a detailed study of the results generated by TSG in the imaginal discs with antibody staining. We asked whether the twins had equivalent cell numbers during normal disc development. We induced TSG clones in larvae at, 48 h after egg deposition (AED) and 72 h AED, using a mild heat shock (37°C for 20 minutes) to induce 0–10 TSG clones per disc. We dissected leg and eye-antennal discs from late-wandering larvae (120 h AED) and estimated the number of cells in each twin. We observed in both tissues that, on average, cell numbers in green and red clones were not different, indicating that the system is not biased in terms of green-red expression or viability. Furthermore, we calculated doubling times of 9.8 hours (± 1.2 h, N=24) over the second-third instar, and 11.8 hours (± 3.3 h, N=36) over the third instar (Supplementary Table 5), which are consistent with previously-published data13.
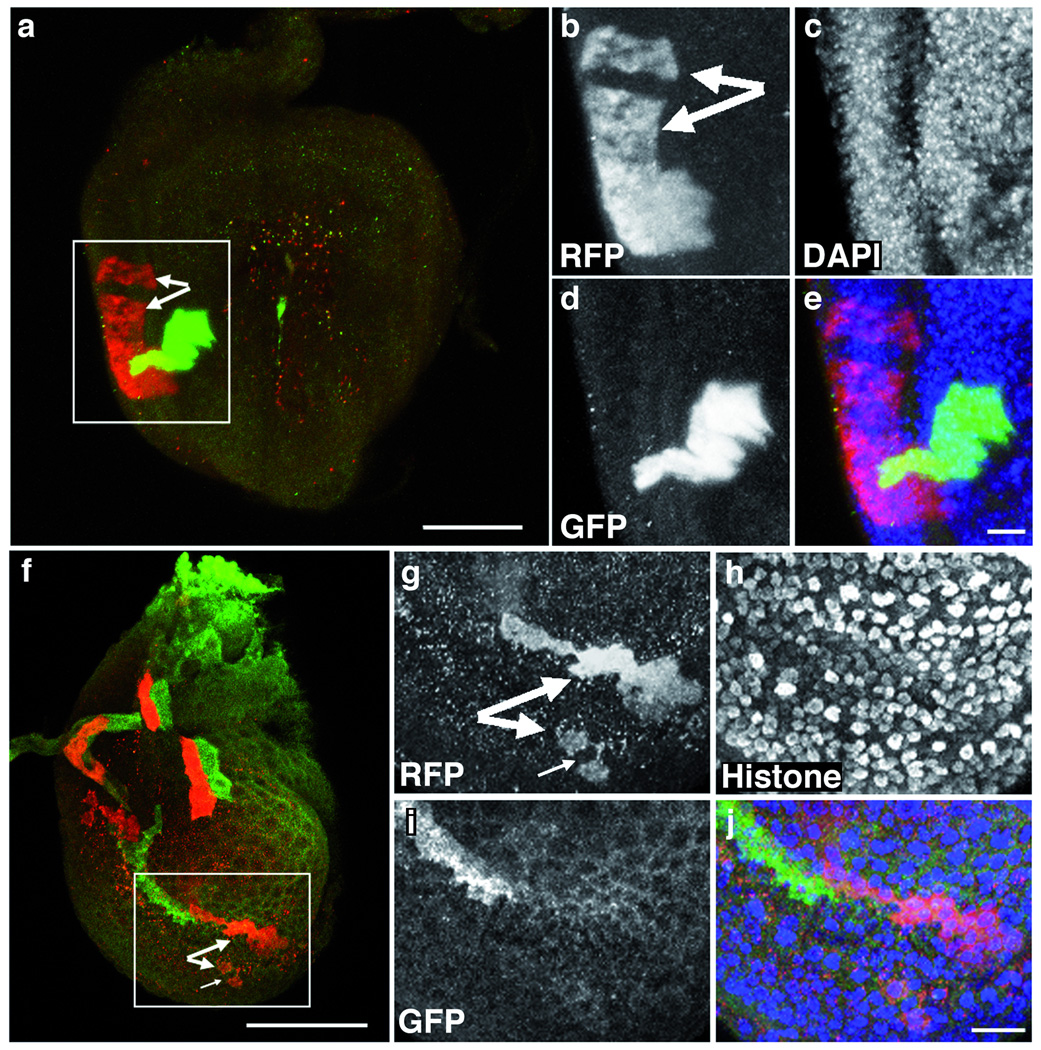
From the twin spots generated in leg discs, we made the novel observation that cells within a clone can separate. As shown in Fig. 3, separation was observed within a sister, or between sister clones (data not shown), indicating that cell migration can occur at different times during development; alternatively, clone separation might be a consequence of cell death and compensatory division of non-clonal cells. Out of 27 red-green twins induced in developing leg discs with an average of only one twin per disc, we found that 4 twins (15%) were separated (Fig. 3a–e) in the disc proper, whereas for the peripodial epithelium, we observed split clusters of cells with the same clonal marker in 6 out of 9 discs (Fig. 3f–j). We interpret these data as clone separation for several reasons: first, identically-marked cells are not contiguous; second, a nearby twin clone is not observed; finally, we have previously shown that cells of the disc peripodial epithelium are displaced to the disc proper13 suggesting that peripodial cells are more mobile than cells in the disc proper, and so, more likely to separate. Interestingly, others have observed higher than expected relative clone frequencies in the peripodial epithelium than in the disc proper (T. Kornberg, personal communication); clone separation may account for this higher clone frequency. We have seen clone separation in wing discs, though less frequently than in leg discs (data not shown); we have not observed it in eye-antennal discs. Clone separation may have been overlooked or difficult to document with traditional twin-spot techniques, especially in a highly-folded epithelium like the leg disc. While the significance of this phenomenon is unclear, we feel that the TSG system will be useful for revisiting cell lineage analysis in leg discs and other types of complex tissues
Fig. 3. Separation of clones in developing leg imaginal discs.
Projected z-series of late third-instar prothoracic leg discs with twin spots in: (a–e) the disc proper and (f–j) the peripodial epithelium. Dorsal is up. Bar scale is 50 µm in (a) and (f). We induced twin spots with MR at 82F7 with a 20 minute heat shock at 48 h AED, and fixed and stained discs at 120 h AED. We labeled samples in single-channel insets (b–d, g–i) with anti-DsRed to detect RFP (b, g), anti-GFP (d, i), and either DAPI (c) or anti-Histone (h) to mark nuclei. Big pairs of arrows (a, b, f, and g) indicate separated clones. The yellow color (a) is due to superposition of green/red clones in the projection. Small arrow (f, g) indicates an almost-separated clone. Merged images (e, j) demonstrate that clone separation is not due to damaged or missing cells. Bar scale is 10 µm in (e) and (j).
We showed here that TSG produces efficient differential labeling of daughter cell lineages in Drosophila, providing for the first time, direct comparative evidence for clonal separation during the development of imaginal leg discs in the fly. Furthermore, since TSG permits detection of 2-cell clones issuing from the first cell division, we can now define the earliest timepoint at which twin cell fates diverge with respect to form (Fig. 2f–i), proliferation, migration or viability. In this context, TSG should prove valuable in resolving questions concerning the asymmetric replication and directed migration of progenitor cells. In addition, TSG can be extended for use in genetic mosaic analyses by the introduction of a mutation distal to one of the color-coding cassettes (Supplementary Fig. 4) thereby providing a means to detect mutant-induced differential cell behavior from its inception: for example, to plot timelines of relative cell degeneration in models of neurodegenerative disease, altered metabolic signalling pathways, or the aging process; to distinguish mutant-induced cell shape changes from those caused by mechanical stress, or normal position-specific effects; and finally, because the borders between mutant and wild-type territories are defined at the single cell level, to detect the earliest consequences of a somatically-induced mutation in one cell on its wildtype sister; or vice versa, to probe whether a normal cell in a tissue environment can protect its targeted sibling from the effects of a newly-induced mutation known to adversely affect cells in culture.
Supplementary Material
Acknowledgments
We thank J. Zirin, M. Packard, F. Karch, P. Bradley and T. S. Griffin (TSG). This work was supported by grants from the National Institutes of Health: (1 RO1 GM61936, C.-t.W.; RO1 GM058282, G.S; RO1 GM084947, N.P) and a Ruth L. Kirschstein National Research Service Award (1 F32 GM67460, J.R.B); the National Science Foundation (AMH); the Swiss National Science Foundation (PBBE33-121069, M.B.) and the Leukemia and Lymphoma Society (C. B.).
Footnotes
Note : Supplementary information is available on Nature Methods website.
Competing Interests Statement : The authors declare that they have no competing financial interests.
References
- 1.Lee T, Luo L. Neuron. 1999;22:451–461. doi: 10.1016/s0896-6273(00)80701-1. [DOI] [PubMed] [Google Scholar]
- 2.Lee T, Luo L. Trends Neurosci. 2001;24:251–254. doi: 10.1016/s0166-2236(00)01791-4. [DOI] [PubMed] [Google Scholar]
- 3.de la Cova C, Abril M, Bellosta P, Gallant P, Johnston LA. Cell. 2004;117:107–116. doi: 10.1016/s0092-8674(04)00214-4. [DOI] [PubMed] [Google Scholar]
- 4.Spradling AC, Rubin GM. Science. 1982;218:341–347. doi: 10.1126/science.6289435. [DOI] [PubMed] [Google Scholar]
- 5.Zong H, Espinosa JS, Su HH, Muzumdar MD, Luo L. Cell. 2005;121:479–492. doi: 10.1016/j.cell.2005.02.012. [DOI] [PubMed] [Google Scholar]
- 6.Golic KG. Science. 1991;252:958–961. doi: 10.1126/science.2035025. [DOI] [PubMed] [Google Scholar]
- 7.Stern C. Genetics. 1936;21:625–730. doi: 10.1093/genetics/21.6.625. [DOI] [PMC free article] [PubMed] [Google Scholar]
- 8.Cormack BP, Valdivia RH, Falkow S. Gene. 1996;173:33–38. doi: 10.1016/0378-1119(95)00685-0. [DOI] [PubMed] [Google Scholar]
- 9.Campbell RE, Tour O, Palmer AE, Steinbach PA, Baird GS, Zacharias DA, Tsien RY. Proc. Natl. Acad. Sci. USA. 2002;99:7877–7882. doi: 10.1073/pnas.082243699. [DOI] [PMC free article] [PubMed] [Google Scholar]
- 10.Harrison DA, Perrimon N. Curr. Biol. 1993;3:424–433. doi: 10.1016/0960-9822(93)90349-s. [DOI] [PubMed] [Google Scholar]
- 11.Groth AC, Fish M, Nusse R, Calos MP. Genetics. 2004;166:1775–1782. doi: 10.1534/genetics.166.4.1775. [DOI] [PMC free article] [PubMed] [Google Scholar]
- 12.Bateman JR, Lee AM, Wu CT. Genetics. 2006;173:769–777. doi: 10.1534/genetics.106.056945. [DOI] [PMC free article] [PubMed] [Google Scholar]
- 13.McClure KD, Schubiger G. Development. 2005;132:5033–5042. [Google Scholar]
Associated Data
This section collects any data citations, data availability statements, or supplementary materials included in this article.


