Abstract
The human brain is extraordinarily complex, and yet its origin is a simple tubular structure. Characterizing its anatomy at different stages of human fetal brain development not only aids in understanding this highly ordered process but also provides clues to detecting abnormalities caused by genetic or environmental factors. During the second trimester of human fetal development, neural structures in the brain undergo significant morphological changes. Diffusion tensor imaging (DTI), a novel method of magnetic resonance imaging, is capable of delineating anatomical components with high contrast and revealing structures at the microscopic level. In this study, high-resolution and high-signal-to-noise-ratio DTI data of fixed tissues of second-trimester human fetal brains were acquired and analyzed. DTI color maps and tractography revealed that important white matter tracts, such as the corpus callosum and uncinate and inferior longitudinal fasciculi, become apparent during this period. Three-dimensional reconstruction shows that major brain fissures appear while most of the cerebral surface remains smooth until the end of the second trimester. A dominant radial organization was identified at 15 gestational weeks, followed by both laminar and radial architectures in the cerebral wall throughout the remainder of the second trimester. Volumetric measurements of different structures indicate that the volumes of basal ganglia and ganglionic eminence increase along with that of the whole brain, while the ventricle size decreases in the later second trimester. The developing fetal brain DTI database presented can be used for education, as an anatomical research reference, and for data registration.
Introduction
The human brain is arguably one of the most complicated organs in living systems. This elaborate structure originates from a simple neural tube, followed by a series of differentiation processes. In the past, this developmental process has been examined using classic histology-based methods (Rakic, 1972, 1988; Sidman and Rakic, 1973, 1982; Honig et al., 1996; Volpe, 2001). Comprehensive two-dimensional atlases have also become available recently (Bayer and Altman, 2004, 2005). Although these are valuable sources of anatomical reference, we still lack knowledge regarding the three-dimensional (3D) volumes and shapes of structures within the developing human brain.
Recently, magnetic resonance imaging (MRI) has been used to examine the anatomy of developing fetal brains of primate and human and to correlate it with histological analyses (Kinoshita et al., 2001; Kostović et al., 2002; Kroenke et al., 2005, 2007; Rados et al., 2006). Although conventional MRI is an effective technique to investigate the overall anatomy of the fetal brain, it does not provide clear contrast to differentiate various early structures inside the brain. Diffusion tensor imaging (DTI) is a relatively new MR technique that uses water diffusion as a probe to delineate the detailed structure of the human brain (Le Bihan et al., 1986; Moseley et al., 1990; Basser et al., 1994; Makris et al., 1997; Catani et al., 2002; Wakana et al., 2004; Mori et al., 2005). DTI provides two new contrasts over conventional MRI to visualize various brain structures, which have been difficult to identify previously; namely, diffusion anisotropy and fiber orientations. Compared with conventional MRI based on relaxation parameters, this technology has superior contrast to delineate the anatomy of premyelinated brains (Hüppi et al., 1998, 2001; Neil et al., 1998, 2002; McKinstry et al., 2002; Miller et al., 2002b; Mukherjee et al., 2002; Zhang et al., 2003; Maas et al., 2004; Partridge et al., 2004; Schneider et al., 2004; Deipolyi et al., 2005; Lee et al., 2005; Hermoye et al., 2006; Huang et al., 2006a,b).
In a previous publication, we applied this technique to create brain atlases of third-trimester fetuses and newborns (Huang et al., 2006b). In this paper, with DTI color map and tractography, we found that corpus callosum and uncinate and inferior longitudinal fasciculi become apparent during this period. Three-dimensional reconstruction shows that major brain fissures appear while most of the cerebral surface remains smooth until the end of the second trimester. A dominant radial organization was identified at 15 gestational weeks, followed by both laminar and radial architectures in the cerebral wall throughout the remainder of the second trimester. The morphology of subcortical structures does not change. Volumetric measurements of different structures indicate that the volumes of basal ganglia and ganglionic eminence increase along with the whole brain, while the ventricle size decreases in the later second trimester.
Materials and Methods
Samples.
Postmortem samples of 13–22 gestational week human fetal brains (n = 3 at each gestational week) were borrowed from the University of Maryland Brain and Tissue Bank for Developmental Disorders (National Institute of Child Health and Human Development contract no. N01-HD-4-3368 and N01-HD-4-3383). The samples were fixed with 4% paraformaldehyde in PBS and kept immersed in the fixation solution until 48 h before the MR experiments. The samples were then put into PBS to wash out the fixative and to replace the fixation solution inside the tissue. The samples were bathed with PBS in a custom-made MR-compatible chamber throughout the MR scanning.
Imaging protocol.
3D multiple spin echo diffusion tensor imaging was performed in both 11.7 T and 4.7 T Bruker scanners. Multiple echo (number of echoes = 8) sequence was adopted to improve the signal-to-noise ratio. Thirteen to sixteen week fetal brains were scanned in an 11.7 T Bruker scanner with a micro 2.5 30 mm inner diameter. Bruker volume coil. Fetal brains over 17 weeks gestation were scanned in a 4.7 T Bruker scanner with a 70 mm inner diameter. Bruker volume coil. These volume coils were used as both the radio frequency signal transmitter and receiver. A set of diffusion-weighted images (DWIs) were acquired in seven linearly independent directions. Diffusion sensitizing gradients with b value 1000 s/mm2 were applied along six different orientations: [0.707, 0.707, 0], [0.707, 0, 0.707], [0, 0.707, 0.707], [−0.707, 0.707, 0], [0.707, 0, −0.707], and [0, −0.707, 0.707]. DWI parameters for the 11.7 T scanner were as follows: effective TE = 67 ms, TR = 0.8 s, FOV = 25–35 mm/25–35 mm/25–35 mm, imaging matrix = 128 × 80 × 80 (zero filled to data matrix = 128 × 128 × 128). The imaging resolution was 200 to 400 μm for fetal brains between 13 and 16 weeks of gestation. DWI parameters for the 4.7 T scanner were: effective TE = 66 ms, TR = 0.8 s, FOV = 40–52 mm/40–52 mm/40–52 mm, imaging matrix = 128 × 72 × 72 (zero filled to data matrix = 128 × 128 × 128). The imaging resolution was 300 to 600 μm for fetal brains between 17 and 21 weeks of gestation. The total imaging time was ∼20 h with two signal averages for DTI data acquisition at both 4.7 T and 11.7 T.
Postprocessing and visualization of DTI.
The diffusion-weighted images were transferred to an off-line PC workstation and processed by DtiStudio (Jiang et al., 2006). Six elements of diffusion tensor were determined by multivariable least-square fitting using the following equation:
 |
where D̿ is a 3 × 3 symmetric tensor, Ḡ is a gradient vector, γ is the gyromagnetic ratio, and S and S0 are signal intensities with and without diffusion weighting. The tensor was diagonalized to obtain three eigenvalues (λ1–3) and eigenvectors (ν1–3). Anisotropy was measured by calculating fractional anisotropy (FA) (Pierpaoli and Basser, 1996):
 |
The eigenvector associated with the largest eigenvalue (ν1) was used as an indicator of the fiber orientation. For the color-coded orientation map, red (R), green (G), and blue (B) colors were assigned to left–right, anterior–posterior, and superior–inferior orientations, respectively. For the color presentation, 24-bit color was used in which each RGB color had an 8-bit (0–255) intensity level. The vector ν1 (=[ν1x, ν1y, ν1z]) was a unit vector that always fulfills a condition, ν1x2 + ν1y2 + ν1z2 = 1. Intensity values of ν1x2 × 255 were assigned to the R channel, ν1y2 × 255 to the G channel, and ν1z2 × 255 to the B channel. To suppress orientation information in isotropic brain regions, the 24-bit color value was multiplied by the FA to calculate the color-encoded maps. Average diffusion-weighted images (aDWIs) were obtained by adding all diffusion-weighted images. In 2D images of structure annotations, both color-encoded maps and aDWIs have been cropped so that the areas outside the brains are not shown.
Structure annotation and reconstruction.
Brain structures were assigned and annotated based on a histology atlas of second-trimester fetal brains (Bayer and Altman, 2005). The following brain structures were clearly identified in MRI/DTI and manually segmented using RoiEditor (www.mristudio.org): ventricle, thalamus, ganglionic eminence (GE), putamen (includes globus pallidus), caudate, and cerebral layers. The caudate nucleus and GE were distinguished by their differences in diffusion anisotropy; the GE had a higher anisotropy than the caudate nucleus (Huang et al., 2006). To check the reproducibility of the manual segmentation, we manually segmented all the brain structures three times. The time interval of each round of manual segmentation was at least 1 week. The coefficient of variation (CV), defined as ratio of the SD to the mean, was calculated to measure the reproducibility. After tissue segmentation, their volumes were measured. Cerebral surface area was also calculated by adding the area of all triangular meshes constituting the surface.
Measurement of thickness of the cortical plate and subplate.
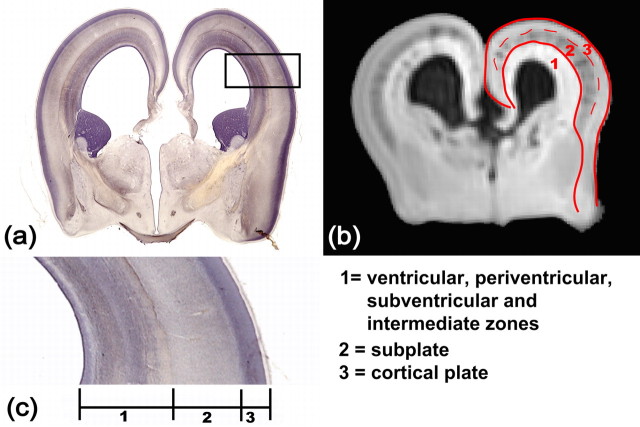
As shown in Figure 1, three compartments can be differentiated in the cerebral wall by aDWI, which are the cortical plate, the subplate, and deep-to-subplate layers (Maas et al., 2004; Huang et al., 2006b). The deep-to-subplate layers consist of the intermediate zone, the subventricular zone, the periventricular zone, and the ventricular zone (Kostović et al., 2002), but they are difficult to differentiate by MRI/DTI. The distinction of the cortical plate and the subplate is also often difficult, especially in early-second-trimester brains. For cortical segmentation, we combined the cortical plate and subplate (CP+SP) as shown in Figure 1.
Figure 1.
Layers of the developing cerebral cortex. a–c show a coronal histological slide of a 17 week fetal brain, a coronal MRI aDWI slice of a 17 week fetal brain, and an enlarged piece of the cerebral wall, respectively. In b, aDWI contrast clearly differentiates three layers that correspond to those regions in a and c. The red contour is the boundary of the cortical plate and subplate (CP+SP). The dashed red curve separates the cortical plate and subplate. The annotation of each layer is shown at the bottom right panel.
Measurement of the thickness was based on triangular meshes that build up the surface, as shown in supplemental Figure 1, a and b (available at www.jneurosci.org as supplemental material). For each triangle from the surface rendering of the CP+SP, there is a normal vector that is perpendicular to this triangle. The intervals of this normal vector between Figure 1's solid red lines, which constitute two bounded surfaces of CP+SP in 3D, determine the thickness. Compared with the thickness measurement in 2D images, thickness along the normal vectors of the surface is more accurate, as it provides information of the shortest distance between two surfaces.
Measurement of the angle between the tensor primary eigenvector and the normal surface vector.
The normal vector of each triangle and primary eigenvector of the diffusion tensor were used to determine the angles between them, which directly provided information about how the primary eigenvectors of the diffusion tensor align with the normal vector of the surface. A cortical surface formed by hundreds of thousands of triangular meshes is shown in supplemental Figure 1a (available at www.jneurosci.org as supplemental material) with the enlargement of one piece of surface shown in supplemental Figure 1b (available at www.jneurosci.org as supplemental material). Supplemental Figure 1c (available at www.jneurosci.org as supplemental material) demonstrates measurement of the angle between the diffusion tensor primary eigenvector and the surface normal vector. This angle is restricted from 0 to 90°.
Normalization of thickness and angle.
To obtain a population average of CP+SP thickness and angles between the surface normal vector and the diffusion tensor primary eigenvector, a two-step cross-sample registration was conducted at each time point, as demonstrated in supplemental Figure 2 (available at www.jneurosci.org as supplemental material). Due to the limited samples at each time point and extremely soft and fragile character of the postmortem fetal brains, we used one brain that was symmetric and had the least amount of deformation in each age group as a normalization template. The first step was a three-dimensional, 12-mode affine registration by automated image registration (Woods et al., 1998) based on aDWI images. This linear transformation transforms the brains to the same orientation and size. In the third and fourth columns of supplemental Figure 2 (available at www.jneurosci.org as supplemental material), the red contour was defined by setting the intensity threshold of the template and was overlaid on each image as guide. It can be observed that the outer surface of CP+SP is not well aligned. The second step was fine registration by large deformation diffeomorphic metric mapping (LDDMM) transformation (Miller et al., 2002a) based on the binary image, as only the outer surface of the brains needed to be aligned well for calculating the average thickness and angle. LDDMM is a nonlinear registration process. The outer surfaces of the two subjects matched well with the template boundary (supplemental Fig. 2, available at www.jneurosci.org as supplemental material). The final transformation matrix from aDWI images at each step was then applied to the three-dimensional cerebral layer thickness and vector/surface angle images. Even with the two-step registration process, specimens were not perfectly aligned with the template at some locations, shown as the fourth column of supplemental Figure 2 (available at www.jneurosci.org as supplemental material). At the voxels with imperfect registration, nearest neighbor interpolation was used to extrapolate the nonregistered information to the nearest template locations. After normalization, the average thickness and angle were displayed at the surface of the brain using a color coding assigned to each surface triangle.
DTI-based fiber tractography and ROI drawing strategy.
For visual assistance, identified white matter tracts were three-dimensionally reconstructed using the fiber assignment by a continuous tracking method (Mori et al., 1999). For the reconstruction, a fractional anisotropy threshold of 0.15 and an inner product threshold of 0.75 were used. As the organization of the white matter tracts of the fetal brain is relatively simple compared with that of the adult human brain, single region of interest (ROI) or seed region has been implemented for most tractography. Tracking protocol for cingulum and corpus callosum were similar to that used in our reproducibility study (Wakana et al., 2007) for the adult human brain since the relative locations of these tracts in the brain hardly change from fetal to adult brains. Fiber tracking of brainstem tracts, namely inferior and middle cerebellar peduncle in this study, also followed the protocol used for the adult human brain (Stieltjes et al., 2001) for the same reason. ROIs for other tracts were identified by the annotation from previous step. The single ROI for fornix, which is labeled in third row of Figure 2a, included a small blue region just posterior to the midpoint of the anterior commissure in an axial plane. Using the entire cerebral peduncle in an axial plane of the decussation of the superior cerebellar peduncle as the single ROI, we could trace the internal capsule. For 19 week or older fetal brains, the green regions close to the ganglionic eminence could be identified as sagittal striatum in the third row of Figure 2, a (axial slice) and b (coronal slice). ROIs for tractography of sagittal striatum were drawn there to include those green regions. The bright blue dot at the anterior temporal lobe in the axial plane of the decussation of the superior cerebellar peduncle was used as ROI for tracing uncinate fasciculus, and details can be found in our previous publication (Huang et al., 2006b). The ROI for tracing external capsule could be found in the axial plane just above the midsagittal corpus callosum as two symmetric thin blue areas close to putamen for 13–15 week fetal brains.
Figure 2.
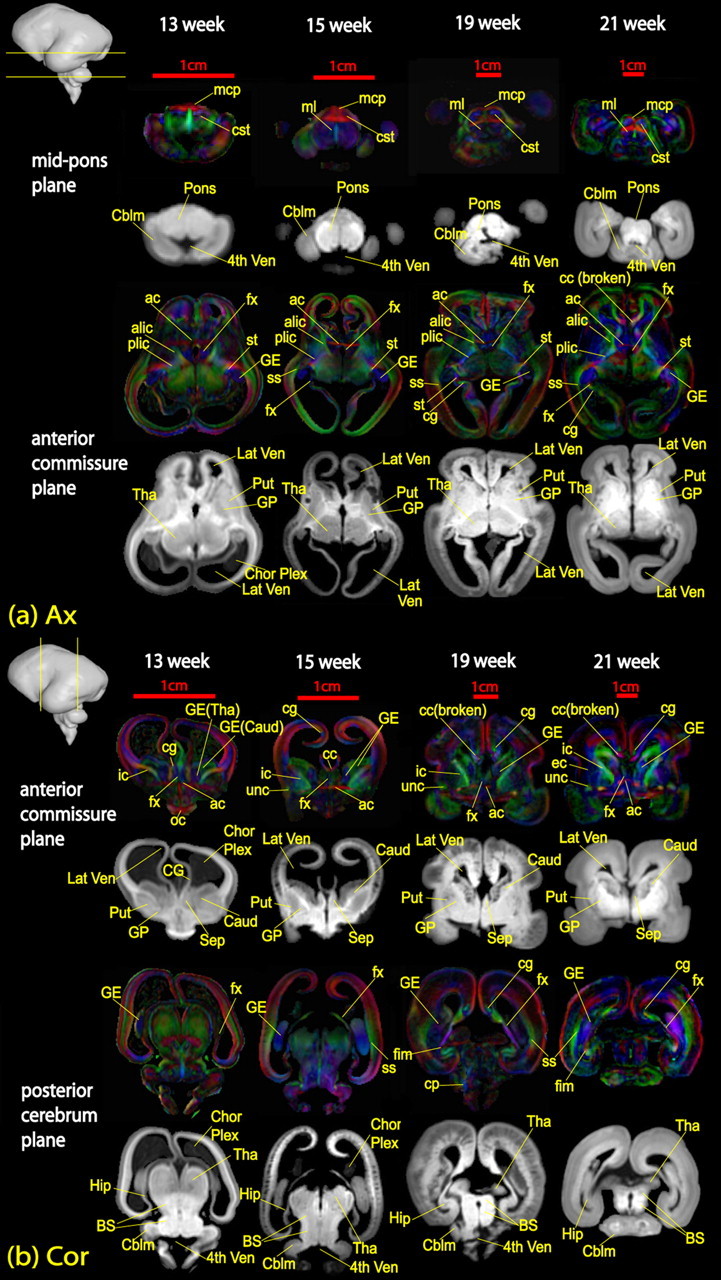
Annotation on axial (a) and coronal (b) slices of fetal brains at 13, 15, 19, and 21 weeks of gestational age. The location of each plane of optical section is demonstrated as yellow lines across the brain in the top left corner of each image. White matter fibers are labeled on color-encoded maps, while other structures are labeled on aDWI images. ac, Anterior commissure; acr, anterior region of corona radiata; alic, anterior limb of internal capsule; cbt, corticobulbar tracts; cc, corpus callosum; cg, cingulum; cp, cerebral peduncle; cst, cortical spinal tract; dscp, decussation of superior cerebellar peduncle; ec, external capsule; fx, fornix; icp, inferior cerebellar peduncle; ifo, inferior fronto-occipital fasciculus; ilf, inferior longitudinal fasciculus; middle cerebellar peduncle; mcp, middle cerebellar peduncle; ml, medial lemniscus; oc, optical chiasm; on, optical nerve; plic, posterior limb of internal capsule; ros, rostrum; scp, superior cerebellar peduncle; scr, superior region of corona radiata; splen, splenium; st, stria terminalis; unc, uncinate fasciculus vof, vertical occipital fasciculus; IV Ven, fourth ventricle; Aqu, aquarium; Caud, caudate; Cblm, cerebellum; Chor Plex, choroid plexus; CP, cortical plate; FL, frontal lobe; GE, ganglionic eminence; IG, insular gyrus; Lat Ven, lateral ventricle; Put, putamen; SP, subplate; Tha, thalamus; Put, putamen.
Results
White matter tracts
The DTI-derived images provide unique contrasts of white matter fiber bundles. Figure 2 shows the 2D DTI atlas of a second-trimester brain with color-encoded maps and aDWIs. For a comprehensive illustration of the brains, 2D slices in two orientations, i.e., axial and coronal, are displayed. Various white matter structures that can be seen in these images are assigned and annotated. Furthermore, the DTI based tractography reveals information on the global morphology of individual tracts during development. Three-dimensionally reconstructed white matter tracts of fetal brains at 13, 15, and 19 weeks are shown in Figure 3. Tracts in the brainstem and limbic tracts are among those developing early and before the second trimester. During the second trimester, some commissural and association tracts, specifically the corpus callosum and uncinate and inferior longitudinal fasciculi, become apparent.
Figure 3.
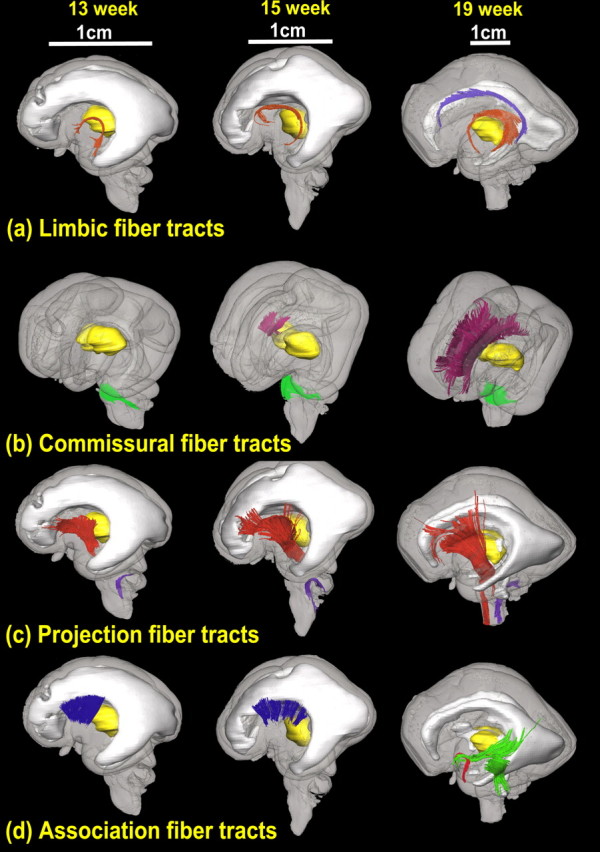
3D depiction of developmental white matter fibers. a is a lateral view of limbic tracts where pink fibers in 13, 15, and 19 week brains are the fornix and stria terminalis and purple fibers in the 19 week brains indicate the cingulum bundle. b is an oblique view of the commissural fibers, where pink and green fibers in 13, 15, and 19 week brains are the corpus callosum and the middle cerebellar peduncle, respectively. c is a lateral view of projection fibers, where red and purple fibers in 13, 15, and 19 week brains are the cerebral peduncle and the inferior cerebellar peduncle, respectively. d is a lateral view of association tracts, in which blue fibers in brains of 13 and 15 weeks are the external capsule, and green and red fibers in a brain of 19 weeks are the inferior longitudinal fasciculus/inferior fronto-occipital peduncle and uncinate fasciculus, respectively. For anatomical guidance, the thalamus (yellow structure in a–d) and the ventricles (gray structure in a, c, d) are also shown.
Tracts in the brainstem [Figs. 2a (mid-pons level), 3b (green fibers), 3c (purple fibers)]
At 13 weeks, the pontine crossing tract (pct) and the corticospinal tract (cst) can already be identified. At 15 weeks, the pct increases its volume and completely surrounds the cst; the configuration is similar to the adult brain. During 15–21 weeks, the cst increases its size relative to the pons. Simultaneously, the middle and inferior cerebellar peduncles and the medial lemniscus become clearly visible. From Figure 3, b and c, the middle and inferior cerebellar peduncles are observed from 13 weeks.
Limbic tracts (Figs. 2, 3a)
Limbic tracts analyzed include the stria terminalis (st), fornix (fx), and the cingulum (cg) bundle. Among these tracts, the st and the fx, which are relatively small tracts in adult brains, can be appreciated as major tracts at 13 weeks [Figs. 2a (at the level of the anterior commissure), 3a]. In contrast, the cg bundle can be traced only after 17 weeks (Fig. 3a).
Commissural tracts (Figs. 2, 3b)
Figure 2 demonstrates the development of the commissural tracts. In a 13 week fetal brain, the corpus callosum cannot be identified, while the middle cerebellar peduncle, optic chiasm and anterior commissure are observed. The corpus callosum appears at 15 weeks; however, the midsagittal corpus callosum of the fetal brain is extremely fragile and often severed (e.g., 19 and 21 week brains). In these cases, such fiber tracts had to be identified in parasagittal or axial slices.
Projection tracts (Figs. 2, 3c)
The internal capsule is recognizable early in development at 13 weeks (Fig. 2a,b, anterior commissure plane). It is a good landmark for delineating the ganglionic eminence and caudate nucleus from the putamen and globus pallidus (Fig. 2b, anterior commissure plane). Throughout development, the internal capsule expands from its core to more anterior and posterior areas [Figs. 2b (anterior commissure plane), 3c].
Association tracts (Figs. 2, 3d)
The sagittal stratum and the external capsule contain major association fibers. The initial formation of these different fiber tracts occurs at different stages. The uncinate fasciculus (unc) and sagittal stratum appear at 15 weeks (Fig. 2). With DTI-based tractography, the external capsule (ec) can be traced in early-second-trimester brains at 13 or 15 weeks, but the inferior fronto-occipital fasciculus (ifo, part of sagittal stratum), inferior longitudinal fasciculus (ilf, part of sagittal stratum), or unc cannot be traced in these brains. For 19 week brains, ifo, ilf, and unc can be traced, shown as Figure 3d. Unlike the corpus callosum or internal capsule, these association fibers do not undergo significant development during the second trimester. As we have reported in previous studies (Huang et al., 2006b; Zhang et al., 2007), the superior longitudinal fasciculus is not prominent, even at birth.
Other tracts (Fig. 4)
Figure 4.
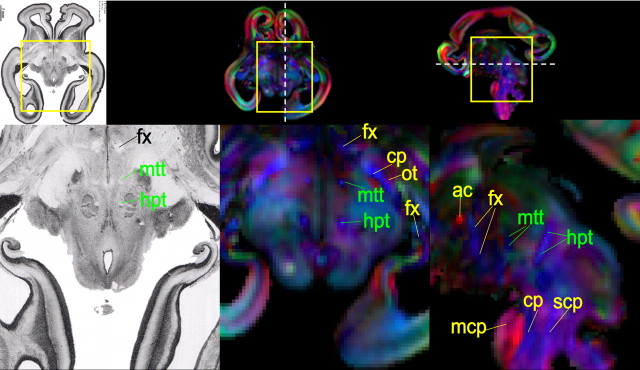
Mammillothalamic and habenular–interpeduncular tracts in a histological slide and in axial and sagittal color-encoded maps of a 15 week fetal brain. These two tracts are annotated with green font, while other tracts are indicated with yellow font. Please see abbreviation list of Figure 2 for full names of other tracts.
In addition to the four major groups of tracts, there are some tracts that connect different nuclei and cannot be easily identified in adult brains. In Figure 4 (left), mammillothalamic (mpt) and habenular–interpeduncular (htt) tracts are evident in histological sections (Bayer and Altman, 2005). The axial and sagittal color-encoded maps (Fig. 4, middle and right) of the same 15 week fetal brain clearly reveal these two tracts. From our data, these tracts are easily delineated in 13–17 week fetal brains.
The cerebral wall
Not only can various white matter fiber bundles be characterized, the organized development of the cerebral wall can also be revealed with DTI. First, 3D reconstruction directly demonstrates that the major sulci form sequentially. Second, thickness of the CP+SP in the cerebral wall can be characterized and displayed in 3D. Third, with the orientation information of diffusion tensor primary eigenvector in the cerebral wall, the microstructure of the cerebral wall can be visualized. Angle measurement shows how the diffusion tensor primary eigenvector on the surface aligns with the surface normal vector.
Sulcal formation
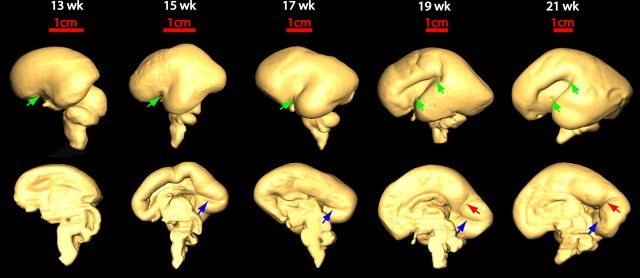
Figure 5 shows lateral (top row) and medial (bottom row) views of three-dimensional reconstruction of one hemisphere of fetal brains between 13 and 21 weeks of gestation. Different sulci are delineated by different colored arrows. In lateral view, the thickening and widening of the Sylvian fissure is most obvious. Figure 5 also demonstrates the order of the sulcal formation: the Sylvian fissure appears first; followed by the calcarine fissure and central sulcus; and finally, the parieto-occipital sulcus emerges.
Figure 5.
Three-dimensional reconstruction of the lateral (top row) and medial (bottom row) surface of 13–21 week brains to reveal the development of the Sylvian fissure (green arrow), the calcarine fissure (blue arrow), and the parieto-occipital sulcus (red arrow), respectively.
Thickness of CP+SP
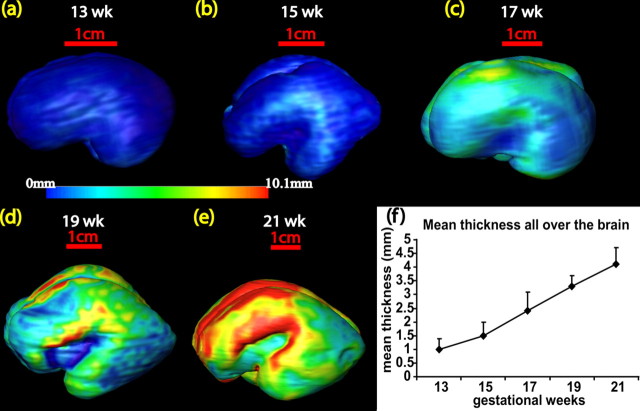
During the second trimester, the thickness of the cortical layer undergoes an inhomogeneous increase. Figure 6a–e shows thickness profiles across the cortical surface at different developmental stages. Thickness maps were generated by averaging over three subjects at each time point. The thickness across different cortical areas was averaged, yielding a simple scale value shown in Figure 6f. At 13 weeks, the average thickness over the whole brain is ∼1.0 mm. This increases more than threefold to reach 4.1 mm by 21 weeks of gestation. At 13–15 weeks, the lateral part of the brain is thicker than the other areas (Fig. 6a,b), correlating with the lateral to medial gradient of development of the cerebral cortex. The thickness profile changes significantly at later stages of development. At 21 weeks, the frontal and superior temporal parts of the brain are thickest. The CP+SP develop in an anterior to posterior direction, which is consistent with the increase in corpus callosum development shown in Figure 3b.
Figure 6.
Averaged thickness profiles of the CP+SP across the cortical surface for 13–21 week gestation brains (a–e). Color bar indicates the thickness. A summary of the increase in cortical growth is shown in f.
Visualization of the microstructure of the cerebral wall
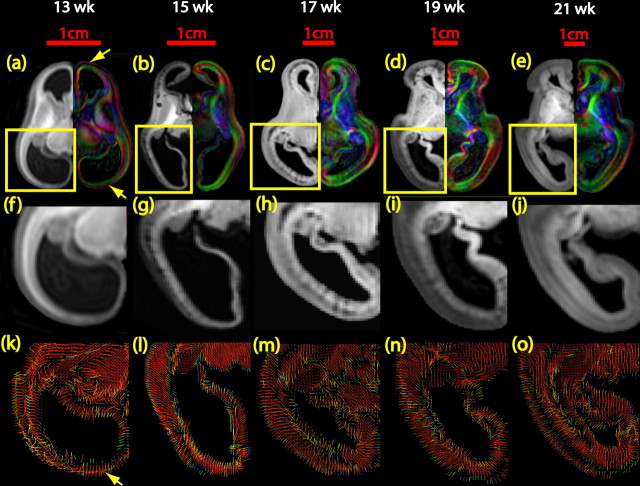
Diffusion tensor imaging can lend insight into the structure of the cerebral wall of the fetal brain because the water diffusion properties are strongly influenced by tissue microstructure (McKinstry et al., 2002). Unlike the adult human brain where the fractional anisotropy of the cortex is low, the fractional anisotropy of the developing fetal brain cortex is high (Fig. 2), indicating an organized structural orientation. Figure 7a–e shows the axial images of aDWI on the left and the color-encoded map on the right at the level of the middle cerebrum. Figure 7f–j is the enlarged cerebral wall of the aDWI images, and Figure 7k–o displays the primary eigenvector map where the color encodes the magnitude of the eigenvector projection in that plane. No clear columnar organization was observed in the 13 week fetal brains, yet three laminar compartments could be observed (Fig. 7f). Interestingly, there are clear red bands at the anterior and posterior portion of the color map (Fig. 7a, yellow arrows). The red bands are consistently observed in all three samples at this time point and indicate left-to-right oriented structures that are evident in Figure 7k. In the enlarged aDWI images (Fig. 7g–i), from 15 to 19 weeks gestation, the radial alignment within the cortex is visible, across the laminar organization. Compared with the 13 week brains, the anterior and posterior portions of the color-encoded maps are mostly green (Fig. 7b–e), indicating anterior-to-posterior oriented structures. These radial structures are evident in the visualization of the primary eigenvectors (Fig. 7l–n). For the 21 week brains, the visualization of the primary eigenvectors still reveals a dominant radial organization (Fig. 7o).
Figure 7.
Delineation of cerebral wall structures for brains of 13–21 weeks of gestational age. In a–e, aDWI images are placed on the left, and the color-encoded map is placed on the right for brains at each gestational stage. Enlarged cerebral wall in f–j reveals multiple layers. k–o depict the visualization of the primary eigenvector of the tensor within the cerebral wall.
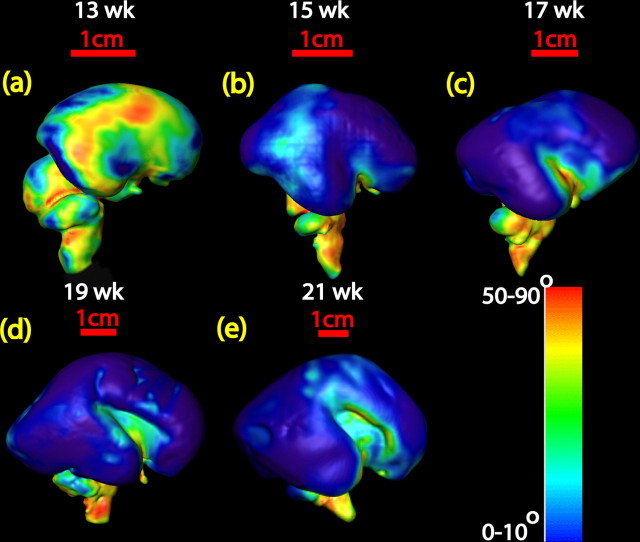
Figure 7k–o illustrates the existence of both tangential and radial microstructures in the second-trimester fetal brains. To further quantify the orientation of these microstructures, the diffusion tensor primary eigenvector/surface angle measurements provide a unique view of the direction of these structures relative to the surface. In Figure 8a–e, except for the brains at 13 and 15 weeks, the blue color predominates in most areas of the hemisphere, indicating that the primary eigenvector is almost perpendicular to the local triangular mesh plane. The colors, other than blue, reveal the tangential, rather than radial, structures on the surface.
Figure 8.
a–e, Display of the angles between the diffusion tensor primary eigenvector and normal vector of the surface triangular meshes for 13–21 week brains. Color bar indicates the quantification of the angle. Except for the brains of 13 and 15 week gestational age, most angles measured are from 0 to 10°, which is demonstrated with blue color on the surface of each brain.
Three-dimensional reconstruction and quantitative assessment of subcortical brain structures
Multiple subcortical structures can be identified and segmented using the high contrast of aDWIs and color-encoded maps: the caudate nucleus, putamen, globus pallidus, ganglionic eminence, thalamus, hypothalamus, and ventricles. The test–retest accuracy of the manual segmentation of these structures was 4.9 ± 2.2%. Three-dimensional reconstruction demonstrates the morphological changes of these structures during the second trimester from 13 to 21 weeks (Fig. 9). Quantitative information about the structural volume can be acquired with manual segmentation. Figure 9a shows a three-dimensional reconstruction of the total brain and segmented subcortical structures. The first row shows the whole brain (gray) as a reference; the second row shows the ventricle; and the third row shows the ganglionic eminence (red), thalamus (yellow), and caudate nucleus (green). At 13 weeks of gestation, the brain surface is smooth and the initial folding of the Sylvian fissure is evident. The Sylvian fissure is more apparent at 15 weeks and prominent by the end of the second trimester. The ventricles are the brain's dominant structure early in the second trimester, with clear enlargement at the anterior horns of the lateral ventricles. Thinning of the anterior, inferior, and posterior horns of the lateral ventricles through development was observed (Fig. 9a). From 13 to 21 weeks of gestation the shape of the ganglionic eminence and the basal ganglion remain almost unchanged. Figure 9b–d quantitatively depicts the absolute and normalized volume change of the brain structures and cerebral surface area. The volumes of the basal ganglia and the ganglionic eminences increase with development, whereas the volume of the ventricle decreases later in the second trimester (Fig. 9b). Note that the ganglionic eminences are transient and are replaced by the caudate, the putamen, the globus pallidus, and basal ganglia later in development (Sidman and Rakic, 1982). Its volume, however, still undergoes a steady increase resulting in the normalized volume of the basal ganglia and ganglionic eminence fluctuating in a range of <2% throughout the second trimester, while the relative size of the ventricles drops dramatically from ∼25 to 5% (Fig. 9d). The normalized volume of the thalamus also decreases slightly throughout this period. This relative volume decrease of the ventricles and the thalamus is partly compensated for by a volume increase of the cortical plate and subplate (Fig. 9d). The volume of the whole brain grows almost linearly during this period, as does the cerebral surface (Fig. 9c).
Figure 9.
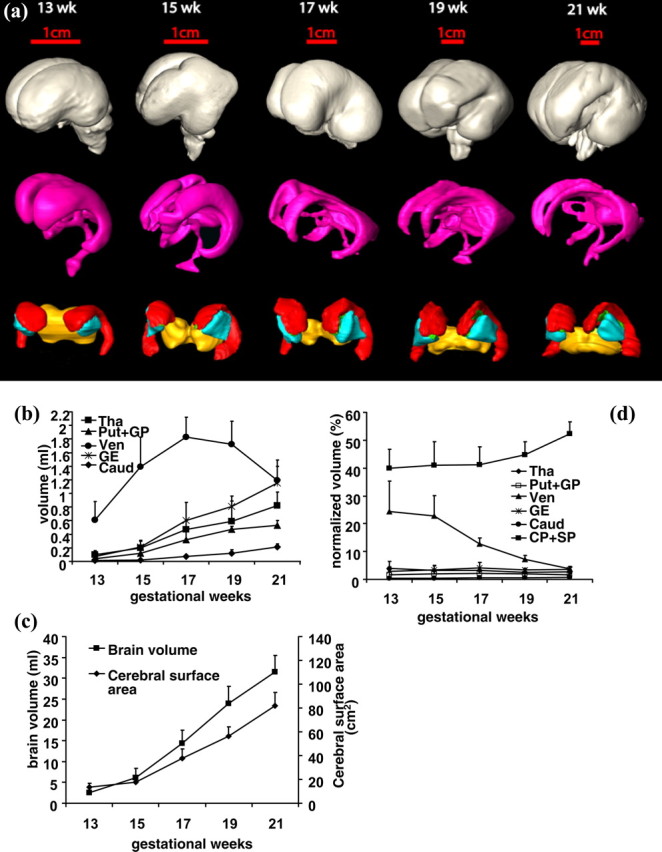
Three-dimensional reconstruction of the basal ganglia and ganglionic eminence (bottom row of a), ventricle (middle row of a), and whole brain (top row of a). Different colors represent different brain structures: whole brain (gray), ventricle (pink), ganglionic eminence (red), putamen and globus pallidus together (cyan), thalamus (yellow), and caudate nucleus (green). b–d show the quantitative volume and surface measurement of these structures. b and d are absolute and normalized volumes of major brain structures during the second trimester, respectively. c is the total brain volume and cerebral surface area during this period.
Discussion
We have provided the first DTI atlas and quantitatively assessed the volume, primary eigenvector/surface angle and thickness of CP+SP during the second trimester of human fetal brain development. Our study demonstrates that DTI provides a unique probe to systematically characterize the neuroanatomy of the developing human brain. Specifically, we have (1) identified the age when the uncinate fasciculus and inferior longitudinal fasciculus become apparent, (2) revealed the volume increase of basal ganglia and ganglionic eminences and observed an inhomogeneous increase in the thickness of the CP+SP, and (3) found that columnar structures become detectable with DTI at ∼13 weeks or earlier. Using 3D reconstruction, we were also able to identify the sequence of sulcal formation and observed the following order: Sylvian fissure, calcarine fissure, central sulcus, and parieto-occipital sulcus.
Much of our anatomical knowledge of human fetal brain development is based on histological analysis, and there are a surprisingly small number of such studies that systematically describe the developmental processes of the human brain. Most of the available atlases are schematics and photographs (O'Rahilly and Muller, 1999). Recently published histological atlases by Bayer and Altman (2004, 2005) are excellent resources. Although MRI-based anatomical studies cannot provide anatomical information as detailed as that provided by histology, MRI excels in characterizing the 3D architecture of the developing brain. The analysis of growing axonal bundles, in particular, is difficult to study with histology-based techniques. The use of MRI-based techniques, together with histology, can enhance our understanding of the dynamics of human brain development (Kostović et al., 2002).
During the second trimester, significant changes were observed in the white matter, most dramatic of which were that the uncinate fasciculus, inferior longitudinal fasciculus, and corpus callosum became apparent. The limbic tracts developed earliest, and were visible in color-encoded maps by 13 gestational weeks. Ren et al. (2006) have reported the formation of the corpus callosum at ∼15 gestational weeks. Among the commissural tracts, the anterior commissure and optic chiasm appear earlier than the corpus callosum (Fig. 2). After the initial appearance of the corpus callosum, it extends in both anterior and posterior directions during the following weeks. At 19 weeks gestation, it undergoes more anterior development (Huang et al., 2006b). Projection fibers can be delineated at 13 weeks, and develop to its peripheral regions during the second trimester. We observed the uncinate fasciculus and inferior longitudinal fasciculus become apparent at 15 gestational weeks, and no association fibers could be identified in the 13 gestational week brain. The visibility of different white matter tracts was restricted by the quality of the samples and the resolution of the images. Most fibers in the cerebrum, with a pronounced appearance, can be revealed with our data set (200–400 μm). However, some fibers, such as superior cerebellar peduncle, can be observed in histological studies (Bayer and Altman, 2005), but not in our DTI images. Therefore, it is possible that some existent fibers were not identified in DTI images.
We examined the development of the cerebral wall macroscopically and found that the laminar pattern in our DTI images was consistent with findings from histological slides and T1-weighted images (Kostović et al., 2002). From 13 to 21 weeks gestation, the laminar structures of the cerebral wall, which consists of multiple layers (Fig. 7f–j), can be observed. The lateral and medial views of the three-dimensional reconstruction of one hemisphere reveal the order of sulcal formation. Although large sulci have formed by the end of the second trimester, the brain surface is still smooth, and most of the folding of the cerebral cortex takes place later in fetal development. The thickening pattern of the CP+SP during the second trimester is similar to that of the mouse from E14 to E18 (Zhang et al., 2003), suggesting that the mechanisms regulating the increase of CP+SP may be evolutionarily conserved.
We also characterized the development of the cerebral wall microscopically by delineating the orientations of microstructures with diffusion tensor primary eigenvector. McKinstry et al. (McKinstry et al., 2002) clearly identified the radial structure in vivo in 26 week fetal brains. They have also found that the radial organization disappears by 36 weeks. Our study revealed that the radial organization begins to appear at 13 weeks and becomes pronounced at 15 weeks. The aDWI images and vector maps (Fig. 7k–o) clearly show that the laminar and radial structures intertwine throughout the second trimester. Previous studies have found that the laminar organization is predominant in the adult cerebral cortex, although it functions with the columnar units along the radial direction (Mountcastle, 1997). Thus, it implies that the radial organization is prominent only from 13 to 36 weeks of gestational age, while the laminar organization may exist throughout brain development.
We reconstructed major subcortical neural structures three dimensionally to demonstrate their morphological changes. Furthermore, we measured the volumes of the neural structures throughout the second trimester. There was almost a constant volume increase for the basal ganglia and the ganglionic eminences. The ganglionic eminences are developmental structures that differentiate during the third trimester into the caudate, the putamen, the globus pallidus, and the basal ganglia. The expansion of these subcortical structures is accompanied by the shrinkage of the ventricle. Global changes of these structures have been reported in this study qualitatively and quantitatively. Compared with histological studies, MRI has the advantage of providing a convenient three-dimensional reconstruction and quantitative assessment of volume and area. These two modalities provide complementary information about the dynamic changes that occur during brain development.
Footnotes
This work was funded by National Institutes of Health Grants EB003543 and AG20012 (S.M.) and NS45841 (L.J.R., S.M.). L.J.R. is supported by a senior research fellowship from the National Health and Medical Research Council. We thank Jeannie Davis for assistance in manuscript editing.
References
- Basser PJ, Mattiello J, LeBihan D. Estimation of the effective self-diffusion tensor from the NMR spin echo. J Magn Reson B. 1994;103:247–254. doi: 10.1006/jmrb.1994.1037. [DOI] [PubMed] [Google Scholar]
- Bayer SA, Altman J. The human brain during the third trimester. Boca Raton, FL: CRC; 2004. [Google Scholar]
- Bayer SA, Altman J. The human brain during the second trimester. Boca Raton, FL: CRC; 2005. [Google Scholar]
- Catani M, Howard RJ, Pajevic S, Jones DK. Virtual in vivo interactive dissection of white matter fasciculi in the human brain. Neuroimage. 2002;17:77–94. doi: 10.1006/nimg.2002.1136. [DOI] [PubMed] [Google Scholar]
- Deipolyi AR, Mukherjee P, Gill K, Henry RG, Partridge SC, Veeraraghavan S, Jin H, Lu Y, Miller SP, Ferriero DM, Vigneron DB, Barkovich AJ. Comparing microstructural and macrostructural development of the cerebral cortex in premature newborns: diffusion tensor imaging versus cortical gyration. Neuroimage. 2005;27:579–586. doi: 10.1016/j.neuroimage.2005.04.027. [DOI] [PubMed] [Google Scholar]
- Hermoye L, Saint-Martin C, Cosnard G, Lee SK, Kim J, Nassogne MC, Menten R, Clapuyt P, Donohue PK, Hua K, Wakana S, Jiang H, van Zijl PC, Mori S. Pediatric diffusion tensor imaging: normal database and observation of the white matter maturation in early childhood. Neuroimage. 2006;29:493–504. doi: 10.1016/j.neuroimage.2005.08.017. [DOI] [PubMed] [Google Scholar]
- Honig LS, Herrmann K, Shatz CJ. Developmental changes revealed by immunohistochemical markers in human cerebral cortex. Cereb Cortex. 1996;6:794–806. doi: 10.1093/cercor/6.6.794. [DOI] [PubMed] [Google Scholar]
- Huang H, Richards L, Xue R, van Zijl PCM, Mori S. Application of DTI in human fetal brain development study. Paper presented at International Society of Magnetic Resonance in Medicine Fifteenth Annual Meeting; May; Seattle. 2006a. [Google Scholar]
- Huang H, Zhang J, Wakana S, Zhang W, Ren T, Richards LJ, Yarowsky P, Donohue P, Graham E, van Zijl PC, Mori S. White and gray matter development in human fetal, newborn and pediatric brains. Neuroimage. 2006b;33:27–38. doi: 10.1016/j.neuroimage.2006.06.009. [DOI] [PubMed] [Google Scholar]
- Hüppi PS, Maier SE, Peled S, Zientara GP, Barnes PD, Jolesz FA, Volpe JJ. Microstructural development of human newborn cerebral white matter assessed in vivo by diffusion tensor magnetic resonance imaging. Pediatr Res. 1998;44:584–590. doi: 10.1203/00006450-199810000-00019. [DOI] [PubMed] [Google Scholar]
- Hüppi PS, Murphy B, Maier SE, Zientara GP, Inder TE, Barnes PD, Kikinis R, Jolesz FA, Volpe JJ. Microstructural brain development after perinatal cerebral white matter injury assessed by diffusion tensor magnetic resonance imaging. Pediatrics. 2001;107:455–460. doi: 10.1542/peds.107.3.455. [DOI] [PubMed] [Google Scholar]
- Jiang H, van Zijl PC, Kim J, Pearlson GD, Mori S. DtiStudio: resource program for diffusion tensor computation and fiber bundle tracking. Comput Methods Programs Biomed. 2006;81:106–116. doi: 10.1016/j.cmpb.2005.08.004. [DOI] [PubMed] [Google Scholar]
- Kinoshita Y, Okudera T, Tsuru E, Yokota A. Volumetric analysis of the germinal matrix and lateral ventricles performed using MR images of postmortem fetuses. AJNR Am J Neuroradiol. 2001;22:382–388. [PMC free article] [PubMed] [Google Scholar]
- Kostović I, Judas M, Rados M, Hrabac P. Laminar organization of the human fetal cerebrum revealed by histochemical markers and magnetic resonance imaging. Cereb Cortex. 2002;12:536–544. doi: 10.1093/cercor/12.5.536. [DOI] [PubMed] [Google Scholar]
- Kroenke CD, Bretthorst GL, Inder TE, Neil JJ. Diffusion MR imaging characteristics of the developing primate brain. Neuroimage. 2005;25:1205–1213. doi: 10.1016/j.neuroimage.2004.12.045. [DOI] [PubMed] [Google Scholar]
- Kroenke CD, Van Essen DC, Inder TE, Rees S, Bretthorst GL, Neil JJ. Microstructural changes of the baboon cerebral cortex during gestational development reflected in magnetic resonance imaging diffusion anisotropy. J Neurosci. 2007;27:12506–12515. doi: 10.1523/JNEUROSCI.3063-07.2007. [DOI] [PMC free article] [PubMed] [Google Scholar]
- Le Bihan D, Breton E, Lallemand D, Grenier P, Cabanis E, Laval-Jeantet M. MR imaging of intravoxel incoherent motions: application to diffusion and perfusion in neurologic disorders. Radiology. 1986;161:401–407. doi: 10.1148/radiology.161.2.3763909. [DOI] [PubMed] [Google Scholar]
- Lee SK, Kim DI, Kim J, Kim DJ, Kim HD, Kim DS, Mori S. Diffusion-tensor MR imaging and fiber tractography: a new method of describing aberrant fiber connections in developmental CNS anomalies. Radiographics. 2005;25:53–65. doi: 10.1148/rg.251045085. discussion 66–68. [DOI] [PubMed] [Google Scholar]
- Maas LC, Mukherjee P, Carballido-Gamio J, Veeraraghavan S, Miller SP, Partridge SC, Henry RG, Barkovich AJ, Vigneron DB. Early laminar organization of the human cerebrum demonstrated with diffusion tensor imaging in extremely premature infants. Neuroimage. 2004;22:1134–1140. doi: 10.1016/j.neuroimage.2004.02.035. [DOI] [PubMed] [Google Scholar]
- Makris N, Worth AJ, Sorensen AG, Papadimitriou GM, Wu O, Reese TG, Wedeen VJ, Davis TL, Stakes JW, Caviness VS, Kaplan E, Rosen BR, Pandya DN, Kennedy DN. Morphometry of in vivo human white matter association pathways with diffusion weighted magnetic resonance imaging. Ann Neurol. 1997;42:951–962. doi: 10.1002/ana.410420617. [DOI] [PubMed] [Google Scholar]
- McKinstry RC, Mathur A, Miller JH, Ozcan A, Snyder AZ, Schefft GL, Almli CR, Shiran SI, Conturo TE, Neil JJ. Radial organization of developing preterm human cerebral cortex revealed by non-invasive water diffusion anisotropy MRI. Cereb Cortex. 2002;12:1237–1243. doi: 10.1093/cercor/12.12.1237. [DOI] [PubMed] [Google Scholar]
- Miller MI, Trouve A, Younes L. On the metrics and Euler-Lagrange equations of computational anatomy. Annu Rev Biomed Eng. 2002a;4:375–405. doi: 10.1146/annurev.bioeng.4.092101.125733. [DOI] [PubMed] [Google Scholar]
- Miller SP, Vigneron DB, Henry RG, Bohland MA, Ceppi-Cozzio C, Hoffman C, Newton N, Partridge JC, Ferriero DM, Barkovich AJ. Serial quantitative diffusion tensor MRI of the premature brain: development in newborns with and without injury. J Magn Reson Imaging. 2002b;16:621–632. doi: 10.1002/jmri.10205. [DOI] [PubMed] [Google Scholar]
- Mori S, Crain BJ, Chacko VP, van Zijl PCM. Three dimensional tracking of axonal projections in the brain by magnetic resonance imaging. Ann Neurol. 1999;45:265–269. doi: 10.1002/1531-8249(199902)45:2<265::aid-ana21>3.0.co;2-3. [DOI] [PubMed] [Google Scholar]
- Mori S, Wakana S, Nagae-Poetscher LM, van Zijl PC. MRI atlas of human white matter. Amsterdam: Elsevier; 2005. [DOI] [PubMed] [Google Scholar]
- Moseley ME, Cohen Y, Kucharczyk J, Mintorovitch J, Asgari HS, Wendland MF, Tsuruda J, Norman D. Diffusion-weighted MR imaging of anisotropic water diffusion in cat central nervous system. Radiology. 1990;176:439–445. doi: 10.1148/radiology.176.2.2367658. [DOI] [PubMed] [Google Scholar]
- Mountcastle VB. The columnar organization of the neocortex. Brain. 1997;120:701–722. doi: 10.1093/brain/120.4.701. [DOI] [PubMed] [Google Scholar]
- Mukherjee P, Miller JH, Shimony JS, Philip JV, Nehra D, Snyder AZ, Conturo TE, Neil JJ, McKinstry RC. Diffusion-tensor MR imaging of gray and white matter development during normal human brain maturation. AJNR Am J Neuroradiol. 2002;23:1445–1456. [PMC free article] [PubMed] [Google Scholar]
- Neil J, Miller J, Mukherjee P, Hüppi PS. Diffusion tensor imaging of normal and injured developing human brain-a technical review. NMR Biomed. 2002;15:543–552. doi: 10.1002/nbm.784. [DOI] [PubMed] [Google Scholar]
- Neil JJ, Shiran SI, McKinstry RC, Schefft GL, Snyder AZ, Almli CR, Akbudak E, Aronovitz JA, Miller JP, Lee BC, Conturo TE. Normal brain in human newborns: apparent diffusion coefficient and diffusion anisotropy measured by using diffusion tensor MR imaging. Radiology. 1998;209:57–66. doi: 10.1148/radiology.209.1.9769812. [DOI] [PubMed] [Google Scholar]
- O'Rahilly RR, Muller F. The embryonic human brain: an atlas of developmental stages. New York: Wiley; 1999. [Google Scholar]
- Partridge SC, Mukherjee P, Henry RG, Miller SP, Berman JI, Jin H, Lu Y, Glenn OA, Ferriero DM, Barkovich AJ, Vigneron DB. Diffusion tensor imaging: serial quantitation of white matter tract maturity in premature newborns. Neuroimage. 2004;22:1302–1314. doi: 10.1016/j.neuroimage.2004.02.038. [DOI] [PubMed] [Google Scholar]
- Pierpaoli C, Basser PJ. Toward a quantitative assessment of diffusion anisotropy. Magn Reson Med. 1996;36:893–906. doi: 10.1002/mrm.1910360612. [DOI] [PubMed] [Google Scholar]
- Rados M, Judas M, Kostović I. In vitro MRI of brain development. Eur J Radiol. 2006;57:187–198. doi: 10.1016/j.ejrad.2005.11.019. [DOI] [PubMed] [Google Scholar]
- Rakic P. Mode of cell migration to the superficial layers of fetal monkey neocortex. J Comp Neurol. 1972;145:61–83. doi: 10.1002/cne.901450105. [DOI] [PubMed] [Google Scholar]
- Rakic P. Specification of cerebral cortical areas. Science. 1988;241:170–176. doi: 10.1126/science.3291116. [DOI] [PubMed] [Google Scholar]
- Ren T, Anderson A, Shen WB, Huang H, Plachez C, Zhang J, Mori S, Kinsman SL, Richards LJ. Imaging, anatomical, and molecular analysis of callosal formation in the developing human fetal brain. Anat Rec A Discov Mol Cell Evol Biol. 2006;288:191–204. doi: 10.1002/ar.a.20282. [DOI] [PubMed] [Google Scholar]
- Schneider JF, Il'yasov KA, Hennig J, Martin E. Fast quantitative diffusion-tensor imaging of cerebral white matter from the neonatal period to adolescence. Neuroradiology. 2004;46:258–266. doi: 10.1007/s00234-003-1154-2. [DOI] [PubMed] [Google Scholar]
- Sidman RL, Rakic P. Neuronal migration, with special reference to developing human brain: a review. Brain Res. 1973;62:1–35. doi: 10.1016/0006-8993(73)90617-3. [DOI] [PubMed] [Google Scholar]
- Sidman RL, Rakic P. Development of the human central nervous system. In: Haymaker W, Adams RD, editors. Histology and histopathology of the nervous system. Springfield, IL: C. C. Thomas; 1982. pp. 3–145. [Google Scholar]
- Stieltjes B, Kaufmann WE, van Zijl PCM, Fredericksen K, Pearlson GD, Solaiyappan M, Mori S. Diffusion tensor imaging and axonal tracking in the human brainstem. Neuroimage. 2001;14:723–735. doi: 10.1006/nimg.2001.0861. [DOI] [PubMed] [Google Scholar]
- Volpe JJ. Neurobiology of periventricular leukomalacia in the premature infant. Pediatr Res. 2001;50:553–562. doi: 10.1203/00006450-200111000-00003. [DOI] [PubMed] [Google Scholar]
- Wakana S, Jiang H, Nagae-Poetscher LM, van Zijl PC, Mori S. Fiber tract-based atlas of human white matter anatomy. Radiology. 2004;230:77–87. doi: 10.1148/radiol.2301021640. [DOI] [PubMed] [Google Scholar]
- Wakana S, Caprihan A, Panzenboeck MM, Fallon JH, Perry M, Gollub RL, Hua K, Zhang J, Jiang H, Dubey P, Blitz A, van Zijl PCM, Mori S. Reproducibility of quantitative tractography methods applied to cerebral white matter. Neuroimage. 2007;36:630–644. doi: 10.1016/j.neuroimage.2007.02.049. [DOI] [PMC free article] [PubMed] [Google Scholar]
- Woods RP, Grafton ST, Holmes CJ, Cherry SR, Mazziotta JC. Automated image registration: I. General methods and intrasubject, intramodality validation. J Comput Assist Tomogr. 1998;22:139–152. doi: 10.1097/00004728-199801000-00027. [DOI] [PubMed] [Google Scholar]
- Zhang J, Richards LJ, Yarowsky P, Huang H, van Zijl PC, Mori S. Three-dimensional anatomical characterization of the developing mouse brain by diffusion tensor microimaging. Neuroimage. 2003;20:1639–1648. doi: 10.1016/s1053-8119(03)00410-5. [DOI] [PubMed] [Google Scholar]
- Zhang J, Evans A, Hermoye L, Lee SK, Wakana S, Zhang W, Donohue P, Miller MI, Huang H, Wang X, van Zijl PCM, Mori S. Evidence of slow maturation of the superior longitudinal fasciculus in early childhood by diffusion tensor imaging. Neuroimage. 2007;38:239–247. doi: 10.1016/j.neuroimage.2007.07.033. [DOI] [PMC free article] [PubMed] [Google Scholar]


