Abstract
The adsorption of recombinant botulinum neurotoxin (BoNT) protein-derived vaccine antigens to aluminum salt adjuvants has been previously studied for the development of a trivalent vaccine against the neurotoxins1. The current paper describes an investigation of the stability of recombinant BoNT antigens adsorbed to aluminum salt adjuvants during storage in aqueous solution. Both chemical and physical changes occurred during storage. Phosphate groups in the buffer exchanged with hydroxyl groups on the adjuvant surface. The resulting changes in solution pH and adjuvant surface chemistry promoted more favorable electrostatic interaction between the BoNT proteins and the surface, possibly increasing the affinity of the proteins for the surface during storage. Fluorescence and UV spectroscopy suggested changes to protein structure during storage, whereas differential scanning calorimetry showed changes to thermal processes related to protein conformation and/or surface adsorption. The consequence of the chemical and physical changes to the proteins was a decrease in the ability to desorb protein from the adjuvant surface during storage. Overall, the results of this study emphasize the utility of a thorough characterization of the interactions between protein antigens and aluminum salt adjuvants.
Keywords: Botulinum neurotoxin, recombinant vaccine, trivalent vaccine, stability, aluminum salt adjuvant, competitive adsorption
Introduction
Botulinum neurotoxin (BoNT) is the most deadly known toxin2, with lethal doses as low as 0.05 to 0.1 μg in humans3. There are seven known serotypes of BoNT (BoNT/A – BoNT/G) produced by commonly isolated strains of Clostridium botulinum and other Clostridium bacterial species, that exist as structurally similar variants4. The serotypes differ with respect to nerve cell targets (e.g. BoNT/A and E target SNAP25, BoNT/B, D, F and G target Vesicle Associated Membrane Protein, BoNT/C targets syntaxin) resulting in variation of the severity or duration of symptoms following exposure to BoNT5. The development of botulinum neurotoxin as a biological warfare agent began in Japan as early as the 1930’s, prompting the initial attempts toward vaccine development in the United States during World War II6. Between 1985 and 1991, Iraq is reported to have produced 19,000L of concentrated neurotoxin formulated for delivery via inhalation as a part of their biological warfare arsenal7,8.
The neurotoxin proteins are composed of a 50 kDa light chain joined by a disulfide bond to a 100 kDa heavy chain. The light chain is the catalytic domain encoding a zinc-dependent endopeptidase. The heavy chain is responsible for binding of the neurotoxin to the nerve cell membrane, which promotes the internalization of the toxin into the cell. Recombinant protein antigens based on the 50 kDa C-terminal domain of the heavy chain of the BoNT (C-fragment or Hc domain; rBoNT(Hc) have been developed as vaccine candidates to provide protection against exposure to BoNTs. These antigens were developed by The United States Army Medical Research Institute of Infectious Diseases (USAMRIID). They have been derived from the C-terminal domain of the heavy chain and comprise a protein with a molecular weight of approximately 50Kda9.
Vaccines based on recombinant protein antigens generally require an adjuvant to achieve protection from the associated disease or toxin10–12. Aluminum salts are the most prevalent adjuvants in vaccines approved for human use by the U.S. Food and Drug Administration13,14. The protein antigens investigated in this study have previously been shown to adsorb to the hydrophilic surfaces of aluminum salt adjuvants1. The point of zero charge (PZC) of the adjuvant is the point at which the net surface charge is zero; the PZC for aluminum oxyhydroxide is approximately 11 whereas the PZC for aluminum phosphate is approximately 4–5.5. Protein adsorption to the adjuvant surfaces is generally maximized when the sign of the net charge of the protein is opposite that of the adjuvant surface, allowing for an electrostatic attraction. The BoNT proteins included in this study have isoelectric points (PI) in the range of 7–9, and are formulated at pH 4 to maximize stability. Normally aluminum phosphate adjuvant would be the best choice as an adjuvant for these conditions. However, samples of rBoNTB(Hc) prepared with this adjuvant in preliminary studies conferred much greater protection against the neurotoxin in a mouse model than samples prepared with aluminum phosphate (unpublished observation). Therefore the vaccine formulation for this study included aluminum oxyhydroxide as the adjuvant, with adsorption buffers containing phosphate ions added in order to improve adsorption to the surface.
It is generally accepted that antigens should be adsorbed to the adjuvant in order to provoke a suitable immune response15,16. However, protein conformation can change when proteins bind to liquid-solid interfaces17–22. It is therefore important to monitor changes to protein structure following adsorption to an adjuvant. Furthermore, conformational changes induced by binding to adjuvant could alter protein stability during long-term storage. For example, if adsorption is essentially complete, aggregation via pathways that occur in bulk solution are not likely to occur. Conversely, unfolding upon binding may expose normally buried residues to solvent, promoting degradation processes such as oxidation.
This study investigates the effect of adjuvant binding on the long-term stability of a trivalent vaccine against the three serotypes most often found to be the causative agent for botulism in humans10: BoNT/A, BoNT/B and BoNT/E. A monovalent vaccine against BoNT/E was also investigated through the course of this work. Changes to adjuvant-bound protein were compared to those of liquid control samples of unbound protein held under identical storage conditions. This work provides an assessment of changes to the structure and the stability of the adsorbed protein during long-term storage. Product stability was monitored from three perspectives; binding of protein to adjuvant, chemical stability of the adjuvant, and protein conformational stability. Techniques utilized for the characterization of protein binding to adjuvant included UV spectroscopy and capillary electrophoresis (Bioanalyzer®). Chemical stability of the adjuvant was determined through zeta potential analysis of the adjuvant in the absence of protein and Inductively Coupled Plasma Optical Emission Spectroscopy (ICP-OES) analysis of the phosphate and aluminum concentrations in solution. Chemical stability of the adsorbed protein has also been investigated by peptide mapping mass spectrometry, as discussed by Estey et al23. Second derivative UV spectroscopy, fluorescence spectroscopy and differential scanning calorimetry were utilized for the analysis of protein conformational stability.
Previous work has indicated that adsorption profiles for mixtures of rBoNT(Hc) protein antigens to aluminum oxyhydroxide adjuvant differ from those obtained for the individual antigens1. Changes in binding stability of the adjuvant-bound trivalent vaccine formulation rBoNTABE(Hc) formulations were monitored as a function of time, and compared with control samples of unbound proteins held at identical storage conditions.
Materials and Methods
Materials
Alhydrogel™ 2.0% (aluminum oxyhydroxide adjuvant, AlOOH), made by Brenntag Biosector, was purchased through E.M. Sergeant Pulp & Chemical Co, Inc (Clifton, NJ). Succinic acid, sodium phosphate monobasic, and sodium phosphate dibasic were all purchased from Sigma Chemical Company (St. Louis, MO). Trehalose (high purity, low endotoxin) was purchased from Ferro Pfanstiel (Cleveland, OH), and Polysorbate (Tween) 20 (low carbonyl and peroxides) was purchased from Pierce (Rockford, IL). Protein 200 Plus LabChip® kits were purchased from Agilent Technologies (Palo Alto, CA). rBoNTA(Hc) and rBoNTB(Hc) were provided by Cambrex Biosciences Hopkinton Inc. (MA) (now Lonza Hopkinton Inc,) and rBoNTE(Hc) was provided by the Biological Process Development Facility at the University of Nebraska, Lincoln.
Preparation of Samples for Storage Stability Experiments
Samples were prepared by dialyzing rBoNTA(Hc) (~0.8 mg/mL) and rBoNTB(Hc) (~0.8 mg/mL) into 15 mM sodium succinate, pH 4. The rBoNTE(Hc) stock was obtained from the supplier in 15 mM sodium succinate, pH 4 at a concentration of ~0.2 mg/mL and concentrated to ~0.46 mg/mL using an Amicon stirred cell concentration device. Buffers, excipient solutions, and protein solutions were sterile filtered in a laminar flow hood under aseptic conditions prior to mixing. For the trivalent rBoNTABE(Hc) study, the proteins were mixed together prior to sterile filtration to achieve approximately equal concentrations of each protein. The Alhydrogel™ was received as a sterile solution, and the material was handled using aseptic technique prior to and during sample preparation.
Excipient solutions were added to protein solutions (rBoNTABE(Hc) or rBoNTE(Hc) only), and mixed gently to create bulk solutions. These bulk solutions were each split into three portions, one for control samples, one for adjuvant–bound samples, and a third for time-zero (t=0) samples. Adjuvant was added as a suspension to the proteins to create the adjuvant-bound samples. A volume of water equivalent to the adjuvant suspension volume was added to the control samples (samples of rBoNT(Hc) in 10 mM sodium succinate 15 mM sodium phosphate) in place of the adjuvant suspension. For the t=0 adjuvant containing samples, sample solution was aliquotted prior to the addition of adjuvant, and adjuvant was added immediately before analysis.
The final protein concentration for each sample was approximately 0.1 mg/mL of each protein. The final adjuvant concentration for adjuvant-bound samples was 0.2% (w/v) Alhydrogel™. The final formulations (Table 1) included sodium succinate buffers to maintain solution pH and sodium phosphate buffers to improve adsorption to the Alhydrogel™. The rBoNT(Hc) proteins are susceptible to aggregation in solution. One common strategy for decreasing aggregation potential for proteins in solution involves the addition of stabilizing sugars (trehalose, sucrose) to promote a more native protein conformation. Surfactants are also utilized to prevent protein denaturation that can lead to aggregation by competing for adsorption sites at air-liquid and solid-liquid interfaces. In order to determine the effect of these substances on adsorption and antigen stability, some formulations included trehalose and surfactant (polysorbate 20).
Table 1.
Protein formulations included in long-term stability studies. All formulations were prepared at pH 4 and with a final adjuvant concentration of 0.2% (w/v) Alhydrogel™.
| # | rBoNT(Hc) protein | Succinate Buffer
(mM) |
Phosphate Buffer
(mM) |
Trehalose
(% w/v) |
Polysorbate
20 (% w/v) |
||
|---|---|---|---|---|---|---|---|
| A
(mg/mL) |
B
(mg/mL) |
E
(mg/mL) |
|||||
| 1 | 0.1 | 10 | 10 | ||||
| 2 | 0.1 | 10 | 10 | 7.5 | |||
| 3 | 0.1 | 10 | 10 | 7.5 | 0.01 | ||
| 4 | 0.1 | 0.1 | 0.1 | 25 | 15 | ||
| 5 | 0.1 | 0.1 | 0.1 | 25 | 15 | 7.5 | |
| 6 | 0.1 | 0.1 | 0.1 | 25 | 15 | 7.5 | 0.01 |
A total of 30 samples for each adjuvant-containing formulation and control formulation were aseptically pipetted into sterile 15 mL centrifuge tubes. Fifteen of the samples were stored at 4°C and the other fifteen at 30°C. Three samples at each temperature and for each formulation were available for triplicate analysis following storage for two, four, nine, and eighteen weeks. Three replicate samples for each control and adjuvant containing formulation were aseptically aliquotted for testing at t=0.
Binding of Proteins to Adjuvant
Samples containing adjuvant-bound protein were centrifuged for 5 minutes at 2300 × g to pellet the adjuvant. The concentration of protein in supernatants was determined by UV spectroscopy (A280). Extinction coefficients (A280) were determined from the primary sequences of the proteins using the ProtParam program on the Expasy website (http://us.expasy.org). The estimated extinction coefficients were 1.723 g/L, 1.929 g/L, and 1.587 g/L for rBoNTA(Hc), rBoNTB(Hc) and rBoNTE(Hc) respectively. The mass of bound protein was determined as the difference between total mass of protein in the sample and the mass in the supernatant. The UV absorbance data were collected in a 1 cm path length quartz cell on a Hewlett Packard 8453 diode array spectrophotometer with a 25 second integration time (1 nm bandwidth).
Ratios of Species Bound
Concentrations of the individual proteins in the sample supernatants were determined using an Agilent 2100 Bioanalyzer (Agilent Technologies, Palo Alto, CA, USA) and a Protein 200 Plus LabChip® Kit (Agilent Technologies, Palo Alto, CA, USA). All reagents and samples were prepared and analyzed under non-reducing conditions as described in the Protein 200 Plus LabChip® Kit manual (Agilent Technologies publication number G2938–90050). The samples were not heated as suggested in the kit manual prior to analysis since the heating of the rBoNTE(Hc) standards at 80°C resulted in greatly diminished Bioanalyzer signals. Standard curves were prepared using mixed protein standards to quantitate the concentrations of each rBoNT(Hc) protein in solution.
Desorption of Proteins from Adjuvant
Proteins were desorbed from adjuvant by incubating a mixture (1 mL) containing Alhydrogel™ to which protein was bound with an equal volume (1 mL) of 250 mM succinate, pH = 3.5 for 30 minutes at ambient temperature (approximately 25°C). This desorption solution was shown in preliminary studies to promote approximately 100% desorption of the proteins following incubation of protein with adjuvant for a minimum of 30 minutes with no apparent changes to protein conformation as determined by far UV CD spectroscopy, second derivative UV spectroscopy, capillary electrophoresis (Bioanalyzer) analysis, and fluorescence spectroscopy (data not shown). The addition of the desorption solution results in a solution at a pH at which both the protein and adjuvant surface have a net negative charge, decreasing the attractive electrostatic interaction between the two. The high salt concentration serves to further screen attractive electrostatic interactions.
Following incubation, samples were centrifuged for 5 minutes at 2300 × g. Supernatants were analyzed by UV spectroscopy as described above to determine protein concentrations. The UV absorbance spectra of each sample also were acquired to evaluate tertiary structure of the desorbed proteins. Supernatants were analyzed by capillary electrophoresis, following the methods as described above, to determine the concentrations of each protein.
Physicochemical properties of Formulations
pH
The pH of the adjuvant containing formulations and control samples was measured using a micro pH probe attached to a Thermo Orion Model 420 pH meter at ambient temperature (approximately 25°C).
Osmolality, Aluminum and Phosphate Determination
Samples (1.1 mL) of the adjuvant-bound protein mixtures were centrifuged for 5 minutes at 2300 × g. Control samples were also centrifuged for 5 minutes at 2300 × g. Aliquots (10 μL) of the supernatants were analyzed on a Wescor 5500 Vapor Pressure Osmometer (Logan, UT). The remaining supernatant was sent to Dr. John Drexler in the Department of Geological Sciences at the University of Colorado for ICP-OES analysis to determine aluminum and phosphorus concentrations. Measurements were performed using a Thermo ICP-OES ARL 3410+ spectrometer (Waltham, MA).
Protein Structure
Differential Scanning Calorimetry
Analysis of protein thermal transitions was performed on a MicroCal (Northampton, MA) VP-DSC differential scanning calorimeter. Thermograms were obtained from 10 to 90°C with a scan heating rate of 90°C/hour and a pre-scan equilibration time of 15 minutes. For control samples, the blank in the reference cell was the buffer without protein. Samples containing adjuvant-bound protein were gently centrifuged (less than 450 × g, 5 seconds) prior to analysis, and half of the total volume was removed as supernatant in order to effectively double the final concentration of adjuvant and protein analyzed in the instrument. The reference cell included both buffer and Alhydrogel™ at the same buffer:adjuvant ratios as found in adjuvant-protein samples in order to measure transitions specific to the proteins. DSC data were analyzed using Origin version 7.0 software (Origin-Lab Corporation, Northampton, MA). The thermograms were analyzed by fitting the data to a two-state model using three peaks.
Front Face Fluorescence Spectroscopy of Protein Bound to Adjuvant
Front-face fluorescence spectroscopic analyses were performed using a QuantaMaster™ Model QM-4/2005 fluorimeter made by Photon Technology International (Lawrenceville, NJ). A Starna® (Atascadero, CA) triangular fluorimeter cell was used for each analysis. Scans were performed using an excitation wavelength of 280nm, with an emission scan range of 295 to 400nm. Data were collected every 1 nm at a scanning rate of 1 nm/s. The samples were equilibrated at 10°C and the first scan taken. Subsequent scans were obtained after increasing the cell temperature in 2.5°C increments up to a final temperature of 80°C, with a five-minute equilibration time at each temperature prior to each scan.
Second Derivative UV Spectroscopy of rBoNT(Hc) Proteins in Solution
In order to monitor tertiary structure of the rBoNT(Hc) proteins, UV absorbance scans were taken from 200 to 500 nm for each sample after desorption from the adjuvant. The data set obtained from the UV scans was truncated from 240 to 350 nm. Through a Savitzky-Golay algorithm, the spectra were converted to second derivative at 3 degrees and 5 points. The new data sets were then interpolated at 32× in the region 242 to 348 nm. The derivative data were analyzed to monitor the positions for tryptophan and tyrosine/tryptophan peaks. The conformational information was evaluated by calculating the peak-to-trough values near 284 nm (a), near 292 nm (b), and near 258 nm (c), which reflect the micro-environments of tyrosine, tryptophan, and phenylalanine, respectively24. The relative exposure of the side chains to the solvent in the native protein can be expressed from the ratio of “(a)” to “(b)” (a/b ratio) or the ratio of “(a)” to “(c)” (a/c ratio)24. Both parameters reflect similar changes in the conformation of the protein in solution.
Results
Initial Binding of Protein to Adjuvant
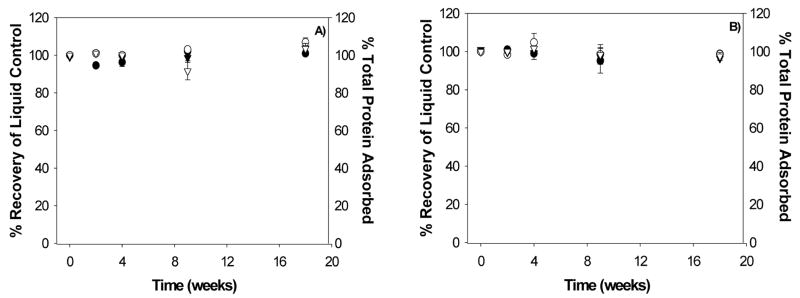
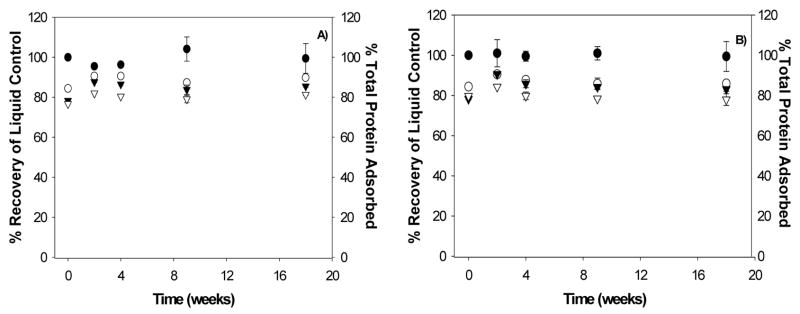
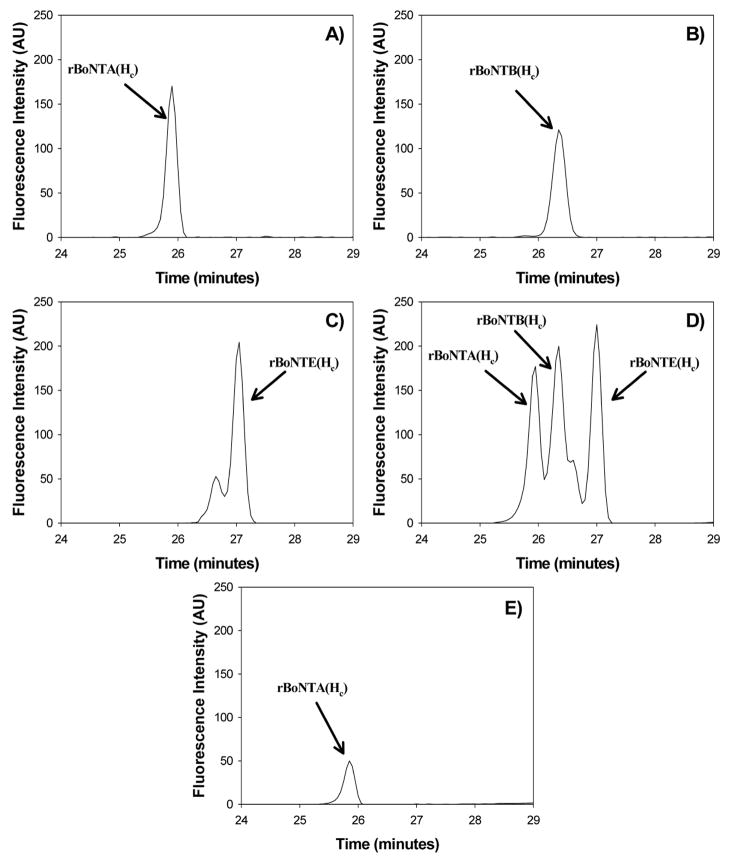
Approximately 100% of the monovalent rBoNTE(Hc) protein was adsorbed to adjuvant at the initiation of the study (t=0) based on UV absorbance data (A280) (Figure 1). In contrast, only about 80% of total protein in the trivalent rBoNTABE(Hc) samples was adsorbed to adjuvant at t=0 (Figure 2) based on UV absorbance data (A280). Since UV absorbance is not specific to the individual antigens and adequate separation of the antigens in a mixed solution could not be achieved using reversed-phase or size-exclusion HPLC (data not shown), capillary electrophoresis (Agilent 2100 Bioanalyzer®) was used for the quantification of the individual antigens present in solution. Liquid samples of rBoNTA(Hc), rBoNTB(Hc), and rBoNTE(Hc) were analyzed and the resulting electroferograms compared to that of a mixed solution containing the same concentrations of all three proteins (Figure 3) to determine the retention time and separation of each antigen by this technique.
Figure 1.
Total protein adsorbed to Alhydrogel™ (determined as total mass of protein in adsorption supernatants divided by the total mass added to samples) or % recovery of protein for control samples, determined by A280 measurements, in the rBoNTE(Hc) formulations as a function of storage time for samples stored at A) 4°C and B) 30°C. Data is shown for ●) controls and adjuvant containing samples formulated in ○) buffer, ▼) buffer + trehalose, and ▽) buffer + trehalose + Polysorbate 20. Each data point represents the average adsorption across the three replicate samples. Error bars represent the standard deviation of the replicate samples.
Figure 2.
Total protein adsorbed to Alhydrogel™ (determined as total mass of protein in adsorption supernatants divided by the total mass added to samples) or % recovery of protein for control samples, determined by A280 measurements, in the rBoNTABE(Hc) sample formulations as a function of time for samples stored at A) 4°C and B) 30°C. Data is shown for ●) controls and for adjuvant containing samples formulated in ○) buffer, ▼) buffer + trehalose, and ▽) buffer + trehalose + Polysorbate 20. Each data point represents the average adsorption across the three replicate samples. Error bars represent the standard deviation of the replicate samples.
Figure 3.
Sample capillary electrophoresis interferograms of standards used for concentration determination of protein in solution, and of protein remaining in solution following adsorption to Alhydrogel ™. A) a rBoNTA(Hc) protein standard, B) a rBoNTB(Hc) protein standard, C) a rBoNTE(Hc) protein standard, D) a rBoNTABE(Hc) protein standard, and E) a representative adsorption supernatant (supernatant from a sample of rBoNTABE(Hc) adsorbed to Alhydrogel™ from solution containing buffer in the absence of sugar or surfactant for 30 minutes, then centrifuged for 5 minutes at 2300 × g). rBoNTA(Hc) and rBoNTB(Hc) were at concentrations of ~ 0.05 mg/mL in the standards, while rBoNTE(Hc) was at a concentration of approximately 0.1 mg/mL.
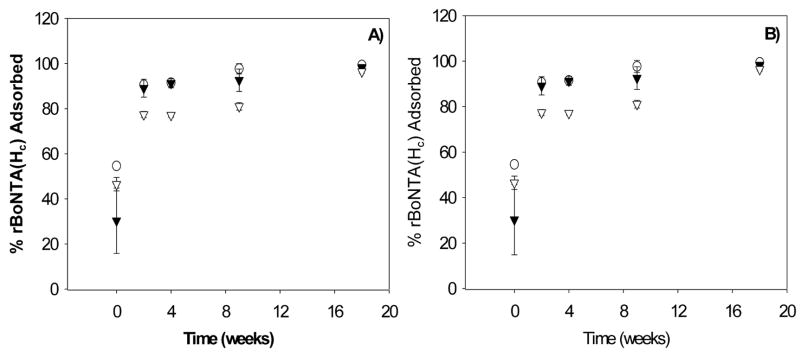
The capillary electrophoresis results for supernatants collected following centrifugation of the trivalent protein-adjuvant mixtures showed only a single protein peak and the retention time identified this peak as rBoNTA(Hc) (Figure 3E). For adjuvant formulations containing protein and buffer with no other excipients, only about 55% of the rBoNTA(Hc) was adsorbed to the adjuvant at t=0 (protein adsorbed to adjuvant for 30 minutes, then centrifuged for 5 minutes at 2300 × g and the supernatants analyzed immediately) as illustrated in Figure 4. Since rBoNTA(Hc), rBoNTB(Hc) and rBoNTE(Hc) were added in equal concentrations to the Alhydrogel™, the mass of free rBoNTA(Hc) accounts completely for the total unadsorbed protein as determined by UV spectroscopy (A280).
Figure 4.
Adsorption of rBoNTA(Hc) to Alhydrogel™ (determined as total mass of protein in adsorption supernatants divided by the total mass added to samples) as a function of storage time as determined by capillary electrophoresis. Data shown is for samples stored at A) 4°C and B) 30°C for adjuvant containing formulations of ○) buffer, ▼) buffer + trehalose, and ▽)buffer + trehalose + Polysorbate 20. Each data point represents the average adsorption across the three replicate samples. Error bars represent the standard deviation of the replicate samples.
Variability in protein adsorption was observed between the different formulations as determined by capillary electrophoresis (Figure 4). The control formulation showed the greatest percent adsorbed, whereas formulations containing trehalose and polysorbate 20 exhibited lower adsorption. The capillary electrophoresis data revealed that only the rBoNTA(Hc) adsorption was significantly decreased by the presence of these excipients in the rBoNTABE(Hc) samples.
Effect of Duration of Storage on the Amount of Protein Adsorbed to Adjuvant
In the monovalent BoNT/E vaccine samples, the amount of rBoNTE(Hc) adsorbed to adjuvant remained constant from study initiation (t=0) to study termination (t=18 wk) for all formulations. In contrast, significant increases in total protein adsorption were observed for all formulations of rBoNTABE(Hc) between the study initiation and two weeks of storage at 4 °C or 30°C (Figure 2). Specifically, there was a substantial increase in the mass of rBoNTA(Hc) adsorbed following two weeks of storage compared to that adsorbed at t=0, which accounts for the increase in total protein adsorption as determined by capillary electrophoresis (Figure 4). There were no significant changes in the adsorption of rBoNTB(Hc) or rBoNTE(Hc) during this time.
Desorption Studies
Prior to the initiation of the storage stability studies, a number of solutions and conditions were tested for their ability to desorb the rBoNT(Hc) proteins from the Alhydrogel™. These desorption conditions included solutions at varied pH and ionic strength, as well as surfactant-containing solutions as detailed in Table 2. Adjuvant-bound protein was incubated in each desorption solution for 30 minutes at ambient temperature (approximately 25°C). The adjuvant was then separated from the solution by centrifugation for 5 minutes at 2300 × g. The preliminary desorption solution screening studies were performed on rBoNTB(Hc), since it showed the greatest affinity to Alhydrogel™ in previous studies1. The solutions which resulted in some detectable desorption were further analyzed in the presence of rBoNTA(Hc), rBoNTB(Hc), and rBoNTE(Hc) to confirm desorption and to evaluate secondary structure. To assess changes to protein secondary and tertiary structure upon desorption, the protein in the supernatant solution was analyzed by second derivative UV spectroscopy, circular dichroism spectroscopy and fluorescence spectroscopy. The solution which was chosen for desorption in the storage stability experiments was 250 mM succinate, pH 3.5, which gave complete desorption of the protein with no apparent changes in protein secondary or tertiary structure. Desorption solutions containing surfactant did not show significant desorption of the proteins compared to desorption solutions with high salt content. Additionally, high concentrations of surfactant appeared to result in changes to protein structure based on spectroscopic measurements (data not shown).
Table 2.
Desorption Conditions studied and results
| Solution | % rBoNT A Desorbed | % rBoNT B Desorbed | % rBoNT E Desorbed | Tertiary Structural Analysis | ||
|---|---|---|---|---|---|---|
| 2DUV | Fluorescence | CD | ||||
| 2% NaCl, pH 6.5 | ND | |||||
| 100 mM Phosphate, pH 4 | ND | |||||
| 100 mM Succinate, pH 4 | 1.4% | NC | NC | NC | ||
| 5 mM Succinate pH 4 + 1% Tween 20 | 3.8% | Slight peak shifts | Decrease in peak intensity | NC | ||
| 500 mM Succinate pH 4.0 | 103.2% | 24.1% | 101.9% | NC | Decrease in peak intensity | NC |
| 500 mM Succinate pH 3.5 | 102.0% | 105.1% | 103.3% | NC | Decrease in peak intensity | NC |
| 250 mM Succinate pH 3.5 | 103.5% | 104.2% | 104.1% | NC | NC | NC |
ND indicates no protein was detected in solution following desorption
NC indicates no changes to protein spectra in the presence of this solution compared to the standard
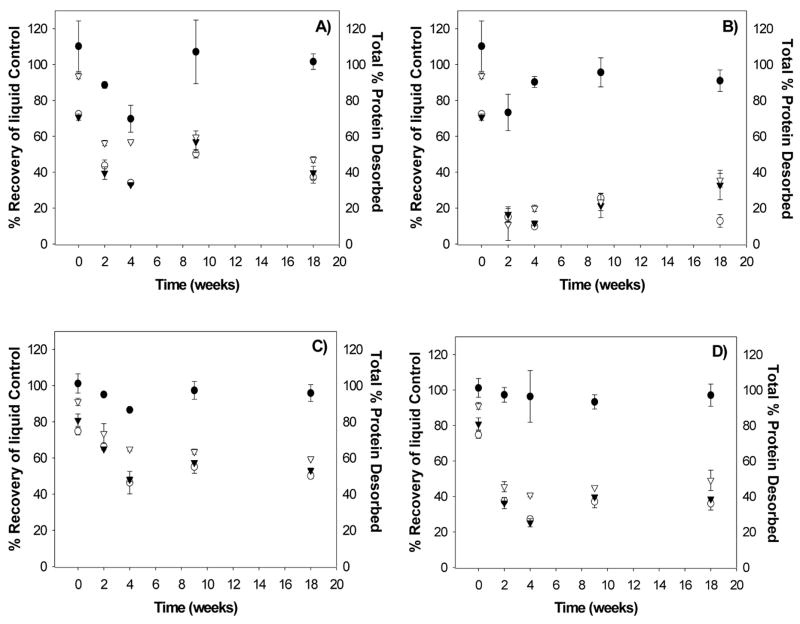
Adjuvant-bound protein samples were tested for antigen desorption at each time point during the storage stability study. The desorption of rBoNTE(Hc) from adjuvant decreased during storage for all three formulations (Figure 5). The largest decrease in total protein desorption occurred between the initiation of the study and the two week time point. Similar trends were observed for samples stored at 4°C and 30°C, although the magnitude of loss of desorption was greater for the samples stored at the higher temperature. Analysis of the rBoNTABE(Hc) samples indicated a decreased ability to desorb each of the three rBoNT(Hc) antigens from the trivalent antigen-adjuvant complex during storage (Figure 6). At the initiation of the study, approximately 100% desorption was achieved for rBoNTA(Hc). Approximately 80% of rBoNTB(Hc) was desorbed at the study initiation, while 85–95% of rBoNTE(Hc) was desorbed. The desorption of the antigens decreased with storage at 4°C, with only about 85% rBoNTA(Hc), 45% rBoNTB(Hc) and 55% rBoNTE(Hc) desorbable by the 2-week time point. Samples stored at 30°C showed 80% desorption of rBoNTA(Hc) and less than 20% desorption of rBoNTB(Hc) and rBoNTE(Hc) within two weeks. There were further decreases in protein desorption at the later time points.
Figure 5.
Total protein desorption from Alhydrogel™ (determined as total mass of protein in desorption supernatants divided by the total mass added to samples) or % recovery of protein for control samples for the A) adjuvant-bound rBoNTE(Hc), 4°C storage, B) adjuvant-bound rBoNTE(Hc), 30°C storage, C) adjuvant-bound rBoNTABE(Hc), 4°C storage, D) adjuvant-bound rBoNTABE(Hc), 30°C storage as determined by Abs280. Data for the control indicates the percent recovery of protein at each time point. Data points are given for ●) controls (measured as % protein recovered in liquid samples following storage) and for adjuvant containing formulations of ○) buffer, ▼) buffer + trehalose, and ▽) buffer + trehalose + Polysorbate 20. Each data point represents the average desorption across the three replicate samples. Error bars represent the standard deviation of the replicate samples.
Figure 6.
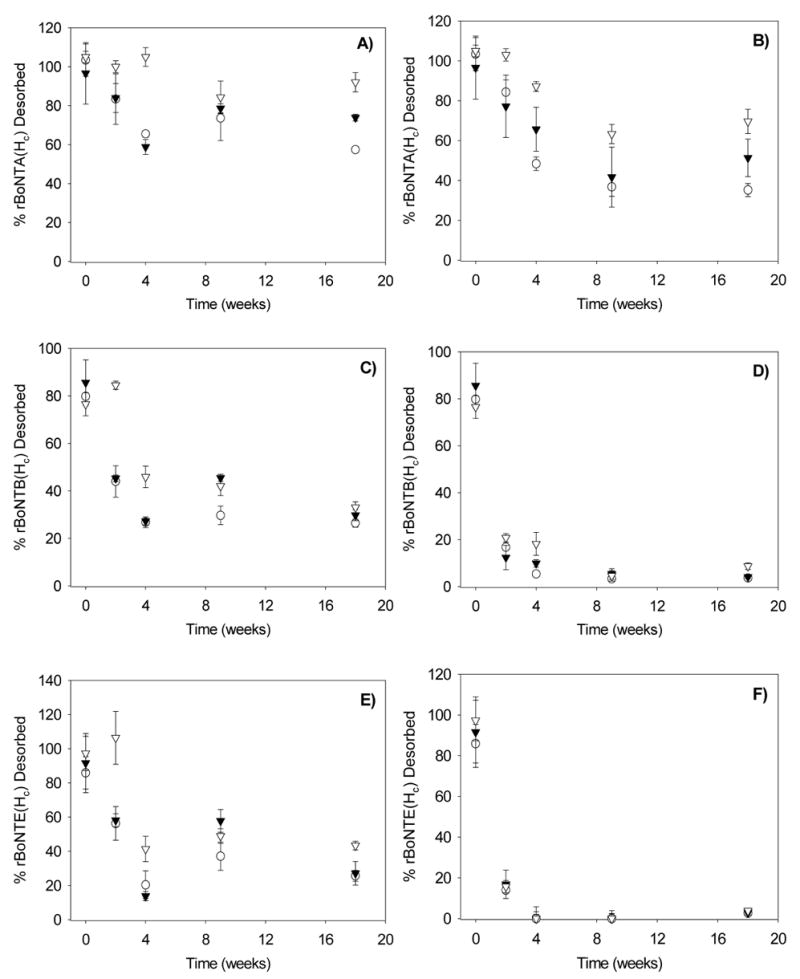
Desorption of protein from the rBoNTABE(Hc) sample formulations (determined as total mass of protein in desorption supernatants divided by the total mass added to samples) or % recovery of protein for control samples. Data is shown for the desorption of rBoNTA(Hc) for storage at A) 4°C and B) 30°C, desorption of rBoNTB(Hc) for storage at C) 4°C and D) 30°C, and desorption of rBoNTE(Hc) for storage at E) 4°C and F) 30°C. Data points on each graph indicate ○) buffer only formulation, ▼) buffer + trehalose, and ▽) buffer + trehalose + Polysorbate 20. Each data point represents the average desorption across the three replicate samples. Error bars represent the standard deviation of the replicate samples.
Formulations containing trehalose and polysorbate 20 showed greater desorption of rBoNTA(Hc) compared to buffer only formulations throughout the storage study. Samples stored at 4°C, containing both trehalose and surfactant, show greater desorption of rBoNTA(Hc) following two weeks of storage compared to t=0. However, at storage times of greater than four weeks, desorption of rBoNTB(Hc) and rBoNTE(Hc) was equivalent across the formulations at 4°C. Storage at 30°C also resulted in approximately equivalent desorption of rBoNTB(Hc) and rBoNTE(Hc) for all three formulations.
Physicochemical Properties of Formulations
pH
For the monovalent vaccine (rBoNTE(Hc)) samples, all formulations showed a slight increase in pH of the samples (approximately 0.1 to 0.3 pH units) during storage compared to that in the control samples of unbound protein (Figure 7). The change in pH was greater for samples stored at 30°C compared to those stored at 4°C.
Figure 7.
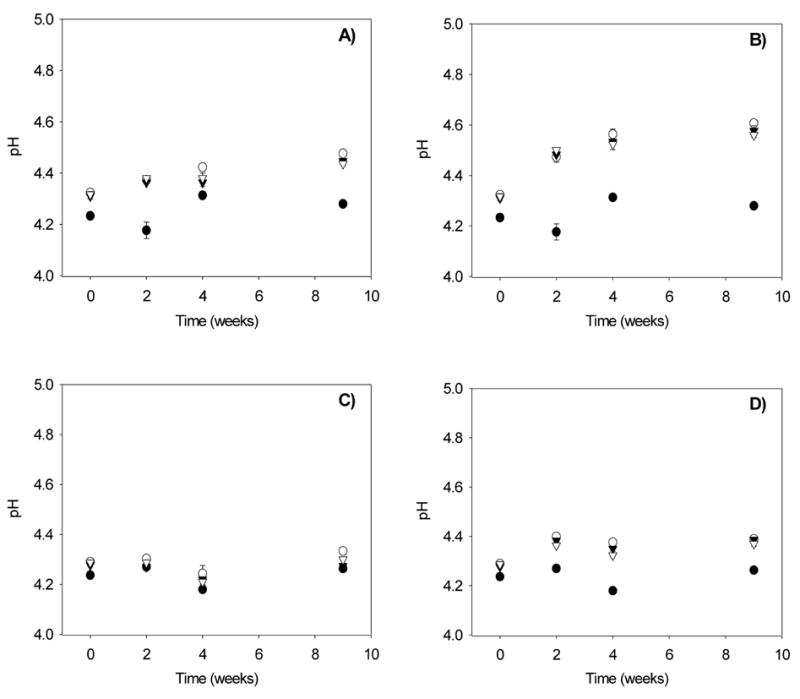
pH as a function of storage time for rBoNTE(Hc) formulations stored at A) 4°C and B) 30°C, and for rBoNTABE(Hc) formulations stored at C) 4°C and D) 30°C. Data points shown are for ●) controls and for adjuvant containing samples in formulations of ○) buffer, ▼) buffer + trehalose, and ▽) buffer + trehalose + Polysorbate 20. Each data point represents the average pH across the three replicate samples. Error bars represent the standard deviation of the replicate samples.
Although the adjuvant-bound rBoNTABE(Hc) samples stored at 30°C also showed a slight (approximately 0.1 pH unit) increase in pH with storage time compared to control samples, no significant changes to pH were observed for samples stored at 4°C. It should be noted that even at t=0, there were minor pH differences between the control samples and the adjuvant-containing samples. The pH values were not obtained for samples stored for eighteen weeks due to insufficient material.
Osmolality
Osmolality was tested at time zero and following two months of storage (Table 3). Changes in osmolality of the solution may be indicative of breakdown of formulation components/excipients. The results indicated similar values for the osmolality of the adjuvant containing formulations prior to and following storage. There was, however, an increase in osmolality for the rBoNTE(Hc) control samples following storage. The osmolality values obtained for the control samples were outside the ideal range for the instrument. Although intra-day variability for these measurements is low, the inter-day variability of the instrument may explain this change. Osmolality was not tested following eighteen weeks of storage due to insufficient material.
Table 3.
Comparison of solution osmolality at the initiation of the study vs. two months incubation. Each value represents the average osmolality across the three replicate samples, plus or minus the standard deviation.
| rBoNT(Hc) Osmolality (mOsmol/KG) | |||||
|---|---|---|---|---|---|
| E
4°C |
E
30°C |
ABE
4°C |
ABE
30°C |
||
| T = 0 | Control
(10 mM succinate, 10 mM phosphate, pH = 4) |
25 ± 1 | NA | 70 ± 2 | NA |
| 10 mM succinate, 10 mM phosphate, pH = 4
+ 0.2% AlOOH adjuvant |
36 ± 2 | NA | 75 ± 3 | NA | |
| 10 mM succinate, 10 mM phosphate, 7.5% trehalose,
pH = 4 + 0.2% AlOOH adjuvant |
260 ± 3 | NA | 296 ± 2 | NA | |
| 10 mM succinate, 10 mM phosphate, 7.5% trehalose,
0.01% Polysorbate 20, pH = 4 + 0.2% AlOOH adjuvant |
255 ± 1 | NA | 278 ± 14 | NA | |
| T = 9 week | Control
(10 mM succinate, 10 mM phosphate, pH = 4) |
46 ± 1 | NA | 83 ± 1 | NA |
| 10 mM succinate, 10 mM phosphate, pH = 4
+ 0.2% AlOOH adjuvant |
47 ± 1 | 44 ± 2 | 78 ± 1 | 80 ± 2 | |
| 10 mM succinate, 10 mM phosphate, 7.5% trehalose,
pH = 4 + 0.2% AlOOH adjuvant |
251 ± 3 | 257 ± 6 | 283 ± 1 | 300 ± 7 | |
| 10 mM succinate, 10 mM phosphate, 7.5% trehalose,
0.01% Polysorbate 20, pH = 4 + 0.2% AlOOH adjuvant |
250 ± 2 | 260 ± 2 | 288 ± 4 | 291 ± 11 | |
Solution Phosphate and Aluminum Concentrations
The rBoNTE(Hc) antigen was formulated in 10 mM phosphate, 10 mM succinate, pH = 4. Phosphate is known to interact with aluminum oxyhydroxide adjuvant25. It has been proposed that this interaction involves an exchange of phosphate ions for hydroxyl ions at the adjuvant surface. Alternatively, this may result from the precipitation of AlPO4 from solution due to the much lower solubility of AlPO4 compared to AlOOH. Either a surface exchange of PO4− for OH− or precipitation of AlPO4 would result in a more negatively-charged surface. The electrostatic interactions between an AlPO4 surface and the positively charged proteins are expected to be more favorable compared to adsorption to the AlOOH surface.
In our system, the inclusion of phosphate in the buffers was necessary to facilitate adsorption of all three protein antigens to the Alhydrogel™ 1. Phosphate and aluminum concentrations in the supernatants of the stored samples following centrifugation were determined using ICP-OES, and the degree of phosphate substitution and/or AlPO4 precipitation calculated by mass balance.
The levels of aluminum in the solutions following centrifugation of the adjuvant-bound protein were low (< 1ppm), and remained so consistently throughout the storage stability study. These levels were observed for all formulations tested, and for storage at both 4°C and 30°C.
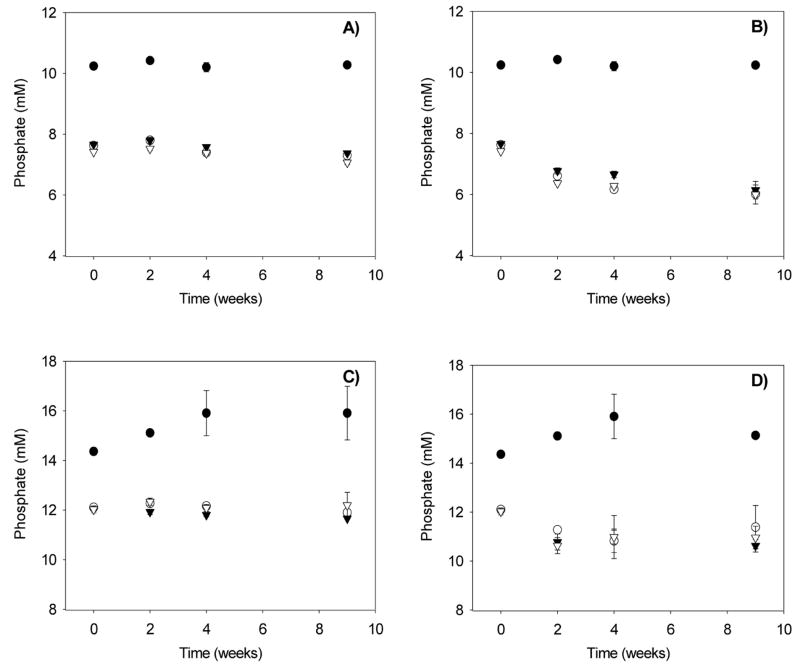
Expected phosphate concentrations of 10 mM for the rBoNTE(Hc) samples were verified by ICP-OES at t=0 in the control samples containing protein without adjuvant (Figure 8). Adjuvant-containing samples had significantly lower phosphate concentrations (~ 20% lower). There was a continued decrease in sample phosphate concentration as a function of time for formulations stored at 30°C.
Figure 8.
Concentrations of phosphate in supernatant solutions following centrifugation of the antigen-adjuvant complex as a function of antigen-adjuvant complex storage time. Phosphate concentrations were determined using ICP-OES. Data shown is for the rBoNTE(Hc) formulations stored at A) 4°C and B) 30°C and for the rBoNTABE(Hc) formulations stored at C) 4°C and D) 30°C. Data points shown are for ●) controls and for adjuvant containing samples in formulations of ○) buffer, ▼) buffer + trehalose, and ▽)buffer + trehalose + Polysorbate 20. Each data point represents the average phosphate concentration across the three replicate samples. Error bars represent the standard deviation of the replicate samples.
The 10 mM phosphate, 10 mM succinate, pH 4 buffer for the rBoNTE(Hc) formulations was chosen because it was used in early studies in a mouse model in which the vaccine was shown to confer protection against the neurotoxin (unpublished observations). Similar earlier studies (unpublished data) with adsorbed rBoNTABE(Hc), included higher buffer concentrations (15 mM phosphate, 25 mM succinate) in an effort to increase adsorption of the three proteins. We chose the same concentrations of buffers for the adsorbed rBoNTABE(Hc) storage study. The ICP-OES analysis verified a concentration of 15 mM phosphate in the rBoNTABE(Hc) control samples without adjuvant, and a significantly lower phosphate concentration in the adjuvant containing samples (Figure 8). Decreases in phosphate concentration as a function of time were measured for the adjuvant-bound rBoNTABE(Hc) stored at 30°C.
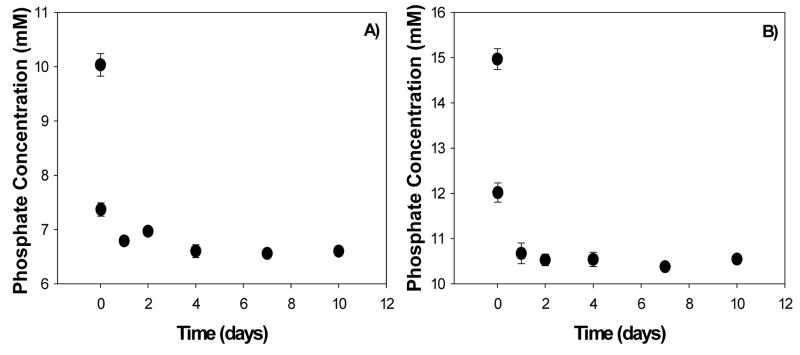
Experiments were performed to study the kinetics of the surface exchange between phosphate ion and Alhydrogel™. The Alhydrogel™ (10 mL, 0.2% w/v) was incubated in 10 mM succinate, 10 mM phosphate, pH 4 or 25 mM succinate, 15 mM phosphate, pH 4 at room temperature for times ranging from 10 minutes to 10 days. Samples were then centrifuged for 5 minutes at 2300 × g to pellet the adjuvant. The supernatants were analyzed for phosphate using a HACH® DR/4000 colorimetric analysis kit. These experiments indicated that in the absence of protein, the surface exchange of phosphate ions for hydroxyl ions and/or precipitation of AlPO4 were rapid, with a plateau in the rate of surface conversion attained at two days (Figure 9). The rBoNT(Hc) samples in the same buffer system required between two and four weeks to reach similar phosphate concentrations (~6.5 mM phosphate in rBoNTE(Hc) samples).
Figure 9.
Concentrations of phosphate in supernatant solutions following centrifugation of the adjuvant in the absence of antigen as a function of buffer-adjuvant storage time. Data shown is for the buffers used in the A) rBoNTE(HC) buffer-only formulation (10 mM succinate, 10 mM phosphate, pH = 4) and B) rBoNTABE(HC) buffer-only formulation (25 mM succinate, 15 mM phosphate, pH = 4). Each data point represents the average phosphate concentration across the three replicate samples. Error bars represent the standard deviation of the replicate samples.
Protein Structure and Conformational Stability
Differential Scanning Calorimetry (DSC)
For some proteins, thermal unfolding is reversible and DSC can be used to obtain melting temperatures and the enthalpy of unfolding. In the case of rBoNTE(Hc), heating-induced conformational changes were not reversible due to aggregation. Hence, thermodynamic parameters cannot be calculated. However, DSC thermograms were collected and studied qualitatively at the initiation of the study, and following four and nine weeks of storage. Sample volumes were insufficient for such analysis following eighteen weeks of storage.
The DSC measurements for adjuvant-containing samples included the use of an adjuvant particle suspension in the reference cell that was identical to the sample except that proteins were not present in the reference material. DSC measurements of control samples included buffer only in the reference cell. The resulting thermodynamic observations are expected to be specific to the proteins as opposed to buffer components or the adjuvant itself.
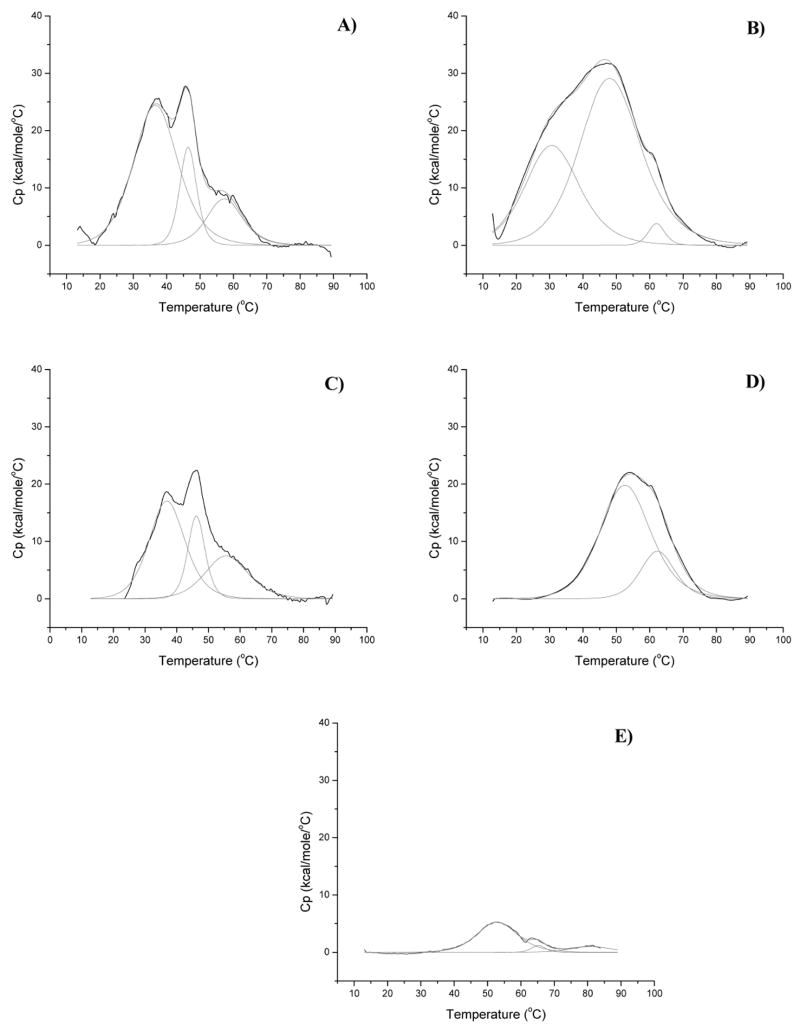
The DSC thermograms obtained at t=0 showed three distinct transitions for control (no adjuvant, rBoNTE(Hc) in 10 mM phosphate, 10 mM succinate, pH 4). A representative thermogram is shown in Figure 10A. The lowest-temperature transition was broad, spanning from 20–55°C and overlapping the second and narrowest transition, which spanned from 40–50°C. The final transition was much smaller in magnitude, and spanned from 50–70°C. Following nine weeks of storage, DSC thermograms for control samples were similar in appearance to those observed at t=0, with approximately equivalent peak locations and magnitudes.
Figure 10.
DSC scans of rBoNTE(Hc) protein in the presence and absence of aluminum salt adjuvant. Scans include A) control, T = 0, B) adjuvant-bound rBoNTE(Hc) T = 0, C) control, 4°C storage, T = 9 week, D) adjuvant-bound rBoNTE(Hc), 4°C storage, T = 9 week, and E) adjuvant-bound rBoNTE(Hc), 30°C storage, T = 9 week. All samples are for buffer only formulations.
The thermogram obtained for rBoNTE(Hc) adsorbed to Alhydrogel™ (10 mM phosphate, 10 mM succinate, pH 4) was much different in appearance compared to those for the control sample (Fig. 10). Curve fitting indicated that there were still three transitions. The lowest temperature transition for the adsorbed protein was similar in shape to the transition observed for the control sample, although the magnitude appeared to have decreased. The second peak, however, was significantly broadened, spanning from about 20–75°C. The highest temperature transition also decreased in magnitude.
The thermograms for stored adjuvant-bound rBoNTE(Hc) samples (10 mM phosphate, 10 mM succinate, pH 4) were much different in appearance compared to that for the t=0 samples. The lowest temperature transition (peak max ~ 35°C) was no longer visible following storage at either 4 or 30°C. The loss of this transition from the DSC scans most likely indicates unfolding of the antigen on the surface of the adjuvant during storage. The samples stored at 4°C showed a narrowing of the transition at approximately 50°C, and a broadening of the higher temperature (60°C) transition. Samples stored at 30°C showed significant losses in the magnitude of the remaining two transitions (50°C and 60°C).
Front-Face Fluorescence Spectroscopy
Fluorescence spectroscopy is useful in the analysis of protein tertiary structures, which includes proteins that are adsorbed to aluminum salt adjuvants26. The location of the peak maximum in a fluorescence emission scan can be indicative of the polarity of the microenvironments of tryptophan residues. Peak maxima at higher wavelengths suggest a more polar environment for the tryptophan residues, whereas peak maxima at lower wavelengths suggest a decrease in the polarity of the environment for these residues. Also, monitoring of peak maximum positions as a function of temperature can provide information regarding thermally-induced unfolding events.
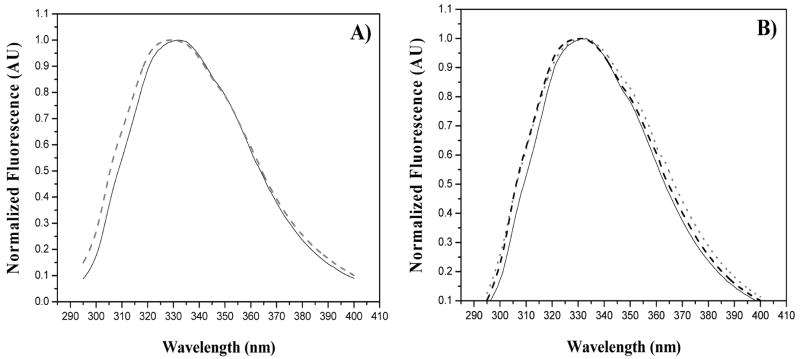
Emission scans at 20°C at t=0 (Figure 11A) had a fluorescence intensity maximum at 332 nm for the control (no adjuvant) samples and at 330 nm for adjuvant-bound rBoNTE(Hc) (in 10 mM phosphate, 10 mM succinate, pH 4), indicating a less polar microenvironment for the tryptophan residues in the adsorbed protein. Following nine weeks of storage at 4°C, fluorescence scans collected at 20°C for the control and adjuvant-bound protein showed no change compared to the respective scans at t=0 (Figure 11). For adjuvant-bound rBoNTE(Hc) sample stored at 30°C there was a shift in the fluorescence intensity maximum to 332 nm. At low wavelengths, this emission scan almost overlayed that for the control sample stored at 30°C, but the scan for the adjuvant-bound sample was slightly broader at higher wavelengths.
Figure 11.
Fluorescence scans of rBoNTE(Hc) in control samples and adsorbed to aluminum salt adjuvant. Scans were taken at a temperature of 20°C. Panel A shows data obtained for control samples (——) and adjuvant-bound rBoNTE(Hc) (------) at t=0. Panel B shows data for control samples stored at 4°C for 9 weeks (——), adjuvant-bound rBoNTE(Hc) (------) stored at 4°C for 9 weeks, and adjuvant-bound rBoNTE(Hc) (· · · · ·) stored at 30°C for 9 weeks. All samples are for buffer only formulations.
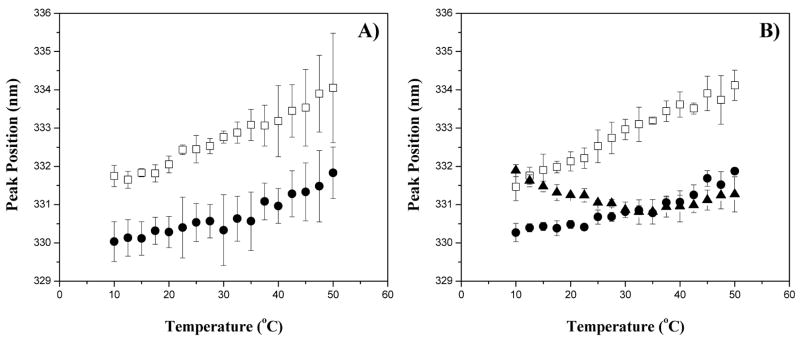
Emission scans were also collected as a function of temperature to evaluate thermally-induced changes to the rBoNTE(Hc) tertiary structure (in 10 mM phosphate, 10 mM succinate, pH 4). There was a shift of the florescence intensity maximum for the rBoNTE(Hc) control samples as a function of temperature, with the fluorescence intensity maximum at 332 nm at 10°C increasing to 334 nm at 50°C (Figure 12A). Similar results were obtained after nine week of storage at 4°C (Figure 12B).
Figure 12.
Position of peak maxima in thermal fluorescence studies of rBoNTE(Hc) protein in the presence and absence of aluminum salt adjuvant. Panel A shows data obtained for □) controls and ●) adjuvant-bound rBoNTE(Hc) in the buffer only formulation at t=0. Panel B shows data obtained for □) controls stored at 4°C for 9 weeks, ●) adjuvant-bound rBoNTE(Hc) in the buffer only formulation stored at 4°C for 9 weeks, and ▲) adjuvant-bound rBoNTE(Hc) in the buffer only formulation stored at 30°C for 9 weeks. Each data point represents the average peak position across the three replicate samples. Error bars represent the standard deviation of the replicate samples.
There was also a heating-induced increase in the wavelength of the fluorescence intensity maximum for the adjuvant-bound rBoNTE(Hc) samples, with the fluorescence intensity maximum at 330 nm at 10°C increasing to 331.5 nm at 50°C. These shifts suggest a small increase in the polarity of tryptophan microenvironments with increasing temperature, both for control samples and for protein adsorbed to adjuvant. Data obtained at higher temperatures (T > 50°C) showed a high degree of scatter. Samples stored at 4°C for nine weeks showed similar thermal profiles to those observed at t=0 (Figure 12B). However, samples stored for nine weeks at 30°C showed different thermal behavior, with a fluorescence intensity maximum at 332 nm at 10°C. The fluorescence intensity maximum decreases to 331 nm by 20°C, with no significant changes to the spectra between 20 and 50°C. These data suggest an increased polarity of the microenvironment of adsorbed rBoNTE(Hc) stored at elevated temperature prior to heating of the samples for the fluorescence experiment.
Samples of rBoNTE(Hc) controls and adjuvant-bound rBoNTE(Hc) showed similar shifts in the fluorescence intensity maxima with increasing temperature between samples stored for four weeks (data not shown) and samples stored for nine weeks. Fluorescence scans were not collected following eighteen weeks of storage due to insufficient sample volumes.
Second Derivative UV Spectroscopy of Desorbed rBoNTE(Hc)
Protein UV spectra for desorption supernatants (following removal of the adjuvant particles by centrifugation) give a broad absorbance peak in the range of 200 to 300 nm. Specific amino acid residues, including phenylalanine, tyrosine, and tryptophan contribute significantly to the absorbance in the range of 240 to 300 nm27. The relative positions of the individual spectral components, as determined from the second derivative of the original spectrum, provide information on the polarity of the environment of these residues. Peak maxima at shorter wavelengths indicate a more hydrophilic microenvironment, whereas longer wavelengths indicate a more hydrophobic microenvironment. Peak shifts from longer to shorter wavelength are labeled as blue shifts, while shifts from shorter to longer wavelength are labeled as red shifts.
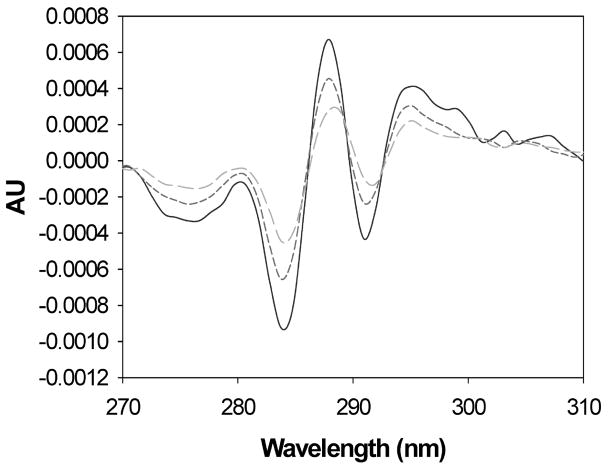
Representative second derivative UV spectral scans of the rBoNTE(Hc) antigen after desorption from Alhydrogel™ are shown in Figure 13. A loss in the intensity of the second derivative peaks at ~285 nm and~291 nm was observed as a function of storage time. This was due to a decrease in protein concentration in the samples because of a reduction in desorption of rBoNTE(Hc) from the adjuvant particles. This loss in signal intensity also results in a decrease to the signal-to-noise ratio for these samples, especially for the later time points.
Figure 13.
Representative second derivative spectra for rBoNTE(Hc) desorbed from Alhydrogel™. Spectra shown are for buffer only samples stored at a temperature of 4°C. Individual spectra are for ———) = 0, ------) t=4 weeks, and – – – –) t=18 weeks
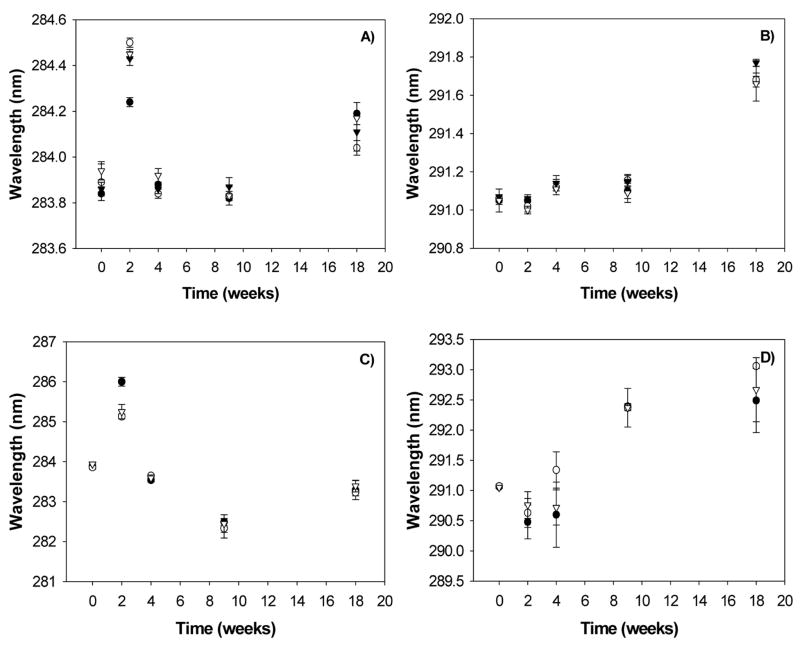
As a function of storage, the second derivative UV spectra of desorbed rBoNTE(Hc) showed changes in the locations of the tyrosine/tryptophan and the tryptophan second derivative peaks, which are present at approximately 285 nm and approximately 291 nm, respectively (Figure 14). These changes were similar for adjuvant-bound samples stored in buffer alone, buffer plus trehalose and buffer plus trehalose and polysorbate 80. The tyrosine/tryptophan peaks initially exhibit minima at approximately 283.9 nm. Following two weeks of storage of the adjuvant-bound rBoNTE(Hc), these peaks were red-shifted for the desorbed rBoNTE(Hc), with minima at 284.2 to 284.6 nm. This was observed for storage at both 4 and 30°C. The rBoNTE(Hc) in the control samples not bound to adjuvant showed a similar shift in the location of the minima for this peak at two weeks. The locations of the tyrosine/tryptophan peaks in the desorbed rBoNTE(Hc) following four weeks of storage of the adjuvant-bound protein were similar to those observed at t=0. For the samples stored at 4°C, the location of the tyrosine/tryptophan peaks for the desorbed rBoNTE(Hc) remain constant between four and nine weeks, and were red-shifted following eighteen weeks of storage. Although the observed peak shifts are small, they are significant considering the 0.03 nm resolution of the data following processing.
Figure 14.
Position of peaks from 2DUV spectroscopic analysis of desorbed rBoNTE(Hc) as a function of antigen-adjuvant storage time. Graphs shown are for the A) ~285 nm and B) ~291 nm peaks for samples stored at 4°C, and the C) ~285 nm and D) 291 nm peaks for samples stored at 30°C. Data points shown are given for ●) control samples in buffer, and for adjuvant-bound samples in formulations of ●) buffer, ▼) buffer + trehalose, and ▽) buffer + trehalose + Polysorbate 20. Each data point represents the average peak position across the three replicate samples. Error bars represent the standard deviation of the replicate samples.
In addition to monitoring the positions of the tyrosine and tryptophan peaks, a/b ratios were calculated from each of the resulting sample spectra. However, due to the decreasing concentrations, there was a high degree of scatter in the data after two weeks of storage that precluded additional analysis (data not shown).
The samples stored at 30°C show a blue shift in the tyrosine/tryptophan peaks of the desorbed rBoNTE(Hc) by nine weeks, but return to approximately 283 nm by eighteen weeks. Despite the large shifts observed for the tyrosine/tryptophan peaks, there are no specific trends between peak location and adjuvant-bound protein storage time.
The tryptophan peak (approximately 291 nm) in the spectrum of desorbed rBoNTE(Hc) was also monitored as a function of storage time. There were no significant changes to peak position for this peak for samples stored at 4 or 30°C at the two week time point. However, there was a red shift in the position of the tryptophan peak in the spectra of desorbed rBoNTE(Hc) for samples stored at both 4 and 30°C with increased storage times. This trend is suggestive of storage time-dependent conformational changes of the adjuvant-bound rBoNTE(Hc).
Discussion
Mass of rBoNT(Hc) Adsorbed to Adjuvant During Long Term Storage
The PZC for aluminum hydroxide adjuvant in the absence of phosphate ions is approximately 11, so the adjuvant would be expected to have a net positive surface charge under the conditions studied. The proteins (pI rBoNTA(Hc) = 9.0, pI rBoNTB(Hc) = 7.2, pI rBoNTE(Hc) = 8.7) would also have a net positive charge under these conditions, resulting in electrostatic repulsion between the proteins and the adjuvant surface. Previous work indicated that attractive electrostatic interactions could be achieved if the adsorption solutions contain phosphate ions1. The presence of phosphate ions in the adsorption solutions may result in either a change in the adjuvant surface chemistry or a conversion of one salt species to the other due to precipitation of AlPO4, giving a more negative net surface charge to the adjuvant. Generally one might hypothesize that aluminum phosphate adjuvant would have been a better choice for these studies. However, early animal studies indicated much greater protection against the toxins when the rBoNT(Hc) proteins were adsorbed to aluminum hydroxide adjuvant compared to aluminum phosphate adjuvant.
Our results indicated essentially complete adsorption of rBoNTE(Hc) to adjuvant throughout the study. The adsorption of rBoNTA(Hc) in the rBoNTABE(Hc) samples was incomplete at study initiation, but showed a steady increase in the mass adsorbed as a function of storage time. The incomplete adsorption of rBoNTA(Hc) at study initiation was not unexpected. Previous short-term competitive adsorption studies indicated a maximum of approximately 40 μg rBoNTA(Hc) could be adsorbed per mg of Alhydrogel™ (10 mM succinate, 10 mM phosphate, pH 4), whereas the intended loading for the stability study was approximately 50 μg of each rBoNT(Hc) antigen per mg of Alhydrogel™ 1. The adsorption of rBoNTA(Hc) at the initiation of the storage stability study was slightly improved in the 25 mM succinate, 15 mM phosphate, pH 4 buffer compared to the previous competitive adsorption studies at this loading level (which gave about 11 μg rBoNTA(Hc)/mg Alhydrogel™), with about 55% (23 μg rBoNTA(Hc) per mg of Alhydrogel™) adsorbed from the buffer-only formulation.
The adsorption of rBoNTA(Hc) was reduced in the presence of trehalose compared to the buffer-only formulation. Specific interactions between trehalose and the adjuvant surface (e.g. competitive binding between trehalose and protein for adjuvant surface sites) were not investigated as a part of this study. The sugars are not expected to adsorb strongly to the adjuvant surface due to a lack of attractive charge-charge interactions between the sugar molecules and the adjuvant surface. Studies by Wendorf et al. also showed a decreased adsorption of model proteins to solid surfaces in the presence of sugars28. The protein surface adsorption was found to be inversely proportional to protein conformational stability in the presence and absence of a number of stabilizing excipients, including sucrose and trehalose. These authors concluded that these effects were not because of interactions between sucrose and the solid surface. Speculatively, an increase in the stability of the native conformation in the bulk solution in the presence of trehalose may reduce the capacity of the protein molecules to adsorb onto the adjuvant surface. Another suggestion is that the sugar may increase spreading of the protein on the surface, reducing the number of molecules representing monolayer coverage. However, our results do not provide a basis to discriminate between these or other potential mechanisms for the observed reduction in adsorption in the presence of trehalose.
The adsorption of rBoNTA(Hc) was further reduced in the presence of polysorbate 20. Surfactants have been previously shown to reduce adsorption to solid surfaces and/or to cause desorption of proteins from solid surfaces, presumably through competition for surface sites29–31. Potentially the presence of surfactant in the adjuvant-containing formulations may result in a similar competitive effect and thus decreased protein adsorption.
The increases in adsorption of rBoNTA(Hc) between study initiation and the two week storage time point were significant for all of the formulations. During the course of the storage study, there were also slight reductions in solution phosphate concentrations and an increase in pH. These changes result from exchange of hydroxyl ions from the adjuvant surface for phosphate ions or from further precipitation of AlPO4. As a result, the charge difference between the protein and the adjuvant surface would be increased, which would favor more adsorption of protein to the adjuvant. However, the relevant adjuvant surface chemistry changes were only significant at the two week time point for samples stored at 30°C. Because the increases in rBoNTA(Hc) adsorption to adjuvant were observed in samples stored for two weeks at both 4 °C and 30°C, the changes in adjuvant surface chemistry do not fully explain the changes in adsorption.
In studies by Estey et al.23, the chemical stability of the rBoNT(Hc) proteins was monitored by peptide mapping mass spectrometry. The results of this work indicated an oxidation and deamidation of a large number of residues in the protein during storage. These chemical changes may alter the interactions between the rBoNT(Hc) proteins and the Alhydrogel™ as a function of storage time. Deamidation would be expected to result in a more negative charge for the proteins under these conditions. However, it is important to note that the net electrostatic charge for both the proteins and the adjuvant is an average of the charges present. Heterogeneous charge distribution could lead to attractive charge-charge interactions even under conditions at which the net charge is electrostatically repulsive. Oxidation may affect the non-specific interactions between the protein and the adjuvant surface. Alternatively, the occurrence of so many chemical changes to the proteins may result from protein unfolding during storage time, exposing amino acid residues that were previously buried in the protein core to the adjuvant surface.
Desorption of rBoNT(Hc) Following Storage of the Adjuvant-Bound Protein
There was a decrease in the capacity to desorb rBoNTE(Hc) and rBoNTB(Hc) proteins from the adjuvant during storage of samples. Previously, Shi et al.32, reported that storage of ovalbumin bound to aluminum salt adjuvant resulted in increased retention of the adsorbed protein upon subsequent exposure to sheep lymph fluid, which was used as a surrogate to interstitial fluid. Conversely, storage of adjuvant-bound lysozyme did not significantly alter the retention of adsorbed protein upon exposure to sheep lymph fluid. The authors suggested that the greater conformational stability of hen egg white lysozyme was responsible for its greater degree of desorption from adjuvant following storage. Studies by McGuire et al. also showed that increased protein conformational stability increases the ability to desorb proteins from surfaces31. In their studies, they utilized site directed mutagenesis techniques to alter conformational stability of a protein while maintaining its size and general structural elements.
McNay et al. also showed changes in the ability to elute proteins from surfaces as a function of time33. In this work, interactions between hen egg white lysozyme and chromatographic resin were studied by multiple spectroscopic techniques. Their results indicated that proteins with a greater degree of conformational change during adsorption were more difficult to elute from the resin.
The unfolding of a protein at a surface has two consequences that may affect its desorption. First, unfolded protein molecules generally have a greater surface area compared to that of the native protein. The greater surface area results in a greater number of potential contacts between the protein molecule and the surface, resulting in stronger adsorption 35,36. Second, unfolded protein molecules may have a greater degree of surface-exposed hydrophobic amino acid residues compared to native protein molecules, which could facilitate protein aggregation on the adjuvant surface.
It is notable that of the three proteins adsorbed to adjuvant in the rBoNTABE(Hc) samples, rBoNTB(Hc) has the lowest degree of desorption immediately following adsorption, with only about 80% desorbed compared to 85–95% desorption of rBoNTE(Hc) and 100% desorption of rBoNTA(Hc) immediately following adsorption. Studies by Morefield et al34 and by Iyer et al35 indicate that proteins with a greater degree of phosphorylation are more resistant to desorption than those with no phosphorylated amino acid residues. Mass spectroscopic analysis of the rBoNT(Hc) proteins indicated varying degrees of phosphorylation for the three proteins included in this study, with one, five, and two potential phosphorylation sites on rBoNTA(Hc), rBoNTB(Hc), and rBoNTE(Hc) respectively1. The incomplete desorption of rBoNTB(Hc) and rBoNTE(Hc) at t=0 seems to correlate with the number of phosphorylation sites on the proteins. Additionally, as protein unfolding occurs at the adjuvant surface, the number of phosphorylated amino acids in contact with the surface may also increase, thus further inhibiting desorption.
A comparison of rBoNTE(Hc) desorption between the adjuvant-bound rBoNTE(Hc) samples and the adjuvant-bound rBoNTABE(Hc) samples show similar changes to desorption as a function of time. This result suggests that changes that may occur to adsorbed rBoNTE(Hc) as a function of storage time are not affected by the presence of additional protein molecules at the adjuvant surface, at least over the time course studied.
The exception to the general observation of reduced desorption with storage time was rBoNTA(Hc) from adjuvant-bound rBoNTABE(Hc) formulations containing both trehalose and polysorbate 20 and stored at 4°C, which showed complete desorption even following eighteen weeks of storage. The rBoNTA(Hc) had the lowest adsorption capacity of the three proteins in previous competitive adsorption experiments1. The desorption data suggest that this protein had the lowest affinity for the surface. This protein also had the least number of phosphorylated amino acid residues at study initiation. In the screening of desorption solutions, solutions containing surfactant did not show any advantages in terms of their ability to desorb rBoNTB(Hc) compared to solutions containing no surfactant. Since the screening was only performed on samples of rBoNTB(Hc) adsorbed to adjuvant, it is impossible to say whether the inclusion of surfactant (instead of high salt) in the desorption solution would have had an impact on the desorption of rBoNTA(Hc).
Protein Structure and Conformational Stability
Previous studies have shown that protein conformation is altered as a result of adsorption to solid surfaces17,36,37, which is consistent with our investigation of the structure of rBoNTE(Hc) adsorbed to Alhydrogel™. We also found that there were alterations in the conformation of the adjuvant-bound protein during storage in aqueous solution. However, it is difficult to propose specific changes to the protein structure based on these results. For example, the DSC thermograms for rBoNTE(Hc) adsorbed to adjuvant acquired at the study’s initiation were much different in appearance compared to those obtained following nine weeks of storage. The thermograms of the stored samples show a loss in magnitude for the lower temperature transitions, and this loss was more pronounced for samples stored at 30°C compared to storage at 4°C. Transitions observed in DSC thermograms of proteins may be associated with phase changes, such as the melting (unfolding) of a whole protein, or the unfolding of a particular region on a protein38. The transitions may result from the changes in heat capacity associated with the hydration of previously buried amino acid residues. Furthermore, for proteins adsorbed to adjuvants, heat signals may arise from thermally-induced interactions such as the reorientation of protein molecules at a surface that do not necessarily include unfolding events39,40. In cases where these unfolding processes are reversible (e.g. similar profiles are obtained through multiple heating and cooling cycles), thermodynamic parameters including the enthalpy of the transitions, as well as the melting temperature for the transitions may be calculated. In the case of rBoNTE(Hc), the transitions were not reversible due to thermally-induced aggregation of the protein. These data can therefore only be discussed qualitatively.
In the thermograms obtained for the rBoNTE(Hc) control samples three transitions were observed, which suggests that at least three different thermally-induced processes occur. Three transitions were also observed in the thermograms of rBoNTE(Hc) immediately following adsorption to Alhydrogel™. However, thermograms of adsorbed rBoNTE(Hc) stored at 4°C did not show the lowest-temperature transition, and thermograms of adsorbed rBoNTE(Hc) stored 30°C showed only the highest-temperature transition. We have interpreted the loss of the lower-temperature transitions from the thermograms of the stored protein as an indication that the protein experienced some degree of unfolding during storage. Unfolding of the proteins would result in both a greater degree of contact between the proteins and the adjuvant surface, and an increase in resistance to desorption. Alternatively, protein aggregation at the adjuvant surface may alter the heat capacity profiles. The analyses of solution pH and phosphate concentrations suggest a greater degree of electrostatic attraction between the adjuvant and proteins over time, which could also result in changes to thermal events observed by differential scanning calorimetry.
The fluorescence spectra and second derivative UV spectra of rBoNTE(Hc) desorbed from adjuvant suggest changes in the polarity of the environment of tyrosine and tryptophan residues in the protein as a function of storage time. Both techniques appear to show shifts in the peak locations for the tryptophan peaks as a function of storage time. The two techniques give opposing results in terms of the polarity of the environment for the tryptophan residues in the adsorbed rBoNTE(Hc) as a function of storage time, and are therefore difficult to interpret. The different results between the two techniques may result from the handling of the samples prior to testing. The proteins were desorbed from the adjuvant surface prior the to second derivative UV analysis, while they remained adsorbed to adjuvant in the fluorescence analysis. The microenvironment of each tryptophan residue in the protein may be very different in the presence of the Alhydrogel™. This could explain why even at t=0, a shift in the fluorescence peak maxima was observed upon adsorption to the adjuvant surface, compared to the control samples. Second derivative UV spectroscopy was also performed on samples of rBoNTE(Hc) adsorbed to the surface of the Alhydrogel™ (data not shown). However, the presence of the adjuvant particles led to a high degree of light scattering in this analysis. This resulted in a low signal to noise ratio, which precluded the monitoring of the tryptophan and tyrosine peak positions as a function of storage time.
Conclusions
Conformational and/or chemical changes occur to rBoNT(Hc) antigens adsorbed to Alhydrogel™ in both a monovalent (rBoNTE(Hc)) and a trivalent (rBoNTABE(Hc)) configuration upon storage. These changes were evidenced both by spectroscopic techniques and by changes in the ability to desorb the protein from the adjuvant surface following storage. However, it is not known whether these changes are detrimental to the efficacy and safety of the vaccine product.
Acknowledgments
Funding for this project was provided by National Institute of Allergy and Infectious Diseases (NIAID) U01 AI056514-01. The Department of Defense (DoD) Joint Vaccine Acquisition Program (DAMD-17-98-C-8024) provided the rBoNTA(Hc) and rBoNTB(Hc) antigens.
Abbreviations
- BoNT
Botulinum Neurotoxin
- rBoNT(Hc)
recombinant botulinum neurotoxin antigen
- rBoNTA(Hc)
recombinant botulinum neurotoxin antigen serotype A
- rBoNTB(Hc)
recombinant botulinum neurotoxin antigen serotype B
- rBoNTE(Hc)
recombinant botulinum neurotoxin antigen serotype E
- rBoNTABE(Hc)
mixture of recombinant botulinum neurotoxin antigen serotypes A, B and E
- PZC
point of zero charge
- PI
isoelectric point
- ζ
zeta potential
Footnotes
The views, opinions, assertions, and findings contained herein are those of the authors and should not be construed as official DoD or US Department of Army positions, policies, or decisions, unless so designated by other documentation.
References
- 1.Vessely C, Estey T, Randolph T, Henderson I, Nayar R, Carpenter JF. Effects of Solution Conditions and Surface Chemistry on the Adsorption of Three Recombinant Botulinum Neurotoxin Antigens to Aluminum Salt Adjuvants. Journal of Pharmaceutical Sciences. 2007 doi: 10.1002/jps.20880. In Press. [DOI] [PubMed] [Google Scholar]
- 2.Yang G, Kim K, Jeong S, Huh G, Kim J, Jungh H. Isolation and characterization of a neutralizing antibody specific to internalization domain of Clostridium botulinum neurotoxin type B. Toxicon. 2004;44(1):19–25. doi: 10.1016/j.toxicon.2004.03.016. [DOI] [PubMed] [Google Scholar]
- 3.Cherington M. Clinical Spectrum of Botulism. Muscle and Nerve. 1998;21:701–710. doi: 10.1002/(sici)1097-4598(199806)21:6<701::aid-mus1>3.0.co;2-b. [DOI] [PubMed] [Google Scholar]
- 4.Comella C, Pullman S. Botulinum toxins in neurological disease. Muscle and Nerve. 2004;29(5):628–644. doi: 10.1002/mus.20033. [DOI] [PubMed] [Google Scholar]
- 5.Turton K, Chaddock J, Acharya K. Botulinum and Tetanus Neurotoxins: Structure, Function and Therapeutic Utility. Trends in Biochemical Sciences. 2002;27(11):552–558. doi: 10.1016/s0968-0004(02)02177-1. [DOI] [PubMed] [Google Scholar]
- 6.Cochrane R. Biological Warfare Research in the United States. II. Fort Detrick; Md: 1947. History of the Chemical Warfare Service in World War II (1July 1940–15 August 1945). Historical Section, Plans, Training and Intelligence Division, Office of Chief, Chemical Corps, United States Army. [Google Scholar]
- 7.Arnon S, Schechter R, Inglesby T, Henderson D, Bartlett J, Ascher M, Eitzen E, Fine A, Hauer J, Layton M, Lillibridge S, Osterholm M, O’toole T, Parker G, Perl T, Russell P, Swerdlow D, Tonat T. Botulinum Toxin as a Biological Weapon - Medical and Public Health Management. Journal of the American Medical Association. 2001;285(8):1059–1070. doi: 10.1001/jama.285.8.1059. [DOI] [PubMed] [Google Scholar]
- 8.Lamb A. Biological Weapons: The Facts Not the Fiction. Clinical Medicine. 2001;1(6):502–504. doi: 10.7861/clinmedicine.1-6-502. [DOI] [PMC free article] [PubMed] [Google Scholar]
- 9.DePaz RA, Henderson I, Advant S. Formulation of Botulinum Neurotoxin Heavy Chain Fragments for Vaccine Development: Mechanisms of Adsorption to an Aluminum-Containing Adjuvant. Vaccine. 2005;23:4029–4035. doi: 10.1016/j.vaccine.2005.03.028. [DOI] [PubMed] [Google Scholar]
- 10.Byrne M, Smith L. Development of Vaccines for Prevention of Botulism. Biochimie. 2000;82:955–966. doi: 10.1016/s0300-9084(00)01173-1. [DOI] [PubMed] [Google Scholar]
- 11.O’Hagan D, MacKichan M, Singh M. Recent Developments in Adjuvants for Vaccines Against Infectious Diseases. Biomolecular Engineering. 2001;18:69–85. doi: 10.1016/s1389-0344(01)00101-0. [DOI] [PubMed] [Google Scholar]
- 12.Singh M, O’Hagan D. Advances in Vaccine Adjuvants. Nature Biotechnology. 1999;17:1075–1081. doi: 10.1038/15058. [DOI] [PubMed] [Google Scholar]
- 13.Rinella J, Workman R, Hermodson M, White J, Hem S. Elutability of Proteins from Aluminum-Containing Vaccine Adjuvants by Treatment with Surfactants. Journal of Colloid and Interface Science. 1998;197:48–56. doi: 10.1006/jcis.1997.5230. [DOI] [PubMed] [Google Scholar]
- 14.Jendrick S, Little S, Hem S, Mitra G, DGiardina S. Evaluation of the compatibility of a second generation recombinant anthrax vaccine with aluminum-containing adjuvants. Vaccine. 2003;21(21–22):3011–3018. doi: 10.1016/s0264-410x(03)00109-9. [DOI] [PubMed] [Google Scholar]
- 15.Eldridge J, Staas J, Mueulbroek A, Tice T, Gilley R. Biodegradable and biocompatible poly(DL-Lactide-Co-Glycolide) microspheres as an adjuvant for staphylococcal enterotoxin B toxoid which enhances the level of toxin-neutralizing antibodies. Infection and Immunity. 1991;59(9):2978–2986. doi: 10.1128/iai.59.9.2978-2986.1991. [DOI] [PMC free article] [PubMed] [Google Scholar]
- 16.Gupta R, Rost B, Releveld E, Siber G. Adjuvant Properties of Aluminum and Calcium Compounds. In: Powell M, Newman M, editors. Pharmaceutical Biotechnology. New York: Plenum Press; 1995. pp. 229–248. [DOI] [PubMed] [Google Scholar]
- 17.Lenk T, Horbett T, Ratner B. Infrared Spectroscopic Studies of Time-Dependent Changes in Fibrinogen Adsorbed to Polyurethanes. Langmuir. 1991;7:1755–1764. [Google Scholar]
- 18.Ta T, McDermott M. Mapping Interfacial Chemistry Induced Variations in Protein Adsorption with Scanning Force Microscopy. Analytical Chemistry. 2000;72:2627–2634. doi: 10.1021/ac991137e. [DOI] [PubMed] [Google Scholar]
- 19.Van Tassel P, Guemouli L, Ramsden J, Tarjus G, Viot P, Talbot J. A Particle-Level Model of Irreversible Protein Adsorption with a Post Adsorption Transition. Journal of Colloid and Interface Science. 1998;207:317–323. doi: 10.1006/jcis.1998.5781. [DOI] [PubMed] [Google Scholar]
- 20.Randolph T, Jones L. Surfactant-Protein Interactions. In: Carpenter J, Manning M, editors. Rational Design of Stable Protein Formulations: Theory and Practice. New York: Plenum Press; 2002. pp. 159–175. [Google Scholar]
- 21.Norde W, Giacomelli C. BSA Structural Changes During Homomolecular Exchange Between the Adsorbed and the Dissolved States. Journal of Biotechnology. 2000;79:259–268. doi: 10.1016/s0168-1656(00)00242-x. [DOI] [PubMed] [Google Scholar]
- 22.Norde W, Lyklema J. Why Proteins Prefer Interfaces. Journal of biomaterials science Polymer edition. 1991;2:183–202. doi: 10.1080/09205063.1991.9756659. [DOI] [PubMed] [Google Scholar]
- 23.Estey T, Vessely C, Randolph T, Henderson I, Jones L, Nayar R, Carpenter JF. The Chemical Degradation of a Trivalent Recombinant Protein Vaccine Against Botulinum Neurotoxin by LysC Peptide Mapping and MALDI-TOF Mass Spectrometry. Journal of Pharmaceutical Sciences. doi: 10.1002/jps.21543. Submitted for Publication. [DOI] [PMC free article] [PubMed] [Google Scholar]
- 24.Ragone R, Colonna G, Balestrieri C, Servillo L, Irace G. Determination of Tyrosine Exposures in Proteins by Second-Derivative Spectroscopy. Biochemistry. 1984;23:1871–1875. doi: 10.1021/bi00303a044. [DOI] [PubMed] [Google Scholar]
- 25.Rinella J, White J, Hem S. Effect of Anions on Model Aluminum-Adjuvant-Containing Vaccines. Journal of Colloid and Interface Science. 1995;172(1):121–130. [Google Scholar]
- 26.Jones L, Peek L, Power J, Markham A, Yazzie B, Middaugh C. Effects of Adsorption to Aluminum Salt Adjuvants on the structure and Stability of Model Proteins. Journal of Biological Chemistry. 2005;280(14):13406–13414. doi: 10.1074/jbc.M500687200. [DOI] [PubMed] [Google Scholar]
- 27.Kueltzo L, Ersoy B, Ralston J, Middaugh C. Derivative Absorbance Spectroscopy and Protein Phase Diagrams as Tools for Comprehensive Protein Characterization; A bGCSF Case Study. Journal of Pharmaceutical Sciences. 2003;92(9):1805–1820. doi: 10.1002/jps.10439. [DOI] [PubMed] [Google Scholar]
- 28.Wendorf J, Radke C, Blanch H. Reduced Protein Adsorption at Solid Interfaces by Sugar Excipients. Biotechnology and Bioengineering. 2004;87(5):565–573. doi: 10.1002/bit.20132. [DOI] [PubMed] [Google Scholar]
- 29.Rinella J, Workman R, Hermodson M, White J, Hem S. Elutability of Proteins from Aluminum-Containing Vaccine Adjuvants by Treatment with Surfactant. Journal of Colloid and Interface Science. 1998;197(1):48–56. doi: 10.1006/jcis.1997.5230. [DOI] [PubMed] [Google Scholar]
- 30.Arnebrant T, Wahlgren M. Protein Surfactant Interactions at Solid Surfaces. In: Horbett T, JL B, editors. Proteins at Interfaces II: Fundamentals and Applications. Washington DC: Americal Chemical Society; 1995. pp. 239–255. [Google Scholar]
- 31.McGuire J, Wahlgren M, Arnebrant T. Structural Stability Effects on the Adsorption and Dodecyltrimethylammonium Bromide-Mediated Elutability of Bacteriophage T4 Lysozyme at Silica Surfaces. Journal of Colloid and Interface Science. 1995;170:182–192. [Google Scholar]
- 32.Shi Y, HogenEsch H, Hem S. Change in the Degree of Adsorption of Proteins by Aluminum - Containing Adjuvants Following Exposure to Interstitial Fluid: Freshly Prepared and Aged Model Vaccines. Vaccine. 2002;20:80–85. doi: 10.1016/s0264-410x(01)00313-9. [DOI] [PubMed] [Google Scholar]
- 33.McNay J, Fernandez E. Protein Unfolding During Reversed Phase Chromatography: I. Effect of Surface Properties and Duration of Adsorption. Biotechnology and Bioengineering. 2001;76(3):224–232. doi: 10.1002/bit.10015. [DOI] [PubMed] [Google Scholar]
- 34.Morefield G, Jiang D, Romero-Mendez I, Geahlen R, HogenEsch H, Hem S. Effect of Phosphorylation of Ovalbumin on Adsorption by Aluminum Containing Adjuvants and Elution upon Exposure to Interstitial Fluid. Vaccine. 2005;23:1502–1506. doi: 10.1016/j.vaccine.2004.08.048. [DOI] [PubMed] [Google Scholar]
- 35.Iyer S, HogenEsch H, Hem S. Relationship Between the Degree of Antigen Adsorption of Aluminum Hydroxide Adjuvant in Interstitial Fluid and Antibody Production. Vaccine. 2003;21:1219–1223. doi: 10.1016/s0264-410x(02)00556-x. [DOI] [PubMed] [Google Scholar]
- 36.Lenk J, Ratner B, Gendreau R, Chittur K. IR Spectral Changes of Bovine Serum Albumin Upon Surface Adsorption. Journal of Biomedical Materials Research. 1989;23:549–569. doi: 10.1002/jbm.820230603. [DOI] [PubMed] [Google Scholar]
- 37.Caessens P, de Jongh H, Norde W, Gruppen H. The Adsorption-Induced Secondary Structure of β-Casein and of Distinct Parts of its Sequence in Relation to Foam and Emulsion Properties. Biochimica et Biophysica Acta. 1999;1430(1):73–83. doi: 10.1016/s0167-4838(98)00274-x. [DOI] [PubMed] [Google Scholar]
- 38.Remmele RL, Nightlinger N, Srinivasan S, Gombotz W. Interleukin-1 Receptor (IL-1R) Liquid Formulation Development Using Differential Scanning Calorimetry. Pharmaceutical Research. 1998;15(2):200–208. doi: 10.1023/a:1011902215383. [DOI] [PubMed] [Google Scholar]
- 39.Daly S, Przybycien T, Tilton R. Coverage-dependent Orientation of Lysozyme Adsorbed on Silica. Langmuir. 2003;19(9):3848–3857. [Google Scholar]
- 40.Daly S, Przybycien T, Tilton R. Adsorption of Poly(Ethylene Glycol)-Modified Lysozyme to Silica. Langmuir. 2005;21(4):1328–1337. doi: 10.1021/la048316y. [DOI] [PubMed] [Google Scholar]


