

Abstract
Misalignment of interaural cortical response maps in asymmetric hearing loss evolves from initial gross divergence to near convergence over a 6 month recovery period. The evolution of left primary auditory cortex (AI) interaural frequency map changes is chronicled in squirrel monkeys with asymmetric hearing loss induced by overstimulating the right ear with a 1 kHz tone at 136 dB for 3 h. AI frequency response areas (FRAs), derived from tone bursts presented to the poorer or better hearing ears, are compared at 6, 12, and 24 weeks after acoustic overstimulation. Characteristic frequency (CF) and minimum threshold parameters are extracted from FRAs, and they are used to quantify interaural response map differences. A large interaural CF map misalignment of ΔCF ∼1.27 octaves at 6 weeks after overstimulation decreases substantially to ΔCF ∼0.62 octave at 24 weeks. Interaural cortical threshold map misalignment faithfully reflects peripheral asymmetric hearing loss at 6 and 12 weeks. However, AI threshold map misalignment essentially disappears at 24 weeks, primarily because ipsilateral cortical thresholds have become unexpectedly elevated relative to peripheral thresholds. The findings document that plastic change in central processing of sound stimuli arriving from the nominally better hearing ear may account for progressive realignment of both interaural frequency and threshold maps.
Introduction
Asymmetries in the integrity and function of paired sensory organs, such as eyes and ears, may develop as a consequence of faulty organogenesis, injury, disease, and aging. These peripheral sensory impairments can have profound effects on information processing in the CNS and are often accompanied by reorganization of topographic cortical maps (Kaas et al., 1983; Rauschecker, 2002; Schreiner and Winer, 2007). Delicate interplays and balance among convergent inputs from both peripheral sensors to central stations are critical for establishing full sensory capabilities, including depth perception in vision, and source localization and optimal signal-in-noise detection in audition. In the visual system, explorations of binocular interactions in normal vision and monocular deprivation have been instrumental in revealing fundamental processes that shape central functional organization and reorganization (Hubel and Wiesel, 1963; Wiesel and Hubel, 1963; Hofer et al., 2006). In the auditory system, studies of monaural deprivation from unilateral partial sensorineural hearing loss (SNHL) have unveiled important insights into frequency map reorganization in primary auditory cortex (AI) contralateral to the injured ear (Syka, 2002; Irvine et al., 2006). Orderly tonotopic organization is disrupted and neuronal thresholds are elevated (Robertson and Irvine, 1989; Rajan et al., 1993; Schwaber et al., 1993). In the cross-modality integrated auditory-visual tectal system of the juvenile barn owl, investigations of spatial maps triggered into misalignment through enforcement of altered visual experience with prismatic lenses have chronicled the evolution of adaptive change in the auditory interaural time difference map that ultimately brings about realignment of both sensory maps (Brainard and Knudsen, 1993, 1995; Keuroghlian and Knudsen, 2007). In the adult mammalian auditory cortex, much less is known about consequences and time course of unilateral or asymmetric hearing loss on ipsilateral auditory representation of the better hearing ear. There are no data to evaluate whether single modality sensory-sensory interaural cortical frequency maps that diverge into misalignment as a result of asymmetric partial SNHL might remain in gross misalignment ad infinitum or ultimately converge to realignment through mechanisms of binaural frequency tuning plasticity.
This study seeks to extend and detail understanding of cortical plasticity dynamics in asymmetric SNHL by introducing quantitative metrics to assess the significance of apparent neuronal plastic change, placing the acoustic lesion at the center of the squirrel monkey AI map on the temporal gyrus (Cheung et al., 2001; Cheung, 2005) to capture the response properties of neighboring lower and higher frequencies, and measuring the frequency response area (FRA) tuning curves for poorer and better hearing ears at 6, 12, and 24 weeks after hearing loss induction to define the temporal evolution of binaural cortical reorganization.
Materials and Methods
Hearing loss and recording procedures.
Experiments were conducted using 12 young adult squirrel monkeys, 3 in the control group and 9 in the study group (3 monkeys in each of three recovery time periods), in accordance with approved institutional protocols at the Veterans Affairs Medical Center and University of California at San Francisco. Anesthesia was induced with an inhalation mixture of isoflurane/nitrous oxide/oxygen (2:48:50%) to reach a surgical plane. The airway was protected with endotracheal intubation; the cardiovascular system was supported with normal saline with 1.5% dextrose and 20 mEq KCl delivered at 6–8 ml/kg/h, and core temperature was maintained at ∼38°C.
Asymmetric hearing loss induction procedures directed at the right ear of all study monkeys were performed under general anesthesia in a closed sound-attenuating chamber (Industrial Acoustics Company) fitted with a video surveillance system. Eardrums appeared normal before and after procedures. A sine wave oscillator (1396-A; General Radio Company) generated a continuous 1 kHz signal used for acoustic overstimulation at 136 dB sound pressure level (SPL) for 3 h in study monkeys. A power amplifier (MA2400; Crown Audio) conditioned the 1 kHz input signal for sound delivery through a single high-performance midrange driver (M4; Community Professional Loudspeakers) that was positioned 2–2.25 inches away from the tragus, in direct line with the external auditory meatus. The 1 kHz tone intensity level at the entry of the right lateral ear canal was measured with a sound meter (2209; Brüel and Kjær). The left ear was protected by inserting an occlusive foam earplug (E-A-R Classic; Aearo Corporation) into the external auditory meatus. Sound attenuation conferred by the E-A-R insert was rated to be 23 dB at 1 kHz by the manufacturer and the National Acoustics Laboratories (Sydney, NSW, Australia). Thereafter, the left concha cavum was packed with cotton pledgets soaked in mineral oil to further occlude the entry of the lateral auditory meatus. The latter procedure provided unknown added acoustic protection beyond the 23 dB conferred by the foam earplug.
Tone bursts were used to determine auditory brainstem (ABR) thresholds (linear rise/fall 1 ms, total duration 17 ms, interstimulus interval 35 ms; 0.5, 1, 2, 3, 4, 6, and 8 kHz) and cortical FRAs [linear rise/fall 3 ms, total duration 50 ms, interstimulus interval 400 ms; 675 presented in pseudorandom order from 2.5 to 77.5 dB SPL in 5 dB steps centered on the neuron's estimated characteristic frequency (CF)] that were generated by a microprocessor (TMS32010; Texas Instruments; 16-bit analog-to-digital converter at 120 kHz). Stimuli for ABR recordings were delivered through a single STAX-54 headphone enclosed in a small chamber that was connected via a sealed tube into the external auditory canal [Sokolich G (1981) U.S. Patent 4251686]. Two STAX-54 headphones, one for contralateral and one for ipsilateral ear stimulation, were used for left AI mapping experiments. Frequency response of the sound delivery system was measured with a sound meter (Brüel and Kjær 2209) and a waveform analyzer (General Radio 1521-B), and determined to be flat within 6 dB up to 14 kHz; the frequency response rolled off at 10 dB/octave above 14 kHz. The two headphones were calibrated before and after cortical recording experiments, and were within ±2 dB from 0.5 to 16 kHz measured at one octave intervals.
ABR waveforms were recorded at the time of electrophysiological brain mapping procedures to construct tone-specific audiograms. Silver wire electrodes were placed at the retroauricular sulci of the two pinnae (active and ground) and at the skull vertex (indifferent). Two hundred to 400 repetitions of each frequency were delivered for triggered waveform averaging. Response waveforms were bandpass filtered from 0.3 to 3 kHz, amplified, and digitized within a 15 ms window. ABR thresholds were determined interactively for specific frequencies by two individuals, an ABR threshold evaluator and an electrophysiological experimenter. Neither was blinded to the condition of the animal or the ear stimulated. The evaluator made threshold determinations while the experimenter increased and decreased sound pressure levels in 2–5 dB steps that were unknown to the evaluator. ABR thresholds were determined visually at the time of ABR waveform collection by notation of the lowest sound level at which the ABR wave I complex became indistinguishable from background noise (Fig. 1, arrow indicates threshold). Typically, background noise waveforms were recorded at least 20 dB below the ABR threshold.
Figure 1.

ABR waveforms for threshold determination at 2 kHz. A, Left ear. B, Right ear. Arrows indicate threshold.
Electrophysiological brain-mapping procedures were performed under pentobarbital anesthesia. After craniotomy, dura was reflected and the brain was kept moist under a layer of silicone oil. The parietal operculum was removed in normal monkey sm64 (left and right) to perform visually guided mapping procedures in AI on the suprameatal plane. No other normal or study monkey underwent corticectomy. A magnified video image of the recording zone was captured with a camera and stored in a microcomputer for documenting electrode positions. Multiunit neuronal recordings at depths of 550–850 μm, corresponding to cortical layers III and IV, were performed using Parylene-coated tungsten microelectrodes (FHC) with 1–2 MΩ impedance at 1 kHz. Within a vertical column, the electrode track site in which the neuronal cluster responded to both ipsilateral and contralateral ear stimulation was chosen, whenever possible. Only one site was studied in detail per penetration. On occasion, cortical neurons were activated exclusively by either ipsilateral or contralateral stimulus presentation despite a thorough search along the targeted depth range. In those cases, a comparison of responses between ipsilateral and contralateral stimulation was not possible. Action potentials were isolated from background noise using an on-line window discriminator (DIS-1; BAK). The arrival times of discriminated spikes that occurred within 50 ms after each tone burst onset were recorded digitally.
Data analysis.
FRA tuning curves were analyzed for response parameters CF and minimum threshold (hereafter, “threshold”). CF was the frequency of the quietest tone that evoked a response at threshold. Neuronal clusters recorded at the majority of recording sites responded to both contralateral and ipsilateral input. At those sites, CF and threshold differences between the two ears were computed using the following formulae: CF difference (octaves) = log2(CFcontra/CFipsi) and threshold difference (dB) = contralateral − ipsilateral threshold.
CF and threshold response profiles were referenced to the ipsilateral CF and segmented into single octave frequency bands for finer grain analysis. Data were organized in contingency tables with frequency band categories <0.5, 0.5–1, 1–2, 2–4, 4–8, and >8 kHz occupying rows. Tukey (Cleveland, 1993) box plots summarized data for visual inspection. The median was represented by a solid line within the box. First and third quartiles were marked by lower and upper ends of the box. The t and χ2 tests, and one-way ANOVA were used to evaluate for difference between groups, among categories, and across cohorts, respectively.
Covariations among specific peripheral ABR audiometric and central FRA measures were evaluated. First, the absolute interaural difference in ABR threshold was compared with the maximum interaural difference in CF. The absolute interaural threshold difference at each ABR audiogram frequency was plotted against the maximum absolute difference in CF among cortical sites whose ipsilateral CFs were within ±¼ octave of the ABR audiogram frequency. Data from all three monkeys at each recovery time period were pooled. Second, left and right ear ABR thresholds were compared with minimum cortical thresholds. For the left and right ears, the threshold at each ABR audiogram frequency was plotted against the minimum threshold among cortical sites whose corresponding CFs were within ±¼ octave of the ABR audiogram frequency. Data from both ears for each monkey were pooled for panels shown in Figure 9. Linear regression models were fitted to the data above and tested for statistical significance at the p < 0.05 level. It should be noted that the covariation analysis does not take into account possible interdependence among data points. Such interdependency may or may not be a source of materially important bias.
Figure 9.

Relationship between minimum cortical and corresponding ABR thresholds for both ears in individual study monkeys. 6 Weeks and 12 Weeks, Linear regression fits (p < 0.05) show strong correlation (r > 0.74) for five of six study monkeys. 24 Weeks, Linear regression fits are not significant (p > 0.05) for all three study monkeys.
Results
Asymmetric sensorineural hearing loss induction
Acoustic overstimulation with a continuous 1 kHz tone at 136 dB for 3 h directed at the right ear induces asymmetric SNHL. The better hearing ear is the left. Figure 2 shows ABR tone-specific audiograms for study monkeys at the 6, 12, and 24 week recovery time periods. Ranges of thresholds for the right (gray square) and left (gray diamond) ears at each frequency derived from 13 normal young adult monkeys unrelated to this study are ghosted in the background for reference. The mean range of threshold variations from 0.5 to 8 kHz is ∼20 dB [right, 22 (5) dB, left, 20 (4) dB; mean (SD)]. All better (protected) hearing ears of study monkeys fall into the threshold range of normal monkeys. Overall hearing loss asymmetry in study monkeys is mild, with the right ear generally no poorer than 20 dB relative to the left. Specific patterns of hearing loss are idiosyncratic to individual monkeys.
Figure 2.

ABR audiograms for study monkeys after acoustic overstimulation with a 1 kHz tone at 136 dB for 3 h directed at the right ear. Overall mild asymmetric sensorineural hearing loss. Gray symbols (square, right ear; diamond, left ear) are thresholds for normal monkeys.
Empirical interaural difference distributions in normal monkeys
AI multiunit extracellular mapping experiments in four hemispheres of three normal monkeys (sm10, sm82 and sm64L, sm64R) provide control data to establish empirical distributions of interaural CF and threshold differences for determining upper and lower α/2 = 0.025 cutoff values, which are used to identify penetration sites in study monkeys that are significantly different (p < 0.05) from those in normal monkeys.
Figure 3A shows CFs (range, 0.3–22.9 kHz) determined from contralateral and ipsilateral ear stimulation in normal monkeys to be highly correlated (r = 0.99, p < 0.01). Figure 3B shows the CF difference (contra − ipsi) distribution, with triangles marking the CF empirical significance cutoff values for the upper (+0.63 octave) and lower (−0.27 octave) tails (α/2 = 0.025) of the distribution. Asymmetric CF cutoff values may be attributable to the CF being consistently slightly higher when stimulated by the contralateral ear compared with the ipsilateral ear or random effects secondary to idiosyncratic neuronal sampling specific to this study. CF derived from contralateral stimulation is slightly higher [0.06 (0.23) octave, difference mean (SD); p < 0.01]. The significance of interaural CF asymmetry in normal monkeys is unlikely to be physiologically meaningful because the mean difference is small and well within the error interval of the data extraction procedure. Figure 3, C and D, shows scatter plots of contralateral and ipsilateral cortical thresholds, respectively, with a behavioral audiogram (Green, 1975) superimposed and connected by solid lines. For frequencies below 8 kHz, the very lowest cortical thresholds are in close proximity to behavioral thresholds. For frequencies above 8 kHz, there is undersampling of AI. Neuronal sites with CF >5 kHz are mostly within the suprameatal plane (Cheung et al., 2001; Cheung, 2005), which is inaccessible for visually guided mapping of layer III or IV neurons without removal of the parietal operculum. Although the contours of minimum cortical and behavioral thresholds (Fig. 3C,D) are qualitatively similar to minimum ABR thresholds (Fig. 2), the latter are quantitatively 10–20 dB higher. Similar results have been reported in monkeys (Kamada et al., 1991; Lasky et al., 1999) and humans (Stapells et al., 1990). Figure 3E shows broad variations in the relationship between contralateral and ipsilateral cortical thresholds (r = 0.67, p < 0.01). The distribution of threshold differences (contra − ipsi) is shown in Figure 3F, with triangles marking the threshold empirical significance cutoff values for the upper (+18.4 dB) and lower (−24.8 dB) tails (α/2 = 0.025). Asymmetric threshold cutoff values are consistent with dominance of contralateral ear stimulation to drive cortical activity at the lowest thresholds (Benson and Teas, 1976). Furthermore, suprathreshold stimulation data indicate the ability of the contralateral ear to evoke the strongest cortical responses (Imig and Adrian, 1977; Semple and Kitzes, 1993). Accordingly, threshold derived from contralateral stimulation is slightly lower [−3.4 (9.8) dB, difference mean (SD); p < 0.01]. The cutoff tail values derived from empirical distributions of CF and threshold differences in normal monkeys serve as metrics to assess significance of differences observed in acoustically overstimulated study monkeys.
Figure 3.

Characteristic frequency and threshold data for contralateral versus ipsilateral ear input from four cortices in three normal squirrel monkeys. A, Relationship between ipsilateral and contralateral CFs. R, Right AI; L, left AI. Inset, Squirrel monkey brain caricature. The general recording area for AI on the temporal gyrus is ventral to the lateral sulcus and 4–8 mm rostral to the interaural line (dotted). AI varies in its rostral-caudal location and size on the temporal gyrus. r, Rostral; c, caudal; v, ventral; d, dorsal. B, CF difference distribution in octaves. C, D, Population contralateral and ipsilateral neuronal thresholds superimposed on behavioral thresholds by Green (1975). The lowest neuronal thresholds are in close proximity to behavioral thresholds. For CF >8 kHz, neuronal sampling is more sparse. E, Relationship between ipsilateral and contralateral thresholds. F, Threshold difference distribution in decibels. Solid triangles mark upper and lower tail limits for α/2 = 0.025 for both empirical distributions. r = correlation coefficient. Sample size is in parentheses.
Characteristic frequency
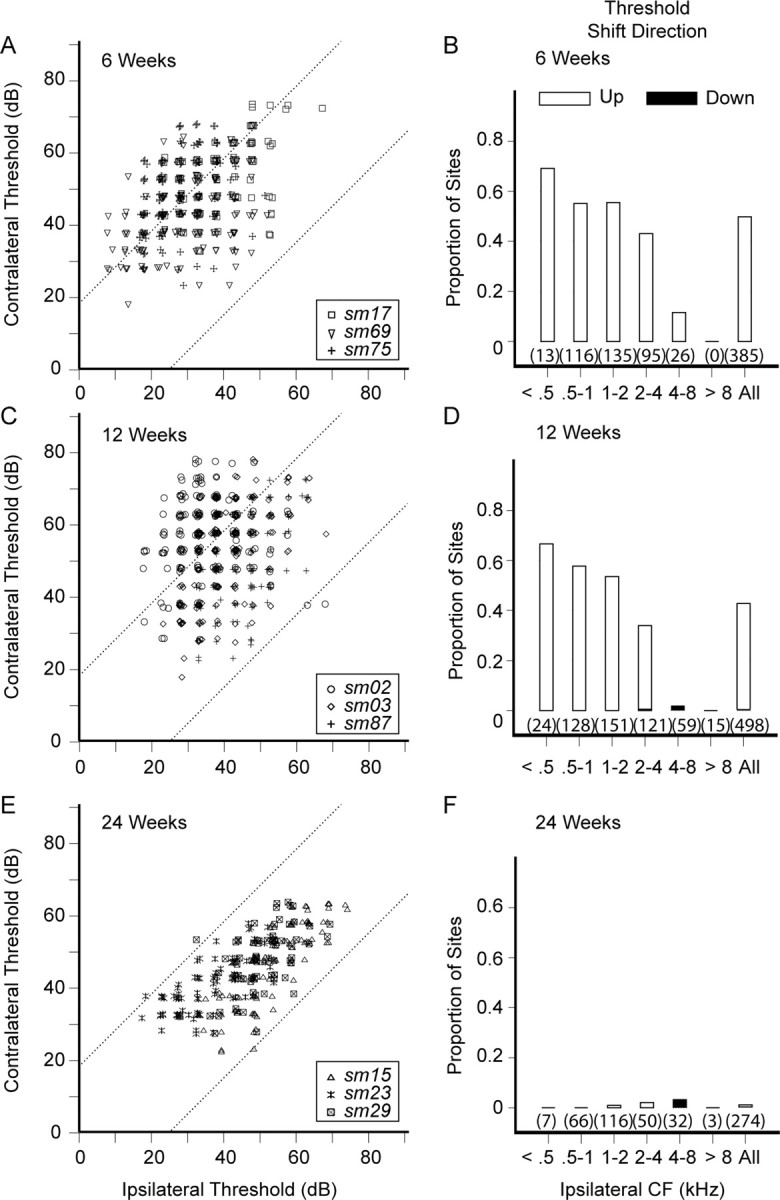
Asymmetric hearing loss results in frequency misalignment of interaural maps in AI. Figure 4 displays interaural CF map alignment, variations among monkeys, and shift direction profiles for contralateral versus ipsilateral input at 6, 12, and 24 weeks after acoustic overstimulation. Interaural CF misalignment at 6 and 12 weeks recovery (Fig. 4A,D) is mostly shifted to higher contralateral values (CF shift up) that are within ∼1 octave of the corresponding ipsilateral CF at 1 kHz. Interaural CF misalignment at 24 weeks recovery (Fig. 4G) is much less pronounced and mostly shifted to lower contralateral values (CF shift down) that are just outside the lower cutoff mark. Tukey box plots of interaural CF misalignment distributions for all three recovery time periods show extended upper and/or lower tails compared with the control group (data from Fig. 3B). CF shift up and CF shift down neurons are accounted for at the tails of study cohort misalignment distributions. At 6 weeks (Fig. 4B), monkey sm75 exhibits the largest deviation away from the control group median CF difference (∼0 dB) and is the largest contributor to both extended tails of the overall study group (“All”) distribution. Monkey sm17 contributes principally to the CF shift down tail, whereas monkey sm69 contributes mostly to the CF shift up tail. At 12 weeks, all three monkeys contribute evenly to both extended tails. At 24 weeks, all three monkeys also contribute evenly to both extended tails, but the CF shift down tail predominates. The proportion of sites exhibiting CF shift, up or down, is similar (∼30%) for all three recovery time periods (Fig. 4C,F,I, far right bar labeled All). The main distinguishing feature among study groups is the drop in proportion of sites with CF shift up, from ∼20% at 6 and 12 weeks to ∼10% at 24 weeks. Figure 4C, F, and I, provides a finer grain accounting of CF shift direction by organizing data into single octave bands from 0.5 to 8 kHz. Neuronal units with ipsilateral CF from 0.5 to 4 kHz constitute the bulk of the data. Total sample size for a specific band is indicated by the number inside the parentheses. In summary, the evolution of interaural frequency maps in the hemisphere contralateral to the poorer hearing ear progresses from gross divergence at 6 and 12 weeks to near convergence at 24 weeks after acoustic overstimulation. Whereas the overall proportion of sites exhibiting CF change remains constant at 30%, the subset of sites with CF shift up declines from 20% to 10%.
Figure 4.

Characteristic frequency for contralateral versus ipsilateral ear input in squirrel monkeys with mild asymmetric hearing loss. A, D, G, The 6, 12, and 24 week recovery time periods. Interaural CF misalignment is evident. There is a reversal of shift direction from mostly higher values (CF shift up) at 6 and 12 weeks to lower values (CF shift down) at 24 weeks. Dotted lines indicate boundaries of the 95% confidence interval derived from empirical difference distributions. B, E, H, CF misalignment variations among monkeys in each study group. Tukey box plots show extended upper and/or lower tails in study monkeys that account for CF shift up and CF shift down neurons. At 6 weeks, monkey sm75 is the largest contributor to the group's extended tails. At 12 weeks, all three monkeys contribute evenly to both extended tails. At 24 weeks, all three monkeys also contribute evenly to both extended tails, but the CF shift down tail predominates. C, F, I, Proportion of sites showing either CF shift up or shift down for each study group. Data have been segmented to single octave bands referenced to the ipsilateral CF. The total proportion of sites showing interaural CF difference is ∼30% for all three recovery time periods, but the dominant direction of CF shift reverses at 24 weeks. Sample size is in parentheses.
Minimum threshold
Asymmetric hearing loss results in misalignment of interaural intensity preferences in AI. Figure 5 shows AI neuronal threshold distribution profiles for contralateral versus ipsilateral input at 6, 12, and 24 weeks after acoustic overstimulation. Over 40% of contralateral thresholds at 6 and 12 weeks are higher than expected (p < 0.05) relative to corresponding ipsilateral thresholds (Fig. 5A–D), an anticipated consequence of acoustic overstimulation directed at the right ear. When the data are sorted along single octave bands ranging from 0.5 to 8 kHz, the proportion of sites with threshold shift up takes on a low-pass filter configuration. The very lowest frequency bands have the highest proportion of sites with threshold shift up, in general accordance with study monkey ABR audiograms (Fig. 2). Remarkably, virtually all contralateral–ipsilateral threshold pairs fall within the 95% confidence interval (Fig. 5E,F) at 24 weeks, an unanticipated finding that is predominantly a consequence of unexpected elevations of ipsilateral neuronal thresholds. Figure 6 shows ipsilateral and contralateral cortical threshold Tukey box plots for normal and study monkey groups segmented by single octave bands referenced to the ipsilateral CF. Control data threshold box plots are colored gray to provide reference values for comparisons. Sample size is in parentheses. At 6 and 12 weeks, contralateral cortical thresholds are elevated, whereas ipsilateral thresholds are not, except for the 4–8 kHz band at 12 weeks (p < 0.01, single tail t test). At 24 weeks, both contralateral and ipsilateral cortical thresholds are elevated. When compared with that at 6 weeks, the 24 week mean contralateral threshold is 2.7 dB lower [47.7 (11.1), 6 weeks; 53.5 (12.4), 12 weeks; 45.0 (9.8), 24 weeks; mean (SD); p < 0.01, ANOVA], but the mean ipsilateral threshold is 15.3 dB higher [31.7 (10.8), 6 weeks; 39.2 (9.2), 12 weeks; 47.0 (11.9); mean (SD); p < 0.01, ANOVA]. Hence, interaural AI neuronal threshold difference maps undergo temporal evolution. Elevation of ipsilateral cortical threshold appears to be the primary factor effecting reduction in threshold difference at the 24 week recovery period. At 6 and 12 weeks after unilaterally directed acoustic overstimulation, contralateral thresholds are higher than ipsilateral thresholds; the direction of interaural threshold difference is almost exclusively shifted to higher values. By 24 weeks, the threshold differences are eliminated because ipsilateral cortical thresholds have unexpectedly elevated at this later time period.
Figure 5.
Threshold for contralateral versus ipsilateral ear input in squirrel monkeys with mild asymmetric hearing loss. A, C, E, The 6, 12, and 24 week recovery time periods. Threshold shift direction is almost exclusively to higher values (threshold shift up) at 6 and 12 weeks, an expected result from asymmetric injury to the auditory periphery. Threshold shift becomes inapparent by 24 weeks, an unexpected finding. B, D, F, Corresponding recovery time periods for the proportion of sites showing either threshold shift up or shift down. Data have been segmented to single octave bands referenced to the ipsilateral CF. The total proportion of sites showing interaural threshold difference is ∼45% for 6 and 12 weeks, but drops to <1% by 24 weeks. Sample size is in parentheses.
Figure 6.
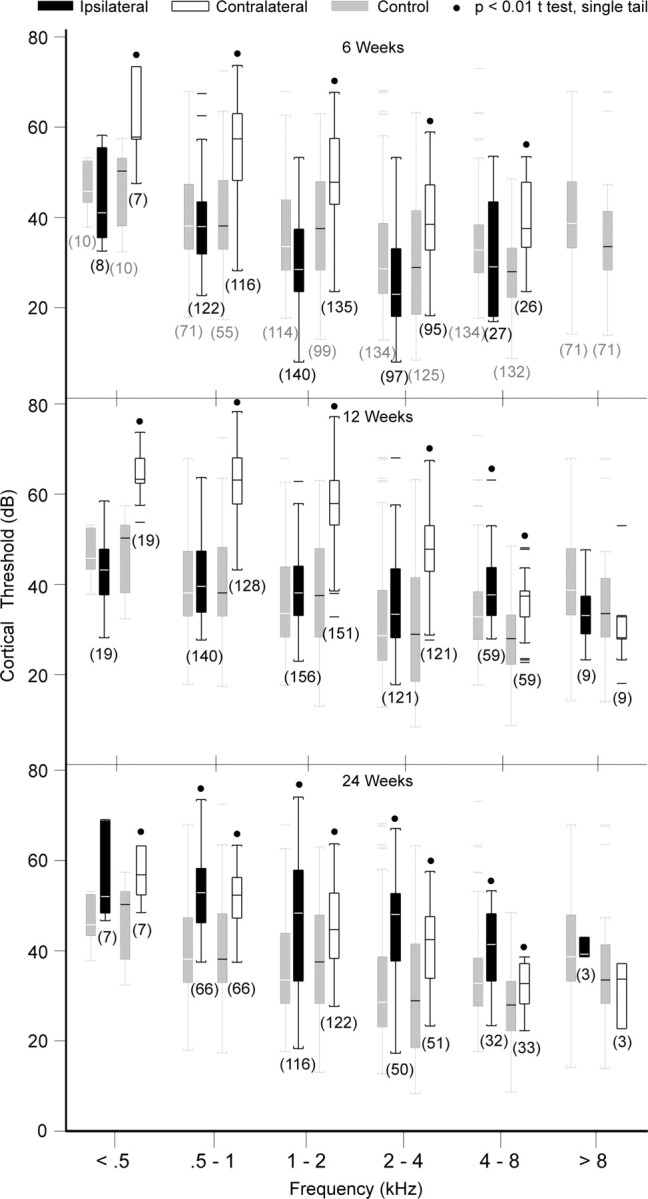
Cortical threshold Tukey box plots for squirrel monkeys with mild asymmetric hearing loss segmented by single octave ipsilateral CF bands. 6 Weeks and 12 Weeks, Contralateral thresholds are elevated, whereas ipsilateral thresholds are indistinguishable from controls for ipsilateral CF <4 kHz. 24 Weeks, Both contralateral and ipsilateral thresholds are elevated.
Disaggregate CF and threshold shift data sets
Tables 1, 2, and 3 provide detailed accounting of CF and threshold shift contributions by individual monkeys for recovery periods 6, 12, and 24 weeks, respectively. The tables are organized by segmenting data into single octave bands referenced to the ipsilateral CF. At 6 weeks, monkey sm75 is the largest contributor to CF shift, up or down, with ∼54% of penetration sites showing statistically significant change (p < 0.05, empirical distribution). Monkeys sm17 and sm69 also contribute to CF shift, but to lesser degrees (∼20% and ∼14%). The overall rate of CF shift at 6 weeks is ∼30%. The overall rate of threshold shift up is ∼50%.
Table 1.
Six week recovery period disaggregated CF and threshold shifts
| Six week frequency band | CF shift |
Percentage |
N | Threshold shift |
Percentage |
||||
|---|---|---|---|---|---|---|---|---|---|
| Up | Down | Up | Down | Up | Down | Up | Down | ||
| < 0.5 kHz | |||||||||
| sm17 | 0 | 0 | 0.0 | 0.0 | 2 | 1 | 0 | 50.0 | 0.0 |
| sm69 | 1 | 0 | 100.0 | 0.0 | 1 | 0 | 0 | 0.0 | 0.0 |
| sm75 | 0 | 2 | 0.0 | 20.0 | 10 | 8 | 0 | 80.0 | 0.0 |
| Subtotal | 1 | 2 | 7.7 | 15.4 | 13 | 9 | 0 | 69.2 | 0.0 |
| 0.5–1 kHz | |||||||||
| sm17 | 4 | 3 | 12.5 | 9.4 | 32 | 18 | 0 | 56.3 | 0.0 |
| sm69 | 6 | 2 | 14.6 | 4.9 | 41 | 22 | 0 | 53.7 | 0.0 |
| sm75 | 25 | 8 | 58.1 | 18.6 | 43 | 24 | 0 | 55.8 | 0.0 |
| Subtotal | 35 | 13 | 30.2 | 11.2 | 116 | 64 | 0 | 55.2 | 0.0 |
| 1–2 kHz | |||||||||
| sm17 | 7 | 4 | 18.4 | 10.5 | 38 | 26 | 0 | 68.4 | 0.0 |
| sm69 | 5 | 1 | 9.3 | 1.9 | 54 | 23 | 0 | 42.6 | 0.0 |
| sm75 | 31 | 1 | 72.1 | 2.3 | 43 | 26 | 0 | 60.5 | 0.0 |
| Subtotal | 43 | 6 | 31.9 | 4.4 | 135 | 75 | 0 | 55.6 | 0.0 |
| 2–4 kHz | |||||||||
| sm17 | 0 | 1 | 0.0 | 5.0 | 20 | 6 | 0 | 30.0 | 0.0 |
| sm69 | 0 | 5 | 0.0 | 11.6 | 43 | 11 | 0 | 25.6 | 0.0 |
| sm75 | 7 | 1 | 21.9 | 3.1 | 32 | 24 | 0 | 75.0 | 0.0 |
| Subtotal | 7 | 7 | 7.4 | 7.4 | 95 | 41 | 0 | 43.2 | 0.0 |
| 4–8 kHz | |||||||||
| sm17 | 0 | 3 | 0.0 | 21.4 | 14 | 0 | 0 | 0.0 | 0.0 |
| sm69 | 0 | 0 | 0.0 | 0.0 | 0 | 0 | 0 | 0.0 | 0.0 |
| sm75 | 0 | 1 | 0.0 | 8.3 | 12 | 3 | 0 | 25.0 | 0.0 |
| Subtotal | 0 | 4 | 0.0 | 15.4 | 26 | 3 | 0 | 11.5 | 0.0 |
| >8 kHz | |||||||||
| sm17 | 0 | 0 | 0.0 | 0.0 | 0 | 0 | 0 | 0.0 | 0.0 |
| sm69 | 0 | 0 | 0.0 | 0.0 | 0 | 0 | 0 | 0.0 | 0.0 |
| sm75 | 0 | 0 | 0.0 | 0.0 | 0 | 0 | 0 | 0.0 | 0.0 |
| Subtotal | 0 | 0 | 0.0 | 0.0 | 0 | 0 | 0 | 0.0 | 0.0 |
| All bands | |||||||||
| Total | 86 | 32 | 22.3 | 8.3 | 385 | 192 | 0 | 49.9 | 0.0 |
| Monkey | |||||||||
| sm17 | 11 | 11 | 10.4 | 10.4 | 106 | 51 | 0 | 48.1 | 0.0 |
| sm69 | 12 | 8 | 8.6 | 5.8 | 139 | 56 | 0 | 40.3 | 0.0 |
| sm75 | 63 | 13 | 45.0 | 9.3 | 140 | 85 | 0 | 60.7 | 0.0 |
N, Sample size.
Table 2.
Twelve week recovery period disaggregated CF and threshold shifts
| 12 week frequency band | CF shift |
Percentage |
N | Threshold shift |
Percentage |
||||
|---|---|---|---|---|---|---|---|---|---|
| Up | Down | Up | Down | Up | Down | Up | Down | ||
| <0.5 kHz | |||||||||
| sm02 | 0 | 0 | 0.0 | 0.0 | 1 | 1 | 0 | 100.0 | 0.0 |
| sm03 | 0 | 1 | 0.0 | 5.0 | 20 | 14 | 0 | 70.0 | 0.0 |
| sm87 | 0 | 0 | 0.0 | 0.0 | 3 | 1 | 0 | 33.3 | 0.0 |
| Subtotal | 0 | 1 | 0.0 | 4.2 | 24 | 16 | 0 | 66.7 | 0.0 |
| 0.5–1 kHz | |||||||||
| sm02 | 11 | 10 | 22.0 | 20.0 | 50 | 40 | 0 | 80.0 | 0.0 |
| sm03 | 25 | 8 | 39.7 | 12.7 | 63 | 34 | 0 | 54.0 | 0.0 |
| sm87 | 0 | 1 | 0.0 | 6.7 | 15 | 0 | 0 | 0.0 | 0.0 |
| Subtotal | 36 | 19 | 28.1 | 14.8 | 128 | 74 | 0 | 57.8 | 0.0 |
| 1–2 kHz | |||||||||
| sm02 | 14 | 4 | 24.6 | 7.0 | 57 | 39 | 0 | 68.4 | 0.0 |
| sm03 | 21 | 5 | 33.9 | 8.1 | 62 | 30 | 0 | 48.4 | 0.0 |
| sm87 | 6 | 17 | 18.8 | 53.1 | 32 | 12 | 0 | 37.5 | 0.0 |
| Subtotal | 41 | 26 | 27.2 | 17.2 | 151 | 81 | 0 | 53.6 | 0.0 |
| 2–4 kHz | |||||||||
| sm02 | 0 | 1 | 0.0 | 2.2 | 46 | 27 | 1 | 58.7 | 2.2 |
| sm03 | 4 | 1 | 9.8 | 2.4 | 41 | 9 | 0 | 22.0 | 0.0 |
| sm87 | 9 | 1 | 26.5 | 2.9 | 34 | 4 | 0 | 11.8 | 0.0 |
| Subtotal | 13 | 3 | 10.7 | 2.5 | 121 | 40 | 1 | 33.1 | 0.8 |
| 4–8 kHz | |||||||||
| sm02 | 0 | 1 | 0.0 | 20.0 | 5 | 0 | 1 | 0.0 | 20.0 |
| sm03 | 0 | 1 | 0.0 | 5.3 | 19 | 0 | 0 | 0.0 | 0.0 |
| sm87 | 0 | 0 | 0.0 | 0.0 | 35 | 0 | 0 | 0.0 | 0.0 |
| Subtotal | 0 | 2 | 0.0 | 3.4 | 59 | 0 | 1 | 0.0 | 1.7 |
| >8 kHz | |||||||||
| sm02 | 0 | 0 | 0.0 | 0.0 | 0 | 0 | 0 | 0.0 | 0.0 |
| sm03 | 0 | 0 | 0.0 | 0.0 | 8 | 0 | 0 | 0.0 | 0.0 |
| sm87 | 0 | 0 | 0.0 | 0.0 | 7 | 0 | 0 | 0.0 | 0.0 |
| Subtotal | 0 | 0 | 0.0 | 0.0 | 15 | 0 | 0 | 0.0 | 0.0 |
| All bands | |||||||||
| Total | 90 | 51 | 18.1 | 10.2 | 498 | 211 | 2 | 42.4 | 0.4 |
| Monkey | |||||||||
| sm02 | 25 | 16 | 15.7 | 10.1 | 159 | 107 | 2 | 67.3 | 1.3 |
| sm03 | 50 | 16 | 23.5 | 7.5 | 213 | 87 | 0 | 40.8 | 0.0 |
| sm87 | 15 | 19 | 11.9 | 15.1 | 126 | 17 | 0 | 13.5 | 0.0 |
N, Sample size.
Table 3.
Twenty-four week recovery period disaggregated CF and threshold shifts
| 24 week frequency band | CF shift |
Percentage |
N | Threshold shift |
Percentage |
||||
|---|---|---|---|---|---|---|---|---|---|
| Up | Down | Up | Down | Up | Down | Up | Down | ||
| < 0.5 kHz | |||||||||
| sm15 | 1 | 0 | 50.0 | 0.0 | 2 | 0 | 0 | 0.0 | 0.0 |
| sm23 | 0 | 1 | 0.0 | 20.0 | 5 | 0 | 0 | 0.0 | 0.0 |
| sm29 | 0 | 0 | 0.0 | 0.0 | 0 | 0 | 0 | 0.0 | 0.0 |
| Subtotal | 1 | 1 | 14.3 | 14.3 | 7 | 0 | 0 | 0.0 | 0.0 |
| 0.5–1 kHz | |||||||||
| sm15 | 5 | 6 | 29.4 | 35.3 | 17 | 0 | 0 | 0.0 | 0.0 |
| sm23 | 3 | 5 | 16.7 | 27.8 | 18 | 0 | 0 | 0.0 | 0.0 |
| sm29 | 3 | 2 | 9.7 | 6.5 | 31 | 0 | 0 | 0.0 | 0.0 |
| Subtotal | 11 | 13 | 16.7 | 19.7 | 66 | 0 | 0 | 0.0 | 0.0 |
| 1–2 kHz | |||||||||
| sm15 | 1 | 4 | 2.8 | 11.1 | 36 | 0 | 0 | 0.0 | 0.0 |
| sm23 | 4 | 16 | 8.7 | 34.8 | 46 | 1 | 0 | 2.2 | 0.0 |
| sm29 | 3 | 12 | 8.8 | 35.3 | 34 | 0 | 0 | 0.0 | 0.0 |
| Subtotal | 8 | 32 | 6.9 | 27.6 | 116 | 1 | 0 | 0.9 | 0.0 |
| 2–4 kHz | |||||||||
| sm15 | 1 | 4 | 4.2 | 16.7 | 24 | 0 | 0 | 0.0 | 0.0 |
| sm23 | 0 | 4 | 0.0 | 26.7 | 15 | 0 | 0 | 0.0 | 0.0 |
| sm29 | 2 | 2 | 18.2 | 18.2 | 11 | 1 | 0 | 9.1 | 0.0 |
| Subtotal | 3 | 10 | 6.0 | 20.0 | 50 | 1 | 0 | 2.0 | 0.0 |
| 4–8 kHz | |||||||||
| sm15 | 0 | 1 | 0.0 | 4.3 | 23 | 0 | 1 | 0.0 | 4.3 |
| sm23 | 0 | 1 | 0.0 | 12.5 | 8 | 0 | 0 | 0.0 | 0.0 |
| sm29 | 0 | 1 | 0.0 | 100.0 | 1 | 0 | 0 | 0.0 | 0.0 |
| Subtotal | 0 | 3 | 0.0 | 9.4 | 32 | 0 | 1 | 0.0 | 3.1 |
| >8 kHz | |||||||||
| sm15 | 0 | 1 | 0.0 | 33.3 | 3 | 0 | 0 | 0.0 | 0.0 |
| sm23 | 0 | 0 | 0.0 | 0.0 | 0 | 0 | 0 | 0.0 | 0.0 |
| sm29 | 0 | 0 | 0.0 | 0.0 | 0 | 0 | 0 | 0.0 | 0.0 |
| Subtotal | 0 | 1 | 0.0 | 33.3 | 3 | 0 | 0 | 0.0 | 0.0 |
| All bands | |||||||||
| Total | 23 | 60 | 8.4 | 21.9 | 274 | 2 | 1 | 0.7 | 0.4 |
| Monkey | |||||||||
| sm15 | 8 | 16 | 7.6 | 15.2 | 105 | 0 | 1 | 0.0 | 1.0 |
| sm23 | 7 | 27 | 7.6 | 29.3 | 92 | 1 | 0 | 1.1 | 0.0 |
| sm29 | 8 | 17 | 10.4 | 22.1 | 77 | 1 | 0 | 1.3 | 0.0 |
N, Sample size.
At 12 weeks, monkeys sm02, sm03, and sm87 have similar rates of aggregate CF shift, up or down, at ∼28%. Monkey sm87 departs from sm02 and sm03, and all monkeys at 6 weeks because its rate of CF shift down is slightly higher than CF shift up (15.1% vs 11.9%). In all other monkeys at 6 and 12 weeks, the rate of CF shift up is at or higher than CF shift down. Threshold shift up remains dominant in all three monkeys, but sm87 has a much lower rate (13.5%). The overall rate of threshold shift up is ∼42%.
At 24 weeks, monkeys sm15, sm23, and sm27 contribute relatively evenly to the overall aggregate CF shift rate at ∼30%. For all monkeys at 24 weeks, there are two important differences when comparing rates of CF and threshold shifts to results at 6 and 12 weeks. First, the rate of CF shift down is at least twice that of CF shift up. Second, the overall rate of threshold shift is below 1%. Those two distinctions demarcate the 24 week recovery period as clearly separate from earlier recovery periods.
CF and threshold shifts rates and CF shift magnitude
The rate of CF shift, up or down, is ∼30% for all three recovery time periods (p > 0.05, χ2). In contrast, the rate of threshold shift is comparable (∼45%) for 6 and 12 weeks, but declines to <1% at 24 weeks (Fig. 7A, p < 0.01, χ2).
Figure 7.
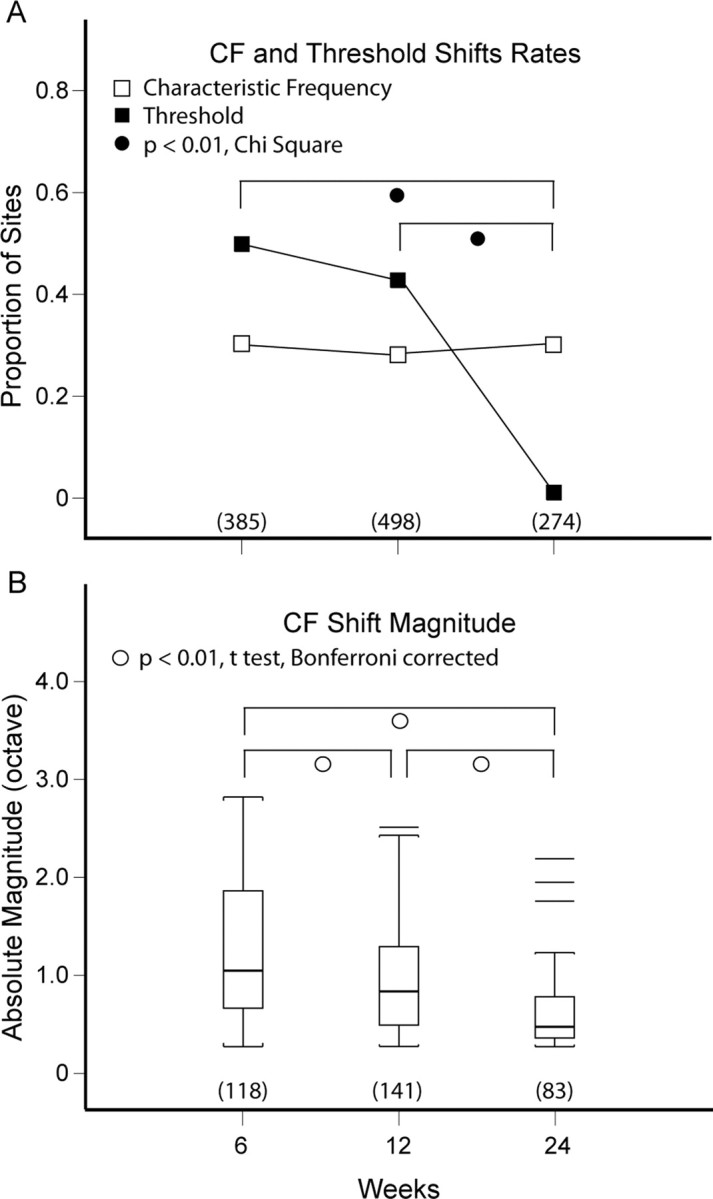
Summary of CF and threshold shift rates, and CF shift magnitude. A, CF shift rate, up or down, is ∼30% for all three recovery time periods. Threshold shift rates are indistinguishable (∼45%) at 6 and 12 weeks, but they differ from the threshold shift rate at 24 weeks (<1%). B, CF shift magnitude declines significantly (p < 0.01) with each successive recovery time period.
The magnitude of CF shift [mean (SD) octaves], computed from absolute values of statistically significant up and down differences (p < 0.05, empirical distributions), is 1.27 (0.76) at 6 weeks, 0.96 (0.54) at 12 weeks, and 0.62 (0.37) at 24 weeks. There is progressive decline in CF divergence or realignment of interaural frequency maps with the passage of time (Fig. 7B, p < 0.01, t test with Bonferroni correction). Table 4 provides a detailed accounting of CF shift contributions at recovery periods 6, 12, and 24 weeks. The means of CF shift down magnitudes for all three recovery periods are remarkably similar at −0.46 octave. The means of CF shift up magnitudes decrease monotonically from 1.57 to 1.25 to 1.03 octaves over time.
Table 4.
CF shift magnitude for all three recovery time periods
| Frequency band | CF shift magnitude (octave) |
||||||||
|---|---|---|---|---|---|---|---|---|---|
| Up |
Down |
Up and down |
|||||||
| Mean | SD | N | Mean | SD | N | Mean | SD | N | |
| < 0.5 kHz | |||||||||
| 6 weeks | 1.90 | 1 | −0.48 | 0.23 | 2 | 0.96 | 0.84 | 3 | |
| 12 weeks | 0 | −0.34 | 1 | 0.34 | 1 | ||||
| 24 weeks | 0.64 | 1 | −0.40 | 1 | 0.52 | 0.16 | 2 | ||
| 0.5–1 kHz | |||||||||
| 6 weeks | 1.97 | 0.70 | 35 | −0.56 | 0.20 | 13 | 1.58 | 0.88 | 48 |
| 12 weeks | 1.46 | 0.47 | 36 | −0.44 | 0.18 | 19 | 1.11 | 0.63 | 55 |
| 24 weeks | 1.14 | 0.57 | 11 | −0.47 | 0.19 | 13 | 0.78 | 0.53 | 24 |
| 1–2 kHz | |||||||||
| 6 weeks | 1.35 | 0.49 | 43 | −0.37 | 0.11 | 6 | 1.23 | 0.56 | 49 |
| 12 weeks | 1.13 | 0.42 | 41 | −0.50 | 0.21 | 26 | 0.89 | 0.47 | 67 |
| 24 weeks | 1.00 | 0.18 | 8 | −0.44 | 0.21 | 32 | 0.56 | 0.30 | 40 |
| 2–4 kHz | |||||||||
| 6 weeks | 0.91 | 0.17 | 7 | −0.34 | 0.07 | 7 | 0.63 | 0.32 | 14 |
| 12 weeks | 1.00 | 0.31 | 13 | −0.28 | 0.01 | 3 | 0.87 | 0.41 | 16 |
| 24 weeks | 0.80 | 0.10 | 3 | −0.44 | 0.15 | 10 | 0.52 | 0.21 | 13 |
| 4–8 kHz | |||||||||
| 6 weeks | 0 | −0.35 | 0.06 | 4 | 0.35 | 0.06 | 4 | ||
| 12 weeks | 0 | −0.39 | 0.12 | 2 | 0.39 | 0.12 | 2 | ||
| 24 weeks | 0 | −0.61 | 0.24 | 3 | 0.61 | 0.24 | 3 | ||
| >8 kHz | |||||||||
| 6 weeks | 0 | 0 | 0 | ||||||
| 12 weeks | 0 | 0 | 0 | ||||||
| 24 weeks | 0 | −0.59 | 1 | 0.59 | 1 | ||||
| Group | |||||||||
| 6 weeks | 1.57 | 0.67 | 86 | −0.45 | 0.17 | 32 | 1.27 | 0.76 | 118 |
| 12 weeks | 1.25 | 0.46 | 90 | −0.46 | 0.19 | 51 | 0.96 | 0.54 | 141 |
| 24 weeks | 1.03 | 0.42 | 23 | −0.46 | 0.19 | 60 | 0.62 | 0.37 | 83 |
N, Sample size.
The temporal evolution of interaural CF and threshold shifts in AI contralateral to the poorer hearing ear is most apparent at 24 weeks after overstimulation. Frequency maps come into realignment over time for the following reasons: (1) rate of CF shift up decreases, (2) CF shift up magnitudes decrease, (3) rate of CF shift down increases, and (4) CF shift down mean magnitudes are similar for all three recovery periods at −0.46 octave, the absolute value of which is lower than the CF shift up α/2 cutoff mark at 0.63 octave. Interaural threshold differences are reduced dramatically because cortical thresholds from the ipsilateral, better hearing ear increase until they nearly match thresholds from the contralateral, poorer hearing ear.
Relationship between interaural ABR and CF differences
Absolute ABR interaural threshold asymmetry and maximum CF difference levels are correlated at 6 and 12 weeks but not at 24 weeks. Figure 8 shows the relationship between maximum CF and corresponding ABR (Fig. 2) absolute difference levels for individual study monkeys at their respective recovery time periods. The peripheral interaural asymmetry level at a specific ABR frequency for a certain monkey is designated by two numbers with different fonts (regular, frequency in kHz; italic, monkey). Linear regression lines are fitted to all data within a particular recovery time period. Inclusion of all ABR frequencies (Fig. 2) for regression analysis is not possible in most monkeys because cortical sampling is more sparse for CF >4 kHz.
Figure 8.
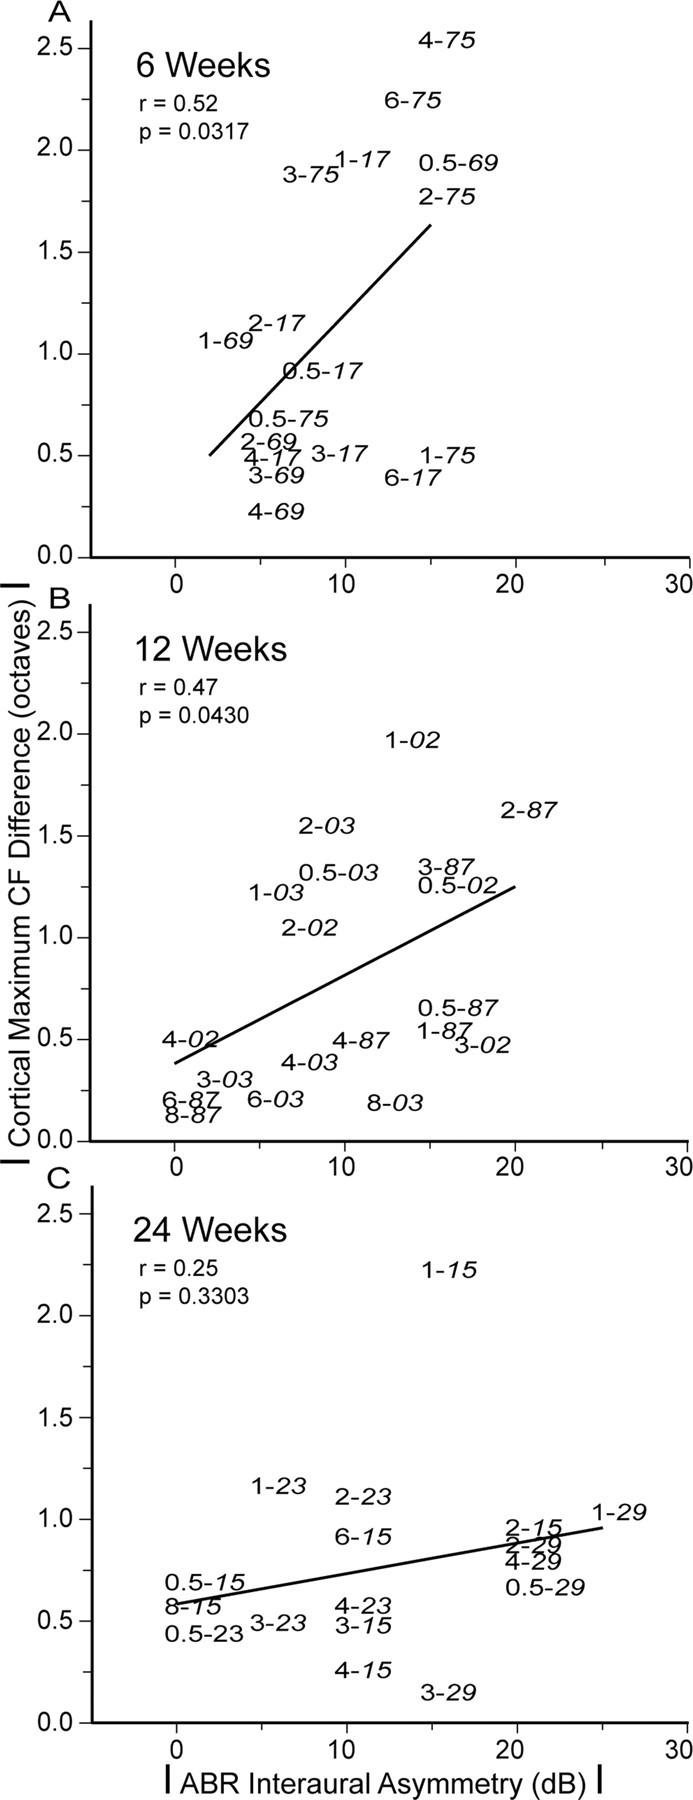
Relationship between absolute ABR interaural threshold asymmetry and maximum CF difference levels for all recovery time periods. A, B, Monkeys at 6 and 12 weeks show moderately strong linear correlation (r = 0.52, 6 weeks; r = 0.47, 12 weeks; both p < 0.05). C, Monkeys at 24 weeks do not show a significant linear relationship (p > 0.05).
At 6 and 12 weeks (Fig. 8A,B), the correlation between absolute interaural ABR asymmetry and absolute maximum CF difference is moderately strong (r = 0.52, 6 weeks; r = 0.47, 12 weeks; both p values <0.05). At 24 weeks (Fig. 8C), the linear fit is no longer statistically significant (p > 0.05).
At the earlier recovery time periods, absolute ABR interaural asymmetry levels at specific frequencies have significant power to predict absolute cortical maximum CF difference map divergence levels. Greater asymmetries in peripheral hearing loss tend to be accompanied by greater misalignment of cortical frequencies. At the later 24 week recovery time period, interaural cortical frequency maps have realigned and are no longer correlated with levels of peripheral threshold asymmetry.
Relationship between ABR audiogram and minimum cortical thresholds
ABR and cortical minimum thresholds are well aligned at earlier recovery time periods but not at the later interval. Figure 9 shows the relationship between minimum cortical and corresponding ABR thresholds for both ears in individual study monkeys at 6, 12, and 24 weeks. The specific ABR frequency and ear laterality are denoted by symbols (number, frequency in kHz; R, right; L, left) within each panel. Linear regression lines are fitted to data for both ears.
At 6 and 12 weeks, five of six monkeys (exception, sm03) show linear correlation relationship between minimum cortical and corresponding ABR thresholds that is strong (r >0.74, all p values <0.05), consistent with an analogous population analysis in normal monkeys (Fig. 3C,D; r = 0.82, p < 0.01). At 24 weeks, all three monkeys have nonsignificant (p > 0.05) linear fits when both ears are combined. Monkey sm03 at 12 weeks appears to be qualitatively more similar to monkeys at 24 weeks.
At earlier recovery periods, central auditory activation levels remain in lock step with changes in peripheral activation sensitivities. At the later 24 week recovery time period, however, a single linear regression model is inadequate to capture correlation relationships between minimum central and peripheral activation levels for both ears. Plastic change in cortical neuronal CF and threshold response properties responsible for interaural map realignments has uncoupled previously integrated binaural central and peripheral activation sensitivities. As a consequence, the predictable correlated relationship between minimum central and periphery thresholds observed in normal and earlier recovery period study monkeys is no longer valid at the later 24 week recovery period.
Discussion
Contralateral AI reorganization in mild asymmetric SNHL is a dynamic process that evolves over at least 24 weeks after acoustic overstimulation and likely thereafter. The reorganization is evidenced by changes in interaural difference relationships for CF and threshold. Dynamic receptive field reorganization in AI contralateral to the poorer hearing ear are characterized by (1) earlier changes, sampled at 6 and 12 weeks, that result in predominantly higher than expected CFs and thresholds, and (2) later changes, sampled at 24 weeks, that deviate strikingly from earlier recovery periods evidenced by realignment of interaural frequency maps and elevation of ipsilateral cortical thresholds that cannot be accounted for by peripheral thresholds of the better hearing ear. The perceptual consequences of realigned frequency and threshold maps are unclear, but they may relate to optimizing sound localization cues (Brainard and Knudsen, 1993, 1995; Gold and Knudsen, 1999, 2000; Keuroghlian and Knudsen, 2007).
Derivative observations and conclusions drawn from results above and discussed in subsequent sections below should be interpreted in the context of study limitations. The experimental design in this report is cross-sectional, not longitudinal. Ideally, there would be immediate pre-overstimulation and post-overstimulation ABR data, as well as perhaps weekly measurement of ABR thresholds for the first month after overstimulation, so that one could better define how much hearing loss was induced and how much of an initial temporary threshold shift was recovered over the intervening weeks. Such data on the status of the auditory periphery in association with cortical FRA data captured with a chronic recording device would more fully characterize CF map dynamics.
Contralateral AI reorganization in asymmetric SNHL
In unilateral mild SNHL, a special case of asymmetric hearing loss, plastic change in contralateral AI receptive field properties beyond CF and threshold has been demonstrated. Notably, there is strong reduction in inhibitory strength (Rajan, 1998, 2001). Frequency maps in some animals with SNHL do not appear grossly distorted, implying that restricted peripheral hearing loss may cause plastic change in cortical function without identifiable map distortion. Loss of inhibition may represent a cortical unmasking phenomenon with concomitant increase in frequency tuning curve excitatory bandwidth (Seki and Eggermont, 2002). Spectral and temporal receptive field properties are affected by alterations in inhibition, and global cortical change of inhibitory strength can have a profound impact on the processing of frequency-modulated sweeps and monkey species-specific vocalizations. Change in cortical neuron inhibition strength in the absence of frequency map distortion is observed not only in animals with impaired peripheral receptor function, but also in monkeys with normal cochleae but surgically altered vocal tracts that produce highly distorted complex communication sounds (Cheung et al., 2005; King, 2005).
Gross deviations from expected smooth transitions from one frequency to the next along the axis orthogonal to isofrequency contours in contralateral AI have been observed after unilateral mechanical lesions of the basal turn of cochleae in guinea pigs (Robertson and Irvine, 1989) and cats (Rajan et al., 1993) to induce SNHL. There is expanded representation of lower frequencies at the edge of the mechanical lesion at higher frequencies. Acute experiments on adult cats implanted with recording arrays in auditory cortex (Noreña et al., 2003) show a rapid shift of higher frequencies toward the tone-injured region and elevated thresholds. Chronic experiments on adult (Rajan et al., 1993) and juvenile (Eggermont and Komiya, 2000; Seki and Eggermont, 2002) cats with variable recovery time periods reveal occupation of the reorganized cortex by lower and higher frequencies in notched-type hearing loss and lower frequencies only in sloping high frequency SNHL. The expected frequency at a cortical site is referenced to the CF or best frequency measured from stimulation of the uninjured ipsilateral ear because CF is highly correlated for contralateral and ipsilateral ear stimulation in normal hearing animals.
The implicit assumption in all cortical plasticity studies on the hemisphere contralateral to the injured ear is that cortical receptive field properties derived from input to the ipsilateral better hearing ear is time invariant. This may not be the case because cortical responses to the better hearing ear also evolve, but later in time. For the observer, early frequency map distortions evidenced by interaural asymmetries may become inapparent if measurements are taken at a later recovery time period (after 24 weeks). Cortical reorganization is a dynamic process that involves complex interplays between the two ears. Clearly, the timing of measurements relative to the onset of acoustic injury is important and bears impact on the interpretation of results and conclusions for past and future studies in asymmetric hearing loss.
Model of interaural frequency map realignment
A summary model description of dynamic frequency map reorganization of AI in mild asymmetric SNHL is proposed (Fig. 10). Contralateral and ipsilateral input frequency maps in the far columns are abstractions of isofrequency contour organization before and after acoustic overstimulation directed at the right ear. Contralateral and ipsilateral FRAs in the middle column depict CF and threshold dynamics that underlie frequency and threshold map changes. In normal hearing monkeys, contralateral and ipsilateral CF maps are nearly identical (Fig. 10A, far columns). For a given AI penetration site (target symbol), the contralateral threshold is expected to be slightly lower than the ipsilateral threshold (Fig. 10A, middle column). After acoustic overstimulation directed at the right ear (X mark to cochlea, bottom row), mild asymmetric hearing loss is induced. At 6 and 12 weeks, the contralateral frequency map has reorganized (Fig. 10B), and the ipsilateral frequency map derived from the better hearing ear remains substantially similar to the map before asymmetric hearing loss induction. Contralateral CFs have shifted mostly to higher values but also to lower values, and there are concomitant threshold elevations. At those earlier recovery time periods, ipsilateral CF and threshold values remain similar to those before acoustic overstimulation. At 24 weeks, contralateral and ipsilateral frequency maps are in close realignment, as a result of later plastic change expressed in the ipsilateral frequency map (Fig. 10C). At this later recovery period, ipsilateral CFs have shifted to higher values, sometimes beyond contralateral CFs, to realign interaural frequency maps. Ipsilateral and contralateral FRA thresholds have come to closer realignment because of elevation of ipsilateral thresholds.
Figure 10.

Summary model description of frequency map dynamics in asymmetric mild sensorineural hearing loss. Left and right columns depict ipsilateral and contralateral isofrequency contour reorganization, and the middle column depicts FRA dynamics for CF and threshold. A, The first row shows that contralateral and ipsilateral CF maps are in alignment in normal monkeys. B, At 6 and 12 weeks after acoustic overstimulation, contralateral CF and threshold shifts are to mostly higher values. Ipsilateral FRA parameters remain similar to those in normal monkeys. Misalignment of interaural CF and threshold maps is evident. C, At 24 weeks, ipsilateral CF and threshold shifts to higher values emerge. Realignment of interaural CF and threshold maps follows. Dashed line (5 kHz isofrequency contour) indicates entry into the suprameatal plane.
Reorganized contralateral frequency map supervises ipsilateral representation plasticity
Auditory cortex reorganization in mild asymmetric SNHL is temporally dynamic and cannot be predicted by simple injury propagation models of the auditory periphery (Snyder et al., 2000; Snyder and Sinex, 2002; Syka, 2002; Irvine et al., 2003). The contributions of subcortical changes to cortical expressions of reorganization are undefined. Although activity changes following acute hearing loss have been observed in the inferior colliculus (Barsz et al., 2007; Felix and Portfors, 2007; Hutson et al., 2008), most of the observations in frequency organization may be attributable to passive consequences of the lesion, such as unmasking, with only limited evidence for plasticity (Snyder and Sinex, 2002; Irvine et al., 2003). There is no specific information on plausible mechanisms that may be responsible for plastic change of cortical receptive field properties to ipsilateral input that emerge some months after primary induction of hearing loss in the opposite ear. Potential mechanisms include but are not limited to supervised learning paradigms that optimize synaptic efficacies based on relative timing of presynaptic spike arrival and desired postsynaptic firing (Pfister et al., 2006). The dominance of the contralateral ear in the shaping of ipsilateral inputs may perhaps be based on persistent timing differences between the two inputs.
Normal controls and study monkeys at 6 and 12 weeks after induction of asymmetric hearing loss show close agreement between minimum cortical and corresponding ear-specific ABR thresholds. This linear relationship demonstrates that the best thresholds in cortex are a reflection of the status of the peripheral hearing organ. By 24 weeks, ipsilateral and contralateral cortical thresholds no longer show congruent frequency dependency with their respective ABRs. This suggests that establishing interaural alignment in cortical integration enabled by central plastic changes can overwrite a faithful replication of peripheral response properties.
Cortical representation plasticity of the better-hearing ear to establish realignment of spatial maps in mild asymmetric SNHL is a new concept in audition. Corresponding experiments in vision with circumscribed monocular lesions of adult cat retina do not show such a realignment. Rather, substantial displacements of contralateral receptive fields (RFs) in primary visual cortex (V1) remain misaligned with ipsilateral input 24 weeks after injury (Calford et al., 2000). The proportion of ipsilateral dominant inputs almost doubles compared with that in normal animals. Based on the behavior of several other visual RF properties after lesions, the investigators (Calford et al., 2000) conclude that horizontal inputs from within V1 play a major role in the shaping of displaced RFs. What role ipsilateral horizontal connections may play in the realignment of auditory RFs has not yet been explored. More detailed investigations are also needed to understand how the reorganized contralateral frequency map supervises ipsilateral representation plasticity.
Footnotes
This work was supported by Veterans Affairs Medical Research (S.W.C.), National Institutes of Health Grants DC02260 and MH77970 (C.E.S.), the Montgomery Street Foundation, the Coleman Memorial Fund, and Hearing Research, Incorporated.
References
- Barsz K, Wilson WW, Walton JP. Reorganization of receptive fields following hearing loss in inferior colliculus neurons. Neuroscience. 2007;147:532–545. doi: 10.1016/j.neuroscience.2007.04.031. [DOI] [PMC free article] [PubMed] [Google Scholar]
- Benson DA, Teas DC. Single unit study of binaural interaction in the auditory cortex of the chinchilla. Brain Res. 1976;103:313–338. doi: 10.1016/0006-8993(76)90801-5. [DOI] [PubMed] [Google Scholar]
- Brainard MS, Knudsen EI. Experience-dependent plasticity in the inferior colliculus: a site for visual calibration of the neural representation of auditory space in the barn owl. J Neurosci. 1993;13:4589–4608. doi: 10.1523/JNEUROSCI.13-11-04589.1993. [DOI] [PMC free article] [PubMed] [Google Scholar]
- Brainard MS, Knudsen EI. Dynamics of visually guided auditory plasticity in the optic tectum of the barn owl. J Neurophysiol. 1995;73:595–614. doi: 10.1152/jn.1995.73.2.595. [DOI] [PubMed] [Google Scholar]
- Calford MB, Wang C, Taglianetti V, Waleszczyk WJ, Burke W, Dreher B. Plasticity in adult cat visual cortex (area 17) following circumscribed monocular lesions of all retinal layers. J Physiol. 2000;524:587–602. doi: 10.1111/j.1469-7793.2000.t01-1-00587.x. [DOI] [PMC free article] [PubMed] [Google Scholar]
- Cheung SW. Frequency map variations in squirrel monkey primary auditory cortex. Laryngoscope. 2005;115:1136–1144. doi: 10.1097/01.MLG.0000165369.65046.CD. [DOI] [PubMed] [Google Scholar]
- Cheung SW, Bedenbaugh PH, Nagarajan SS, Schreiner CE. Functional organization of squirrel monkey primary auditory cortex: responses to pure tones. J Neurophysiol. 2001;85:1732–1749. doi: 10.1152/jn.2001.85.4.1732. [DOI] [PubMed] [Google Scholar]
- Cheung SW, Nagarajan SS, Schreiner CE, Bedenbaugh PH, Wong A. Plasticity in primary auditory cortex of monkeys with altered vocal production. J Neurosci. 2005;25:2490–2503. doi: 10.1523/JNEUROSCI.5289-04.2005. [DOI] [PMC free article] [PubMed] [Google Scholar]
- Cleveland WS. Visualizing data. Summit, NJ: Hobart; 1993. [Google Scholar]
- Eggermont JJ, Komiya H. Moderate noise trauma in juvenile cats results in profound cortical topographic map changes in adulthood. Hear Res. 2000;142:89–101. doi: 10.1016/s0378-5955(00)00024-1. [DOI] [PubMed] [Google Scholar]
- Felix RA, 2nd, Portfors CV. Excitatory, inhibitory and facilitatory frequency response areas in the inferior colliculus of hearing impaired mice. Hear Res. 2007;228:212–229. doi: 10.1016/j.heares.2007.02.009. [DOI] [PMC free article] [PubMed] [Google Scholar]
- Gold JI, Knudsen EI. Hearing impairment induces frequency-specific adjustments in auditory spatial tuning in the optic tectum of young owls. J Neurophysiol. 1999;82:2197–2209. doi: 10.1152/jn.1999.82.5.2197. [DOI] [PubMed] [Google Scholar]
- Gold JI, Knudsen EI. Abnormal auditory experience induces frequency-specific adjustments in unit tuning for binaural localization cues in the optic tectum of juvenile owls. J Neurosci. 2000;20:862–877. doi: 10.1523/JNEUROSCI.20-02-00862.2000. [DOI] [PMC free article] [PubMed] [Google Scholar]
- Green S. Auditory sensitivity and equal loudness in the squirrel monkey (Saimiri sciureus) J Exp Anal Behav. 1975;23:255–264. doi: 10.1901/jeab.1975.23-255. [DOI] [PMC free article] [PubMed] [Google Scholar]
- Hofer SB, Mrsic-Flogel TD, Bonhoeffer T, Hübener M. Lifelong learning: ocular dominance plasticity in mouse visual cortex. Curr Opin Neurobiol. 2006;16:451–459. doi: 10.1016/j.conb.2006.06.007. [DOI] [PubMed] [Google Scholar]
- Hubel DH, Wiesel TN. Receptive fields of cells in striate cortex of very young, visually inexperienced kittens. J Neurophysiol. 1963;26:994–1002. doi: 10.1152/jn.1963.26.6.994. [DOI] [PubMed] [Google Scholar]
- Hutson KA, Durham D, Imig T, Tucci DL. Consequences of unilateral hearing loss: cortical adjustment to unilateral deprivation. Hear Res. 2008;237:19–31. doi: 10.1016/j.heares.2007.12.007. [DOI] [PMC free article] [PubMed] [Google Scholar]
- Imig TJ, Adrián HO. Binaural columns in the primary field (A1) of cat auditory cortex. Brain Res. 1977;138:241–257. doi: 10.1016/0006-8993(77)90743-0. [DOI] [PubMed] [Google Scholar]
- Irvine DR, Rajan R, Smith S. Effects of restricted cochlear lesions in adult cats on the frequency organization of the inferior colliculus. J Comp Neurol. 2003;467:354–374. doi: 10.1002/cne.10921. [DOI] [PubMed] [Google Scholar]
- Irvine DR, Fallon JB, Kamke MR. Plasticity in the adult central auditory system. Acoust Aust. 2006;34:13–17. [PMC free article] [PubMed] [Google Scholar]
- Kaas JH, Merzenich MM, Killackey HP. The reorganization of somatosensory cortex following peripheral nerve damage in adult and developing mammals. Annu Rev Neurosci. 1983;6:325–356. doi: 10.1146/annurev.ne.06.030183.001545. [DOI] [PubMed] [Google Scholar]
- Kamada T, Kameda K, Kojima S. Auditory evoked potentials in the Japanese monkey. J Med Primatol. 1991;20:284–289. [PubMed] [Google Scholar]
- Keuroghlian AS, Knudsen EI. Adaptive auditory plasticity in developing and adult animals. Prog Neurobiol. 2007;82:109–121. doi: 10.1016/j.pneurobio.2007.03.005. [DOI] [PubMed] [Google Scholar]
- King AJ. Auditory plasticity: vocal output shapes auditory cortex. Curr Biol. 2005;15:R503–R505. doi: 10.1016/j.cub.2005.06.027. [DOI] [PubMed] [Google Scholar]
- Lasky RE, Soto AA, Luck ML, Laughlin NK. Otoacoustic emission, evoked potential, and behavioral auditory thresholds in the rhesus monkey (Macaca mulatta) Hear Res. 1999;136:35–43. doi: 10.1016/s0378-5955(99)00100-8. [DOI] [PubMed] [Google Scholar]
- Noreña AJ, Tomita M, Eggermont JJ. Neural changes in cat auditory cortex after a transient pure-tone trauma. J Neurophysiol. 2003;90:2387–2401. doi: 10.1152/jn.00139.2003. [DOI] [PubMed] [Google Scholar]
- Pfister JP, Toyoizumi T, Barber D, Gerstner W. Optimal spike-timing-dependent plasticity for precise action potential firing in supervised learning. Neural Comput. 2006;18:1318–1348. doi: 10.1162/neco.2006.18.6.1318. [DOI] [PubMed] [Google Scholar]
- Rajan R. Receptor organ damage causes loss of cortical surround inhibition without topographic map plasticity. Nat Neurosci. 1998;1:138–143. doi: 10.1038/388. [DOI] [PubMed] [Google Scholar]
- Rajan R. Plasticity of excitation and inhibition in the receptive field of primary auditory cortical neurons after limited receptor organ damage. Cereb Cortex. 2001;11:171–182. doi: 10.1093/cercor/11.2.171. [DOI] [PubMed] [Google Scholar]
- Rajan R, Irvine DR, Wise LZ, Heil P. Effect of unilateral partial cochlear lesions in adult cats on the representation of lesioned and unlesioned cochleas in primary auditory cortex. J Comp Neurol. 1993;338:17–49. doi: 10.1002/cne.903380104. [DOI] [PubMed] [Google Scholar]
- Rauschecker JP. Cortical map plasticity in animals and humans. Prog Brain Res. 2002;138:73–88. doi: 10.1016/S0079-6123(02)38072-5. [DOI] [PubMed] [Google Scholar]
- Robertson D, Irvine DR. Plasticity of frequency organization in auditory cortex of guinea pigs with partial unilateral deafness. J Comp Neurol. 1989;282:456–471. doi: 10.1002/cne.902820311. [DOI] [PubMed] [Google Scholar]
- Schreiner CE, Winer JA. Auditory cortex mapmaking: principles, projections, and plasticity. Neuron. 2007;56:356–365. doi: 10.1016/j.neuron.2007.10.013. [DOI] [PMC free article] [PubMed] [Google Scholar]
- Schwaber MK, Garraghty PE, Kaas JH. Neuroplasticity of the adult primate auditory cortex following cochlear hearing loss. Am J Otol. 1993;14:252–258. [PubMed] [Google Scholar]
- Seki S, Eggermont JJ. Changes in cat primary auditory cortex after minor-to-moderate pure-tone induced hearing loss. Hear Res. 2002;173:172–186. doi: 10.1016/s0378-5955(02)00518-x. [DOI] [PubMed] [Google Scholar]
- Semple MN, Kitzes LM. Binaural processing of sound pressure level in cat primary auditory cortex: evidence for a representation based on absolute levels rather than interaural level differences. J Neurophysiol. 1993;69:449–461. doi: 10.1152/jn.1993.69.2.449. [DOI] [PubMed] [Google Scholar]
- Snyder RL, Sinex DG. Immediate changes in tuning of inferior colliculus neurons following acute lesions of cat spiral ganglion. J Neurophysiol. 2002;87:434–452. doi: 10.1152/jn.00937.2000. [DOI] [PubMed] [Google Scholar]
- Snyder RL, Sinex DG, McGee JD, Walsh EW. Acute spiral ganglion lesions change the tuning and tonotopic organization of cat inferior colliculus neurons. Hear Res. 2000;147:200–220. doi: 10.1016/s0378-5955(00)00132-5. [DOI] [PubMed] [Google Scholar]
- Stapells DR, Picton TW, Durieux-Smith A, Edwards CG, Moran LM. Thresholds for short-latency auditory-evoked potentials to tones in notched noise in normal-hearing and hearing-impaired subjects. Audiology. 1990;29:262–274. doi: 10.3109/00206099009072857. [DOI] [PubMed] [Google Scholar]
- Syka J. Plastic changes in the central auditory system after hearing loss, restoration of function, and during learning. Physiol Rev. 2002;82:601–636. doi: 10.1152/physrev.00002.2002. [DOI] [PubMed] [Google Scholar]
- Wiesel TN, Hubel DH. Single-cell responses in striate cortex of kittens deprived of vision in one eye. J Neurophysiol. 1963;26:1003–1017. doi: 10.1152/jn.1963.26.6.1003. [DOI] [PubMed] [Google Scholar]