

Abstract
Background and purpose:
α5IA (3-(5-methylisoxazol-3-yl)-6-[(1-methyl-1,2,3-triazol-4-yl)methyloxy]-1,2,4-triazolo[3,4-a]phthalazine) is a triazolophthalazine with subnanomolar affinity for α1-, α2-, α3- and α5-containing GABAA receptors. Here we have evaluated the relationship between plasma α5IA concentrations and benzodiazepine binding site occupancy in rodents and primates (rhesus monkey).
Experimental approach:
In awake rats, occupancy was measured at various times after oral dosing with α5IA (0.03–30 mg·kg−1) using an in vivo {[3H]flumazenil (8-fluoro 5,6-dihydro-5-methyl-6-oxo-4H-imidazo[1,5-a][1,4]benzodiazepine-3-carboxylic acid ethyl ester)} binding assay. In anaesthetized rhesus monkeys, occupancy was measured using {[123I]iomazenil (ethyl 5,6-dihydro-7-iodo-5-methyl-6-oxo-4H-imidazo[1,5-a][1,4]benzodiazepine-3-carboxylic acid ethyl ester)} γ-scintigraphy and a bolus/infusion paradigm. In both rat and rhesus monkey, the plasma drug concentration corresponding to 50% occupancy (EC50) was calculated.
Key results:
In rats, α5IA occupancy was dose- and time-dependent with maximum occupancy occurring within the first 2 h. However, rat plasma EC50 was time-independent, ranging from 42 to 67 ng·mL−1 over a 24 h time course with the average being 52 ng·mL−1 (i.e. occupancy decreased as plasma drug concentrations fell). In rhesus monkeys, the EC50 for α5IA displacing steady-state [123I]iomazenil binding was 57 ng·mL−1.
Conclusions and implications:
Rat plasma EC50 values did not vary as a function of time indicating that α5IA dissociates readily for the GABAA receptor in vivo. These data also suggest that despite the different assays used (terminal assays of [3H]flumazenil in vivo binding in rats and [123I]iomazenil γ-scintigraphy in anaesthetized rhesus monkeys), these techniques produced similar plasma α5IA EC50 values (52 and 57 ng·mL−1 respectively) and that the plasma–occupancy relationship for α5IA translates across these two species.
Keywords: GABAA receptor, benzodiazepine, α5IA, occupancy, in vivo binding, γ-scintigraphy, [3H]flumazenil, [123I]iomazenil
Introduction
The triazolophthalazine α5IA (3-(5-methylisoxazol-3-yl)-6-[(1-methyl-1,2,3-triazol-4-yl)methyloxy]-1,2,4-triazolo[3,4-a]phthalazine) binds with equal affinity to the benzodiazepine binding site of GABAA receptors containing either an α1, α2, α3 or α5 subunit (Sternfeld et al., 2004; Dawson et al., 2006). Although α5IA is non-selective in terms of binding affinity, it has inverse agonist efficacy selective for the α5 subtype in that it exhibits inverse agonism at this subtype but has low or antagonist efficacy at the α1, α2 and α3 subtypes (Dawson et al., 2006). Consequently, the in vitro and in vivo effects of this compound are exerted primarily via GABAA receptors containing the α5 subunit (Dawson et al., 2006). More specifically, α5IA enhances long-term potentiation in a mouse hippocampal slice assay (a putative model of synaptic remodelling associated with learning and memory) and enhances cognitive performance in a hippocampal-dependent version of the Morris water maze (Dawson et al., 2006). Receptor occupancy studies using a [3H]flumazenil (8-fluoro 5,6-dihydro-5-methyl-6-oxo-4H-imidazo[1,5-a][1,4]benzodiazepine-3-carboxylic acid ethyl ester) in vivo binding assay demonstrated that the minimally effective dose for the behavioural effect was around 25% (Dawson et al., 2006). Recently, this same compound has been shown to decrease the cognition-impairing effects of ethanol in healthy normal volunteers (Nutt et al., 2007).
The purpose of the present study was to further explore the α5IA occupancy of rat brain GABAA receptors using an in vivo[3H]flumazenil binding assay and relate the kinetics of occupancy to plasma drug concentrations. Hence, we were interested in establishing whether α5IA occupancy was dictated primarily by plasma drug concentrations or whether occupancy was sustained (presumably due to a slow off-rate for α5IA), in which case occupancy would be maintained while plasma drug concentrations decreased. Accordingly, the plasma α5IA concentration required to achieve 50% occupancy (EC50) was measured at various times after oral dosing of α5IA. Thus, if there was sustained occupancy, then the EC50 would decrease as a function of time whereas if occupancy was dictated primarily by plasma drug concentrations, the EC50 value should be time-independent. A secondary aspect of these studies was to examine the α5IA plasma–occupancy relationship in rhesus monkey using [123I]iomazenil (ethyl 5,6-dihydro-7-iodo-5-methyl-6-oxo-4H-imidazo[1,5-a][1,4]benzodiazepine-3-carboxylic acid ethyl ester) γ-scintigraphy in order to examine whether there were any inter-species differences in the plasma–occupancy relationship for α5IA. The data show that in rodents there was no evidence of sustained occupancy and that plasma pharmacokinetics can be used as a surrogate for occupancy and thereby dictate the frequency of dosing in subsequent clinical studies. Moreover, the plasma–occupancy relationship in rats and rhesus monkey were similar (respective EC50 values of 52 and 57 ng·mL−1), indicating minimal across-species differences.
Methods
Animals
All aspects of animal care and experimental procedures complied with the United Kingdom Animals (Scientific Procedures) Act 1986 and its associated guidelines.
Rat brain α5IA occupancy measured using [3H]flumazenil in vivo binding
Male Sprague-Dawley rats (250–300 g, B&K Universal, Hull, UK) were dosed orally (dose volume = 1 mL·kg−1) with either 0.5% methyl cellulose vehicle (Methocel A4C; The Dow Chemical Company, Midland, USA) or α5IA (in 0.5% methyl cellulose vehicle and at doses ranging from 0.03 to 30 mg·kg−1) for periods up to 8 h for the lower doses (0.03–1 mg·kg−1) or up to 24 h for the higher doses (3–30 mg·kg−1). The extent to which pretreatment of rats with α5IA inhibited the in vivo binding of [3H]flumazenil (i.e. α5IA occupancy) was measured as described elsewhere (Atack et al., 2006; Dawson et al., 2006). In brief, 3 min prior to the appropriate pretreatment time point (for example, 57 min after dosing of the 1 h time point animals) rats were given an i.v. tail vein injection of [3H]flumazenil (diluted 1:150 with saline and dosed at 1 µL·g−1) and 3 min later were killed by decapitation. Trunk blood was collected into lithium-heparin tubes, centrifuged and plasma-retained for subsequent analysis of drug concentrations (see below). Brains were removed, homogenized, and 300 µL aliquots were filtered and washed with 10 mL of ice-cold buffer over Whatman GF/B filters. The filters were then placed in scintillation vials, scintillation fluid was added and radioactivity counted on a Beckman LS6500 scintillation counter.
In order to define the extent of non-specific binding, a separate group of animals were pretreated for 30 min with bretazenil (5 mg·kg−1 i.p. in PEG 300) prior to [3H]flumazenil in vivo binding being measured as described above. The degree of non-specific binding in filtered and washed 300 µL aliquots of bretazenil-treated brain homogenate was in the region of 100 dpm whereas the corresponding value in vehicle treated rats was around 2000 dpm.
The plasma concentrations of α5IA were determined using a liquid chromatography–tandem mass spectrometry (LC-MS/MS) assay. Briefly, an internal standard (α5IA-II, 3-(5-methylisoxazol-3-yl)-6-[(2-pyridyl)methyloxy]-1,2,4-triazolo[3,4-a]phthalazine; Collinson et al., 2006) was added to aliquots (50 µL) of plasma samples and then protein precipitated with acetonitrile. The supernatant obtained from centrifugation was diluted with ammonium formate (25 mmol·L−1, pH 3) and then analysed by LC-MS/MS.
Occupancy (i.e. the degree to which specific binding of [3H]flumazenil was reduced in α5IA- relative to vehicle-treated animals) was plotted as a function of either dose or plasma α5IA drug concentrations, and curve-fitting was carried out by using GraphPad Prism (GraphPad Software Inc., San Diego, CA, USA) and from these data the dose that inhibited 50% of the in vivo binding of [3H]flumazenil (Occ50, dose required to produce 50% occupancy) or the plasma drug concentration corresponding to 50% occupancy (EC50) values were calculated.
Rhesus monkey brain α5IA occupancy measured using [123I]iomazenil γ-scintigraphy
The measurement of α5IA occupancy in rhesus monkeys was carried out by using [123I]iomazenil employing methods previously described (Innis et al., 1991a,b; Laruelle et al., 1993). In brief, after withholding food overnight male rhesus monkeys (3.5–5.0 kg) were initially anaesthetized with ketamine (10 mg·kg−1 i.m.), then induced with propofol (5 mg·kg−1 i.v.), intubated and respired with medical grade oxygen. Subsequent anaesthesia was maintained with propofol (0.4 mg·kg−1·min−1 i.v.). The rhesus monkeys were placed on the patient bed with the left side of the head resting on the low-energy collimator [Siemens Orbiter single-photon emission computed tomography (SPECT) camera]. Acquisition of planar images allowed the generation of detailed time–activity curves (2 min per frame resolution) of the uptake and chase of [123I]iomazenil binding to GABAA receptors. Due to attenuation, most of the measured signal is obtained from the lateral cortex juxtaposed to the γ-camera, which is functionally similar to the approach of Innis et al. (1991a,b) in which they used a collimated γ-probe to measure time–activity curves with a resolution of 1 min. Furthermore, in separate studies we showed that in vivo dose inhibition of the binding of [123I]iomazenil to GABAA receptors in rat brain by diazepam did not vary from region to region with the Occ50 values in the cortex, striatum and cerebellum being cortex, 1.5, 1.0 and 2.4 mg·kg−1 respectively. Thus, activity derived from deeper structures should not alter the results obtained from planar imaging.
Initial studies were performed by using flumazenil, and the kinetics from these studies were used to help design subsequent studies with α5IA. Following i.v. injection of a bolus (∼0.4 mCi) of [123I]iomazenil, steady state was achieved by infusion of [123I]iomazenil (0.05–0.06 mCi·h−1) over the course of the study. After either 180 min for the flumazenil study or 100 min for the α5IA study (both of which were sufficient time to achieve steady state), displacement of radiotracer binding was achieved by a bolus and infusion of different doses of these drugs. Plasma concentrations were obtained over the time–course of drug infusion to determine the concentration of drug required to produce the measured reduction in [123I]iomazenil binding. Only one concentration of drug was studied per imaging session, rather than the stepwise, multiple-dose regimen described by Innis et al. (1991b).
[123I]iomazenil time–activity curve analysis
Following injection of the competing drug, [123I]iomazenil rapidly dissociated establishing a new steady-state concentration of radiotracer binding. The extent of radiotracer displacement was determined by curve-fitting the washout of radiotracer to an exponential plus constant in which the constant represents the extent to which drug inhibits the [123I]iomazenil binding at steady state. In a number of studies, the extent of ‘non-specific’ binding was established by displacing radiotracer with 1 mg·kg−1 flumazenil. These studies showed that the level of non-specific binding defined this way was a relatively constant proportion of the total binding, allowing this average value for non-specific binding to be applied to the subsequent analysis of the α5IA competition studies.
While we achieved steady state of radiotracer accumulation in rhesus brain for most studies, we also fit the wash-in data with a bi-exponential function and used the curve fit value as the extent of uninhibited binding of [123I]iomazenil to GABAA receptors in rhesus brain. The % inhibition was subsequently calculated from the fraction of inhibition at steady state relative to the total signal available versus plasma concentration of α5IA. The plasma–occupancy curve was then fitted by using GraphPad Prism (GraphPad Software Inc., San Diego, CA, USA), and from these data the EC50 was determined.
Data analysis
Data are presented as mean ± SEM. Comparison of the plasma EC50 values as a function of time was performed by using an anova.
Materials
α5IA and α5IA-II were synthesized as described previously (Sternfeld et al., 2004), and flumazenil and bretazenil were also synthesized in-house. [3H]Flumazenil ([3H]Ro 15-1788; 87 Ci·mmol−1) was purchased from PerkinElmer LAS (Boston, MA, USA). The synthesis of [123I]iomazenil is described in more detail below.
Preparation of [123I]iomazenil
[123I]Iomazenil was prepared by oxidative radioidination of the trimethyltin precursor essentially as previously described (McBride et al., 1991). In a typical radiosynthesis, a shipping vial of Na123I (20 mCi, dry, MDS Nordion, Ottawa, Canada) containing a stir bar and an Iodobead was treated with methanol (50 µL) and 30 µL of Na123I solution (13 µg·mL−1 in water) and stirred for 1 min at room temperature. To the vial was added trifluoroacetic acid (TFA; 20 µL) and a solution of trimethyltin precursor (∼0.25 mg in 50 µL methanol) and the mixture was stirred at room temperature for about 2–5 min before addition of another batch of trimethyltin precursor (∼0.25 mg in 0.05 mL methanol). The resulting mixture was stirred at room temperature for ∼30 min before it was quenched with concentrated ammonium hydroxide (20 µL) and sodium thiosulphate (10 µL of a 10 mg·mL−1 aqueous solution). The reaction mixture was then purified by HPLC (Vydac C-18 Protein and Peptide column, 3.9 × 250 mm) with 20% acetonitrile/0.1% TFA at 1.0–1.5 mL·min−1 for 15 min and then 40% acetonitrile/0.1% TFA until the main radioactive peaks were eluted off the column and collected by a fraction collector. Thereafter, the column was eluted with acetonitrile/0.1% TFA to remove any unreacted trimethyltin precursor and other organic matters. The desired fractions containing [123I]iomazenil (5–7 mCi, in ∼20–35% radiochemical yields and with >90–95% radiochemical purities, as confirmed by HPLC analysis) were pooled and partially concentrated in vacuo to remove volatile organic solvents, before being further formulated and buffered for use in the planar imaging studies.
Results
Kinetics of rat plasma α5IA concentrations and occupancy
The pharmacokinetics of α5IA in rat plasma are shown in Figure 1A with the parameters derived from these data being presented in Table 1. The data clearly show that plasma exposure of α5IA was dose-dependent but that the maximum plasma concentrations (Cmax) were not linearly related to dose at higher doses. Hence, the ratio of the maximum plasma concentrations observed at 3 and 30 mg·kg−1 (233 and 327 ng·mL−1 respectively) was only 1.4- rather than 10-fold greater. The exposure (as measured by the area under the concentration–time curve between 0 and 24 h, AUC0–24) showed modestly improved dose proportionality with the exposure at 30 mg·kg−1 (5099 ng·h·mL−1) being threefold that at 3 mg·kg−1 (1647 ng·h·mL−1). However, the AUC0–24 at 30 mg·kg−1α5IA is likely to be an underestimate of the total exposure as appreciable plasma concentrations (60 ± 20 ng·mL−1) remained 24 h after dosing (i.e. the AUC0–24 < AUC0–∞). The fact that the kinetics after oral administration were different from those following i.v. dosing (Figure 1A) suggests that in rats there was a sustained absorption phase for α5IA, which was most obvious at higher doses (i.e. at lower doses, the oral kinetics were more comparable to the i.v. kinetics).
Figure 1.
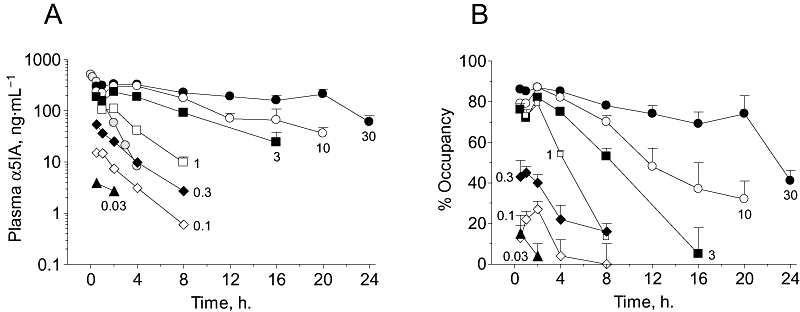
Rat plasma α5IA concentrations and occupancy of GABAA receptor benzodiazepine sites are dose- and time-dependent following oral dosing. (A) Plasma α5IA concentrations at various times after dosing with different doses of α5IA (0.03–30 mg·kg−1 p.o. in 0.5% methyl cellulose vehicle). The grey symbols shows the pharmacokinetics of α5IA following an i.v. dose (0.9 mg·kg−1 in PEG 300 vehicle, n= 3). (B) Occupancy of benzodiazepine sites by α5IA (dosed p.o.) in the same animals used for plasma drug measurements as measured by the extent to which prior dosing with α5IA reduced the in vivo binding of [3H]flumazenil. Figures within each panel represent the corresponding dose. Values shown are mean ± SEM (n= 5–12 per group). α5IA, 3-(5-methylisoxazol-3-yl)-6-[(1-methyl-1,2,3-triazol-4-yl)methyloxy]-1,2,4-triazolo[3,4-a]phthalazine.
Table 1.
Characteristics of plasma pharmacokinetics and GABAA receptor occupancy following oral dosing of α5IA (0.03–30 mg·kg−1) in rats
| Dose (mg·kg−1) |
Plasma α5IA kinetics |
GABAA receptor occupancy |
||||
|---|---|---|---|---|---|---|
| Cmax (ng·mL−1) | Tmax (h) | AUCa(ng·h ·mL−1) | Estimated Fb(%) | Maximum occupancy (%) | Tmax (h) | |
| 0.03 | 4 | 0.5 | N/D | N/D | 15 | 0.5 |
| 0.1 | 15 | 0.5 | 41(0–8 h) | 70 | 27 | 2 |
| 0.3 | 54 | 0.5 | 128(0–8 h) | 72 | 45 | 1 |
| 1.0 | 109 | 2 | 408(0–8 h) | 70 | 79 | 2 |
| 3.0 | 233 | 2 | 1647(0–20 h) | 92 | 82 | 2 |
| 10 | 301 | 2 | 3044(0–24 h) | 52 | 87 | 2 |
| 30 | 327 | 2 | 5099(0–24 h) | 29c | 87 | 2 |
α5IA, 3-(5-methylisoxazol-3-yl)-6-[(1-methyl-1,2,3-triazol-4-yl)methyloxy]-1,2,4-triazolo[3,4-a]phthalazine; N/D, not determined due to insufficient data.
AUC, area under the concentration–time curve.
F, bioavailability, calculated in relation to i.v. kinetics following a 0.9 mg·kg−1 dose (t½= 0.9 h, clearance = 29 mL·min−1·kg−1, volume of distribution = 1.9 L·kg−1).
This value is an underestimate as the full area under the curve was not measured as plasma concentrations were only measured up to 24 h post dose.
The dose-dependent nature of the plasma α5IA concentrations was mirrored by the dose occupancy of rat brain GABAA receptor benzodiazepine binding sites (Figure 1B). Hence, the maximum occupancy increased with dose (Table 1) but at the higher doses, there was relatively little change in the maximum occupancy observed with, for example, the maximum occupancies at 1 and 30 mg·kg−1 being 79% and 87% respectively. At the highest dose (30 mg·kg−1) occupancy was relatively sustained, varying only from 74% to 87% within the time period of 0.5–20 h post dose and even 24 h after dosing, significant occupancy remained (41 ± 5%). Similarly, at a dose of 10 mg·kg−1, 32 ± 9% occupancy remained after 20 h. However, this sustained occupancy reflects the relatively constant plasma drug concentrations, which were, as mentioned above, presumably related to an extended absorption phase.
Dose dependency of rat brain α5IA occupancy
The relationship between dose and occupancy 2 h after dosing (Figure 2) shows that at low doses where proportionality between dose and plasma drug concentrations was apparent (0.03–1 mg·kg−1; Table 1), occupancy was well described by a single-site binding equation, with an Occ50 of 0.35 mg·kg−1. However, at the higher doses at which proportionality in plasma drug concentrations and maximum occupancy was reduced (3–30 mg·kg−1; Table 1), data fell below the curve fitted to the lower-dose data.
Figure 2.
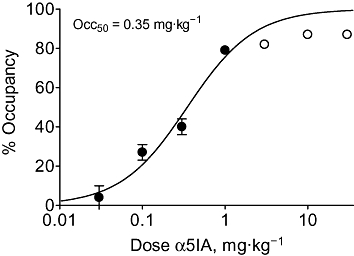
Occupancy of rat brain benzodiazepine binding sites by α5IA, 2 h after oral administration, was dose-dependent. Filled circles denote those data points used to fit the curve, which gives an Occ50 of 0.35 mg·kg−1 (Hill slope = 1.08); the open circles (3–30 mg·kg−1) were excluded as plasma Cmax drug concentrations (and therefore occupancy) demonstrated poor dose proportionality (Table 1). Values shown are mean ± SEM (n= 7–9 per group). α5IA, 3-(5-methylisoxazol-3-yl)-6-[(1-methyl-1,2,3-triazol-4-yl)methyloxy]-1,2,4-triazolo[3,4-a]phthalazine; Occ50, dose required to produce 50% occupancy.
Relationship between rat α5IA occupancy and plasma drug concentrations
For each time point studied, the relationship between occupancy and plasma drug concentrations was plotted and the corresponding EC50 values determined (Table 2). These data were generally well described by a single-site model with a Hill slope around unity. In addition, there was no tendency for the EC50 values describing the plasma–occupancy relationship (range = 42–67 ng·mL−1) to change as a function of time (anova, P < 0.05) and, more importantly, no trend for the EC50 values to be lower at later, compared with earlier, time points. These data therefore indicate that α5IA did not give sustained occupancy (i.e. occupancy does not remain when drug is cleared from the plasma) and that α5IA must, therefore, have a relatively fast off-rate in vivo. Given that the plasma EC50 was not time-dependent, all data were analysed together (Figure 3) to give a combined EC50 for α5IA of 52 ng·mL−1.
Table 2.
Relationship between occupancy and plasma concentrations at various times following p.o. dosing of α5IA [3-(5-methylisoxazol-3-yl)-6-[(1-methyl-1,2,3-triazol-4-yl)methyloxy]-1,2,4-triazolo[3,4-a]phthalazine]
| Time (h) | EC50 (ng·mL−1) (95% confidence intervals) | Hill slope (n) |
|---|---|---|
| 0.5 | 67 (60–74) | 1.12 (43) |
| 1 | 46 (41–52) | 1.00 (35) |
| 2 | 44 (38–52) | 0.95 (37) |
| 4 | 42 (35–50) | 0.98 (46) |
| 8 | 67 (60–76) | 1.00 (31) |
| 12 | 63 (54–73) | 1.08 (12) |
| 16 | 60 (46–79) | 1.22 (10) |
| 20 | 63 (51–77) | 1.11 (11) |
| 24 | 52 (36–76) | 0.90 (11) |
| All data | 52 (49–56) | 0.98 (236) |
Figure 3.
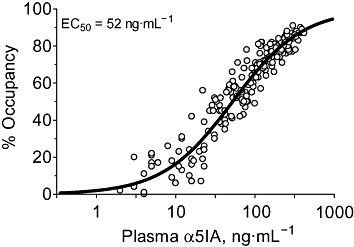
The occupancy of each animal used in the time–course study (Figure 1) was plotted as a function of the corresponding plasma concentration of α5IA. The curve fit through these data gave an EC50 of 52 ng·mL−1 (Hill slope = 0.98, n= 236). The increased variability at the bottom end of the curve presumably reflects the reduced sensitivity to the measurement of drug concentrations and occupancy at lower levels. α5IA, 3-(5-methylisoxazol-3-yl)-6-[(1-methyl-1,2,3-triazol-4-yl)methyloxy]-1,2,4-triazolo[3,4-a]phthalazine.
Rhesus monkey brain [123I]iomazenil time–activity curves
Under conditions of a steady-state infusion of [123I]iomazenil (Laruelle et al., 1993), displacement of radioligand could be achieved by a single bolus injection of the prototypic non-selective antagonist flumazenil (Figure 4A). Similarly, using a bolus/infusion paradigm to reach steady-state plasma concentrations, α5IA was also able to produce dose-dependent displacement of [123I]iomazenil (Figure 4B). Increasing the dose of flumazenil produced a greater displacement of [123I]iomazenil such that at a dose of 1 mg·kg−1 there was essentially complete displacement of [123I]iomazenil (Figures 4A and B), thereby defining the level of non-specific [123I]iomazenil uptake.
Figure 4.
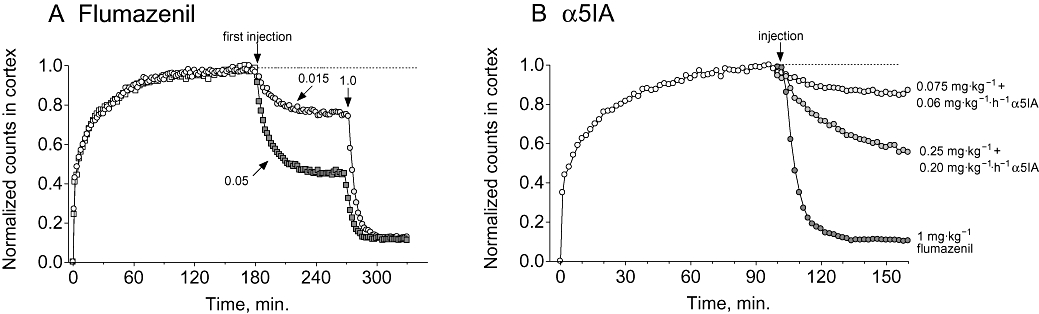
Representative time–activity curves showing the displacement of [123I]iomazenil (∼0.4 mCi bolus followed by 0.05–0.06 mCi·h−1 infusion) from rhesus monkey brain using either flumazenil or α5IA. (A) [123I]iomazenil was displaced by bolus injections of either 0.015, 0.05 or 1.0 mg·kg−1 flumazenil (arrows indicate time of bolus injections). (B) [123I]iomazenil was displaced by α5IA administered as a bolus followed by infusion (0.075 mg·kg−1 bolus plus 0.06 mg·kg−1·h−1 infusion, and 0.25 mg·kg−1 bolus plus 0.20 mg·kg−1 infusion). Flumazenil and α5IA data are from two and three separate studies respectively. For presentation purposes, all curves have been normalized so each condition can be presented in the same plot. In these examples, the inhibition of radiotracer binding by α5IA at steady state was 38% and 71%, for the 0.075 mg·kg−1 bolus plus 0.06 mg·kg−1·h−1 infusion and 0.25 mg·kg−1 bolus plus 0.20 mg·kg−1 infusion dosing regimes respectively. The time–activity curve for flumazenil (1 mg·kg−1) is included to show the extent of the non-specific radiotracer signal. The fit of the accumulation of radiotracer (solid grey line) suggests steady state was approximated prior to injection of α5IA chase. α5IA, 3-(5-methylisoxazol-3-yl)-6-[(1-methyl-1,2,3-triazol-4-yl)methyloxy]-1,2,4-triazolo[3,4-a]phthalazine.
Relationship between rhesus monkey α5IA occupancy and plasma drug concentrations
By determining the plasma flumazenil concentrations at the end of data acquisition, it was possible to establish that the plasma concentration of flumazenil required to give 50% displacement of [123I]]iomazenil (i.e. 50% flumazenil occupancy) was equivalent to 40 ng·mL−1 (data not shown). Similar analyses of data for α5IA produced an EC50 of 57 ng·mL−1 (Figure 5).
Figure 5.
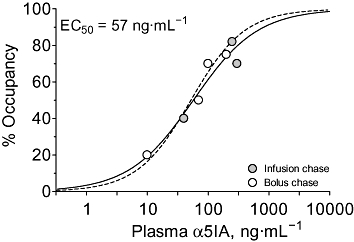
Relationship between plasma drug concentration and rhesus monkey GABAA receptor occupancy as measured using [123I]iomazenil γ-scintigraphy. The data were constrained to a Hill slope of unity and gave an EC50 value of 57 ng·mL−1. For comparative purposes, the plasma occupancy curve for rat (Figure 3) is shown as a dashed line (EC50= 52 ng·mL−1).
Discussion
Comparison of [3H]flumazenil and [123I]iomazenil radioligands
Flumazenil (Ro 15-1788) is the prototypic non-selective benzodiazepine antagonist (Hunkeler et al., 1981) in that it binds with equally high affinity (0.4–1.5 nmol·L−1) to GABAA receptors containing either an α1, α2, α3 or α5 subunit (Sieghart, 1995). Iomazenil (Ro 16-0154) is a close structural analogue of flumazenil in that the 8-fluoro substituent on the benzodiazepine moiety of flumazenil is replaced by a 7-iodo group in iomazenil (Beer et al., 1990; Johnson et al., 1990) and this confers iomazenil with similar or slightly higher affinity for the benzodiazepine site of rat and human brain GABAA receptors compared with flumazenil (Beer et al., 1990; Johnson et al., 1990). Although the subtype selectivity of iomazenil has not been described, the generally similar anatomical distribution of [3H]- or [11C]flumazenil and [123I]- or [125I]iomazenil binding both in vitro and in vivo suggest that both radioligands have comparable, non-selective binding profiles (Beer et al., 1990; Millet et al., 2002). The high affinity of flumazenil and iomazenil combined with the physicochemical properties of each compound (Beer et al., 1990) have resulted in both compounds being used extensively for the in vivo labelling of GABAA receptors, whether in rodents (Goeders and Kuhar, 1985; Atack et al., 1999; 2006; 2007; Dawson et al., 2006), primates (Hantraye et al., 1984; Innis et al., 1991a,b; Laruelle et al., 1994) or humans (Persson et al., 1985; Beer et al., 1990; Millet et al., 2002).
Although α5IA is an inverse agonist with selectivity for the GABAAα5 subtype, this selectivity is based upon differential efficacy rather than affinity (Sternfeld et al., 2004; Dawson et al., 2006). Consequently, as α5IA binds, like flumazenil or iomazenil, with comparable affinity to the different GABAA receptor subtypes, inhibition of the in vivo binding of radiolabelled flumazenil or iomazenil reflects equivalent occupancy at α1-, α2-, α3- and α5-containing GABAA receptors. For example, a 70% inhibition of in vivo[3H]flumazenil or [123I]iomazenil binding reflects an α5IA occupancy of 70% at each of the α1, α2, α3 and α5 subtypes.
Comparison of [3H]flumazenil in vivo binding and [123I]iomazenil γ-scintigraphy methods
In order to interpret the effects of CNS drugs, it is necessary to establish that a drug enters the brain and engages the target. This is readily quantified in rodents by measuring the extent to which a compound inhibits the in vivo or ex vivo binding of a target-specific radioligand using post-mortem measurements of radioactivity (Li et al., 2006). In primates and humans minimally invasive in vivo imaging techniques, such as SPECT or positron emission tomography (PET) can be used to generate occupancy data. In addition, non-tomographic methods can be used in which there is no anatomical resolution but rather radioactivity is counted using γ-scintigraphy for single-photon emitters or total head counts for positron emitters (Malizia et al., 1995; 1996).
Although the properties of [3H]flumazenil and [123I]iomazenil radioligands are comparable (see above), and apart from the radioactivity detection methods employed (post-mortem for in vivo binding versus in vivo for γ-scintigraphy), there remain key methodological differences between [3H]flumazenil in vivo binding and [123I]iomazenil γ-scintigraphy. Thus, [3H]flumazenil in vivo binding was performed in conscious rats whereas [123I]iomazenil γ-scintigraphy was carried out in rhesus monkeys maintained under anaesthesia using propofol. In this regard, it is interesting to note that despite GABAA receptors having a defined recognition site for certain anaesthetics (including isoflurane; Schofield and Harrison, 2005), isoflurane did not appreciably alter lorazepam occupancy in anaesthetized versus conscious rats (Atack et al., 2007). However, the possibility that propofol influences the in vivo binding of [123I]iomazenil and/or α5IA cannot be excluded. Another difference between the rodent and primate studies is that with [3H]flumazenil in vivo binding, rats were pretreated with α5IA and then [3H]flumazenil was given as a tracer for a relatively short period (3 min). In contrast, in rhesus monkeys, [123I]iomazenil was administered and maintained at a steady state using an i.v. infusion and then α5IA was administered by the i.v. route, and again infused to achieve a steady state, as a ‘chase’ to displace [123I]iomazenil from the benzodiazepine recognition sites. Despite these fundamentally different dosing paradigms, the similar plasma–occupancy relationship of α5IA measured by using either rat [3H]flumazenil in vivo binding or rhesus monkey [123I]iomazenil γ-scintigraphy (52 and 57 ng·mL−1 respectively) argue against methodological differences being a major issue. Consistent with this, in rat the plasma–occupancy relationship for lorazepam was similar whether it was measured by using either [3H]flumazenil in vivo binding or [11C]flumazenil microPET methodologies (respective EC50 values of 134 and 96 ng·mL−1; Atack et al., 2007). In addition to the [123I]iomazenil study, a single rhesus monkey [11C]flumazenil PET study was performed but the dose of α5IA used, 10 mg·kg−1 i.v., produced essentially complete (i.e. 100%) occupancy even 6 h following injection, at which time plasma α5IA concentrations were still in the region of 5 µg·mL−1 (data not shown).
Although the similar potency of α5IA in terms of plasma EC50 when measured using either rat [3H]flumazenil in vivo binding or rhesus monkey [123]iomazenil γ-scintigraphy suggest no appreciable effect of methodological differences, these data are inconsistent with previous reports that in mice and rhesus monkey [3H]- or [11C]flumazenil and [125I]- or [123I]iomazenil produce markedly different results in terms of flunitrazepam occupancy (Hosoi et al., 1999; Inoue et al., 2001). It could be argued that, in the present study, methodological inconsistencies actually do exist but inter-species differences cancel these out and produce comparable EC50 values (52 and 57 ng·mL−1). Nevertheless, in the present study, the Occ50 for flumazenil of 0.04 mg·kg−1 as measured with [123I]iomazenil (Figure 4A) is in the same region as that measured in baboons and man using [11C]flumazenil (∼9 and 20 µg·kg−1 i.v. respectively; Brouillet et al., 1991; Savic et al., 1991; Atack et al., 2007). Furthermore, the Occ50 for lorazepam measured in baboon using [123I]iomazenil SPECT (0.34 mg·kg−1 i.v.; Sybirska et al., 1993) is similar to that measured in rat using [3H]- or [11C]flumazenil (0.15–0.25 mg·kg−1; Atack et al., 2007) all of which argue against occupancy values being affected by the choice of flumazenil or iomazenil as radioligand.
Pharmacodynamic properties of α5IA
The main purpose of the present study was to characterize the in vivo receptor occupancy properties of α5IA. Most particularly, we wanted to examine whether α5IA gave occupancy that outlasted plasma drug exposure. This information is useful in the clinical setting since if occupancy is dictated by plasma drug concentrations then standard plasma pharmacokinetics can be used to dictate the frequency of dosing in humans. On the other hand, if there is prolonged occupancy, then the dosing regime should be dictated by the duration of occupancy and not by plasma pharmacokinetics. For example, the atypical antipsychotics risperidone and olanzepine as well as the 5HT2A antagonist MDL-100,907 all give sustained occupancy relative to plasma drug concentrations (Gründer et al., 1997; Tauscher et al., 2002; Takano et al., 2004).
Qualitatively, the time course of α5IA rat brain occupancy reflected that of the plasma pharmacokinetics (Figure 1). However, since the relationship between drug concentrations and occupancy are non-linear and are described by a S-shaped semi-log function, it is not possible to directly equate plasma and occupancy values (i.e. a doubling of drug concentrations does not double the level of occupancy). Moreover, although plasma pharmacokinetics are often described in terms of the half-life, an occupancy half-life is a meaningless concept (Olsson and Farde, 2005). Therefore, we chose to compare the rat plasma drug EC50 values at different times after dosing on the basis that if there was sustained occupancy, then the EC50 should decrease as a function of time whereas if occupancy tracked plasma drug concentrations then the EC50 should not vary with time. The data clearly show (Table 2) that there was no tendency for the plasma EC50 of α5IA to vary with time with the EC50 24 h after dosing (52 ng·mL−1) being comparable to that measured 0.5 h after dosing (67 ng·mL−1).
Although it is possible to readily study the relationship between receptor occupancy and plasma drug concentrations in rat, comparable analyses (i.e. the measurement of the plasma–occupancy relationship at different times after dosing) are very expensive in humans. Therefore the utility of the present data in suggesting that the kinetics of plasma drug can be used to predict the frequency of dosing in humans needs to be considered. Whether or not a compound gives prolonged occupancy is a function of the rate at which it dissociates from the receptor in vivo and this, in turn, is related to the in vivo affinity. Although the in vivo affinity of α5IA remains unknown, it does, nevertheless, have comparable in vitro affinity for recombinant human and native rat brain GABAA receptors (Dawson et al., 2006). Moreover, the similar efficacy profile of α5IA at rat and human GABAA receptors (Dawson et al., 2006) suggest that this compound interacts in a very similar manner with the benzodiazepine binding site of rat and human GABAA receptors. Consequently, it is not unreasonable to assume that the in vivo affinity of α5IA will be similar in rat and human brain and that in human brain, there would not be a slow rate of dissociation. The binding of α5IA to rat and human plasma proteins was 88% and 82% respectively (data not shown). Because the free fraction of α5IA is greater in human compared with rat plasma (18% and 12% respectively) then it might be predicted that the plasma EC50 for α5IA is less in human compared with rat. Indeed, this appears to be the case as the EC50 in man, as measured using [11C]flumazenil PET, is 10 ng·mL−1 (B. Langstrom and M. Bergstrom, unpubl. obs., Uppsala, Sweden).
In conclusion, we have shown that the plasma drug concentrations of α5IA required to give 50% inhibition of GABAA receptors were similar whether measured in rat using [3H]flumazenil in vivo binding or in rhesus monkey using [123I]iomazenil γ-scintigraphy (52 and 57 ng·mL−1 respectively). Moreover, the pharmacodynamic response (receptor occupancy) follows the plasma pharmacokinetic profile and demonstrates that, at least in rats, α5IA does not have a slow in vivo off-rate nor, therefore, sustained occupancy and that plasma α5IA concentrations are a surrogate for GABAA receptor occupancy.
Glossary
Abbreviations:
- α5IA
3-(5-methylisoxazol-3-yl)-6-[(1-methyl-1,2,3-triazol-4-yl)methyloxy]-1,2,4-triazolo[3,4-a]phthalazine
- α5IA-II
3-(5-methylisoxazol-3-yl)-6-[(2-pyridyl)methyloxy]-1,2,4-triazolo[3,4-a]phthalazine
- flumazenil
8-fluoro 5,6-dihydro-5-methyl-6-oxo-4H-imidazo[1,5-a][1,4]benzodiazepine-3-carboxylic acid ethyl ester
- iomazenil
ethyl 5,6-dihydro-7-iodo-5-methyl-6-oxo-4H-imidazo[1,5-a][1,4]benzodiazepine-3-carboxylic acid ethyl ester
- LC-MS/MS
liquid chromatography–tandem mass spectrometry
- Occ50
dose required to produce 50% occupancy
- PET
positron emission tomography
- SPECT
single-photon emission computed tomography
Conflict of interest
The authors state no conflict of interest.
References
- Atack JR, Smith AJ, Emms F, McKernan RM. Regional differences in the inhibition of mouse in vivo[3H]Ro 15-1788 binding reflect selectivity for α1 versus α2 and α3 subunit-containing GABAA receptors. Neuropsychopharmacol. 1999;20:255–262. doi: 10.1016/S0893-133X(98)00052-9. [DOI] [PubMed] [Google Scholar]
- Atack JR, Wafford KA, Tye SJ, Cook SM, Sohal S, Pike A, et al. TPA023 [7-(1,1-dimethylethyl)-6-(2-ethyl-2H-1,2,4-triazol-3-ylmethoxy)-3-(2-fluorophenyl)-1,2,4-triazolo[4,3-b]pyridazine], an agonist selective for α2- and α3-containing GABAA receptors, is a nonsedating anxiolytic in rodents and primates. J Pharmacol Expt Therap. 2006;316:410–422. doi: 10.1124/jpet.105.089920. [DOI] [PubMed] [Google Scholar]
- Atack JR, Scott-Stevens P, Beech JS, Fryer TD, Hughes JL, Cleij MC, et al. Comparison of lorazepam [7-chloro-5-(2-chlorophenyl)-1,3-dihydro-3-hydroxy-2H-1,4-benzodiazepin-2-one] occupancy of rat brain γ-aminobutyric acidA receptors measured using in vivo[3H]flumazenil (8-fluoro 5,6-dihydro-5-methyl-6-oxo-4H-imidazo[1,5-α][1,4]benzodiazepine-3-carboxylic acid ethyl ester) binding and [11C]flumazenil micro-positron emission tomography. J Pharmacol Expt Therap. 2007;320:1030–1037. doi: 10.1124/jpet.106.114884. [DOI] [PubMed] [Google Scholar]
- Beer HF, Bläuenstein PA, Hasler PH, Delaloye B, Riccabona G, Bangerl I, et al. In vitro and in vivo evaluation of iodine-123-Ro 16-0154: a new imaging agent for SPECT investigations of benzodiazepine receptors. J Nucl Med. 1990;31:1007–1014. [PubMed] [Google Scholar]
- Brouillet E, Chavoix C, Bottlaender M, Khalili-Varasteh M, Hantraye P, Fournier D, et al. In vivo bidirectional modulatory effect of benzodiazepine receptor ligands on GABAergic transmission evaluated by positron emission tomography in non-human primates. Brain Res. 1991;557:167–176. doi: 10.1016/0006-8993(91)90131-e. [DOI] [PubMed] [Google Scholar]
- Collinson N, Atack JR, Laughton P, Dawson GR, Stephens DN. An inverse agonist selective for α5 subunit-containing GABAA receptors improves encoding and recall but not consolidation in the Morris water maze. Psychopharmacology. 2006;188:619–628. doi: 10.1007/s00213-006-0361-z. [DOI] [PubMed] [Google Scholar]
- Dawson GR, Maubach KA, Collinson N, Cobain M, Everitt BJ, MacLeod AM, et al. An inverse agonist selective for α5 subunit-containing GABAA receptors enhances cognition. J Pharmacol Expt Therap. 2006;316:1335–1345. doi: 10.1124/jpet.105.092320. [DOI] [PubMed] [Google Scholar]
- Goeders NE, Kuhar MJ. Benzodiazepine receptor binding in vivo with [3H]-Ro 15-1788. Life Sci. 1985;37:345–355. doi: 10.1016/0024-3205(85)90505-3. [DOI] [PubMed] [Google Scholar]
- Gründer G, Yokoi F, Offord SJ, Ravert HT, Dannals RF, Salzmann JK, et al. Time course of 5-HT2A receptor occupancy in the human brain after a single oral dose of the putative antipsychotic drug MDL 100 907 measured by positron emission tomography. Neuropsychopharmacology. 1997;17:175–185. doi: 10.1016/S0893-133X(97)00044-4. [DOI] [PubMed] [Google Scholar]
- Hantraye P, Kaijima M, Prenant C, Guibert B, Sastre J, Crouzel M, et al. Central type benzodiazepine binding sites: a positron emission tomography study in the baboon's brain. Neurosci Lett. 1984;48:115–120. doi: 10.1016/0304-3940(84)90005-3. [DOI] [PubMed] [Google Scholar]
- Hosoi R, Kobayashi K, Watanabe Y, Inoue O. Discrepancy of benzodiazepine receptor occupancy between 3H-flumazenil and 125I-iomazenil in intact mouse brain. J Neural Transm. 1999;106:243–256. doi: 10.1007/s007020050154. [DOI] [PubMed] [Google Scholar]
- Hunkeler W, Möhler H, Pieri L, Polc P, Bonetti EP, Cumin R, et al. Selective antagonists of benzodiazepines. Nature. 1981;290:514–516. doi: 10.1038/290514a0. [DOI] [PubMed] [Google Scholar]
- Innis R, Zoghbi S, Johnson E, Woods S, Al-Tikriti M, Baldwin R, et al. SPECT imaging of the benzodiazepine receptor in non-human primate brain with [123I]Ro 16-0154. Eur J Pharmacol. 1991a;193:249–252. doi: 10.1016/0014-2999(91)90043-p. [DOI] [PubMed] [Google Scholar]
- Innis RB, al-Tikriti MS, Zoghbi SS, Baldwin RM, Sybirska EH, Laruelle MA, et al. SPECT imaging of the benzodiazepine receptor: feasibility of in vivo potency measurements from stepwise displacement curves. J Nucl Med. 1991b;32:1754–1761. [PubMed] [Google Scholar]
- Inoue O, Hosoi R, Kobayashi K, Itoh T, Gee A, Suzuki K. Different sensitivities to competitive inhibition of benzodiazepine receptor binding of 11C-iomazenil and 11C-flumazenil in rhesus monkey brain. Ann Nucl Med. 2001;15:137–139. doi: 10.1007/BF02988604. [DOI] [PubMed] [Google Scholar]
- Johnson EW, Woods SW, Zoghbi S, McBride BJ, Baldwin RM, Innis RB. Receptor binding characterization of the benzodiazepine radioligand 125I-Ro16-0154: potential probe for SPECT brain imaging. Life Sci. 1990;47:1535–1546. doi: 10.1016/0024-3205(90)90182-q. [DOI] [PubMed] [Google Scholar]
- Laruelle M, Abi-Dargham A, Rattner Z, Al-Tikriti MS, Zea-Ponce Y, Zoghbi S, et al. Single photon emission tomography measurement of benzodiazepine receptor number and affinity in primate brain: a constant infusion paradigm with [123I]Iomazenil. Eur J Pharmacol. 1993;230:119–123. doi: 10.1016/0014-2999(93)90421-d. [DOI] [PubMed] [Google Scholar]
- Laruelle M, Abi-Dargham A, al-Tikriti Baldwin MS, Zea-Ponce RM, Zoghbi Y, Charney SS, et al. SPECT quantification of [123I]iomazenil binding to benzodiazepine receptors in nonhuman primates: II. Equilibrium analysis of constant infusion experiments and correlation with in vitro parameters. J Cereb Blood Flow Metab. 1994;14:453–465. doi: 10.1038/jcbfm.1994.56. [DOI] [PubMed] [Google Scholar]
- Li J, Fish RL, Cook SM, Tattersall FD, Atack JR. Comparison of in vivo and ex vivo[3H]flumazenil binding assays to determine occupancy at the benzodiazepine binding site of rat brain GABAA receptors. Neuropharmacology. 2006;51:168–172. doi: 10.1016/j.neuropharm.2006.03.020. [DOI] [PubMed] [Google Scholar]
- McBride BJ, Baldwin RM, Kerr JM, Wu JL. A simple method for the preparation of 123I and 125I labeled iodobenzodiazepines. Appl Radiat Isot. 1991;42:173–175. [Google Scholar]
- Malizia AL, Forse G, Haida A, Gunn R, Melichar J, Poole K, et al. A new human (psycho)pharmacology tool: the multiple organs coincidences counter (MOCC) J Psychopharmacol. 1995;9:294–306. doi: 10.1177/026988119500900402. [DOI] [PubMed] [Google Scholar]
- Malizia AL, Gunn RN, Wilson SJ, Waters SH, Bloomfield PM, Cunningham VJ, et al. Benzodiazepine site pharmacokinetic/pharmacodynamic quantification in man: direct measurement of drug occupancy and effects on the human brain in vivo. Neuropharmacology. 1996;35:1483–1491. doi: 10.1016/s0028-3908(96)00072-x. [DOI] [PubMed] [Google Scholar]
- Millet P, Graf C, Buck A, Walder B, Ibanez V. Evaluation of the reference tissue models for PET and SPECT benzodiazepine binding parameters. Neuroimage. 2002;17:928–942. [PubMed] [Google Scholar]
- Nutt DJ, Besson M, Wilson SJ, Dawson GR, Lingford-Hughes AR. Blockade of alcohol's amnestic activity in humans by an α5 subtype benzodiazepine receptor inverse agonist. Neuropharmacol. 2007;53:810–820. doi: 10.1016/j.neuropharm.2007.08.008. [DOI] [PubMed] [Google Scholar]
- Olsson H, Farde L. Half-life of receptor occupancy – a meaningless concept. Int J Neuropsychopharmacol. 2005;8:141–142. doi: 10.1017/S1461145704004766. [DOI] [PubMed] [Google Scholar]
- Persson A, Ehrin E, Eriksson L, Farde L, Hedström CG, Litton JE, et al. Imaging of [11C]-labelled Ro 15-1788 binding to benzodiazepine receptors in the human brain by positron emission tomography. J Psychiatr Res. 1985;4:609–622. doi: 10.1016/0022-3956(85)90080-9. [DOI] [PubMed] [Google Scholar]
- Savic I, Widen L, Stone-Elander S. Feasibility of reversing benzodiazepine tolerance with flumazenil. Lancet. 1991;337:133–137. doi: 10.1016/0140-6736(91)90799-u. [DOI] [PubMed] [Google Scholar]
- Schofield CM, Harrison NL. Transmembrane residues define the action of isoflurane at the GABAA receptor alpha-3 subunit. Brain Res. 2005;1032:30–35. doi: 10.1016/j.brainres.2004.11.002. [DOI] [PubMed] [Google Scholar]
- Sieghart W. Structure and pharmacology of γ-aminobutyric acidA receptor subtypes. Pharmacol Rev. 1995;47:181–234. [PubMed] [Google Scholar]
- Sternfeld F, Carling RW, Jelley RA, Ladduwahetty T, Merchant KJ, Moore KW, et al. Selective, orally active γ-aminobutyric acidAα5 receptor inverse agonists as cognition enhancers. J Med Chem. 2004;47:2176–2179. doi: 10.1021/jm031076j. [DOI] [PubMed] [Google Scholar]
- Sybirska E, Seibyl JP, Bremner JD, Baldwin RM, al-Tikriti Bradberry MS, Malison C, et al. 123I]iomazenil SPECT imaging demonstrates significant benzodiazepine receptor reserve in human and nonhuman primate brain. Neuropharmacol. 1993;32:671–680. doi: 10.1016/0028-3908(93)90080-m. [DOI] [PubMed] [Google Scholar]
- Takano A, Suhara T, Ikoma Y, Yasuno F, Maeda J, Ichimiya T, et al. Estimation of the time-course of dopamine D2 receptor occupancy in living human brain from plasma pharmacokinetics of antipsychotics. Int J Neuropsychopharmacol. 2004;7:19–26. doi: 10.1017/S1461145703003912. [DOI] [PubMed] [Google Scholar]
- Tauscher J, Jones C, Remington G, Zipursky RB, Kapur S. Significant dissociation of brain and plasma kinetics with antipsychotics. Mol Psychiatry. 2002;7:317–321. doi: 10.1038/sj.mp.4001009. [DOI] [PubMed] [Google Scholar]