Summary
MOA, a lectin isolated from the fruiting bodies of the mushroom Marasmius oreades, specifically binds non-reducing terminal Galα(1,3)Gal-carbohydrates, such as occurs in the xenotransplantation epitope Galα(1,3)Galβ(1,4)GlcNAc and the branched blood group B determinant Galα(1,3)[Fucα(1,2)]Gal. Here, we present the crystal structure of MOA in complex with the blood group B trisaccharide solved at 1.8 Å resolution. To our knowledge, this is the first blood group B specific structure reported in complex with a blood group B determinant. The carbohydrate ligand binds to all three binding sites of the N-terminal β-trefoil domain. Also, in this work Ca2+ was included in the crystals, and binding of Ca2+ to the MOA homodimer alters the conformation of the C-terminal domain by opening up the cleft containing a putative catalytic site.
Keywords: carbohydrate recognition, fungal agglutinin, protein-carbohydrate interaction, X-ray crystal structure, blood group recognition
Introduction
In the early 1950s, a substance from the fairy ring mushroom Marasmius oreades was shown to agglutinate human type B erythrocytes1,2. The active substance was later identified as the lectin MOA (Marasmius oreades agglutinin) - a dimer of 293-residue protomers isolated from the fruiting bodies of the mushroom3,4. MOA has been shown to specifically recognize the carbohydrate Galα(1,3)Gal present on human blood group B structures and in the so-called xenotransplantation epitope3,5,6.
The blood groups of the ABH system are determined by specific carbohydrate structures presented on the cell surface of the erythrocytes. Lectins have become important tools in the identification of the different blood groups since they are proteins with high specificity for particular carbohydrates and their multivalent binding sites can agglutinate the red blood cells. There are only few lectins reported to be specific for blood group B structures and MOA is one of them. Other lectins having this characteristic are the lectin GS-I-B4 from the plant Griffonia simplicifolia7, a lectin from the red algae Ptilota plumosa8 and a lectin from the eggs of the fish Plecoglossus altivelis9. Of those, only the GS-I-B4 lectin has been structurally characterized10,11.
We have earlier determined the crystal structure of MOA in complex with the xenotransplantation epitope Galα(1,3)Galβ(1,4)GlcNAc. The structure revealed that the protein has two distinct domains – an N-terminal lectin domain with a ricinB fold (also known as a β-trefoil fold) exhibiting three distinct carbohydrate-binding subdomains and a C-terminal domain involved in dimer formation, which displays some features resembling catalytically active proteins12. Here, we present the crystal structure of MOA in complex with the branched blood group B trisaccharide Galα(1,3)[Fucα(1,2)]Gal to 1.8 Å resolution. This structure shows well-defined electron density for the trisaccharide ligand in all three distinct binding sites on each protomer. The binding of two Ca2+ ions as a binuclear center close to the hypothetical active site in the C-terminal domain causes a conformational change within this domain that changes the surface of the dimer, creating a flat surface and a large cleft facing the potential active site.
Results and Discussion
Quality of the structure
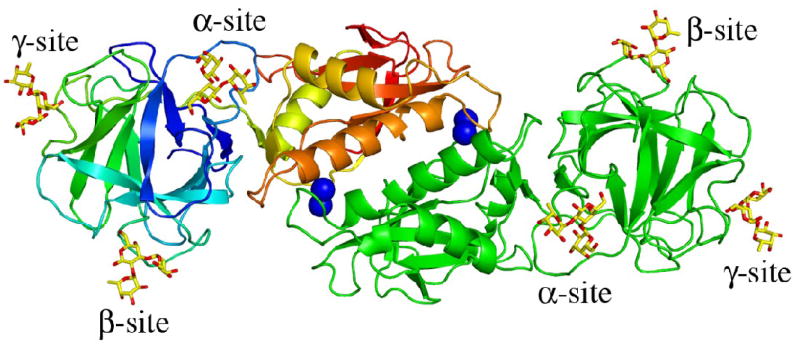
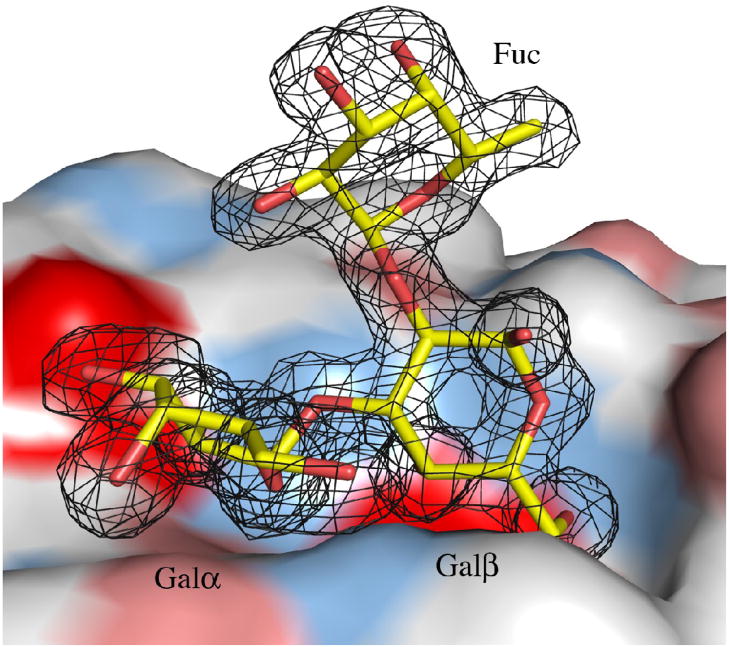
The structure of MOA in complex with the branched blood group B trisaccharide Galα(1,3) [Fucα(1,2)]Gal has been determined. The complex was crystallized in space group P3 and the structure was solved to 1.8 Å resolution (Table 1). MOA forms a homodimer (Figure 1(a)) and the asymmetric unit contains four MOA protomers arranged as two dimers. The electron density map is of good quality and was easily interpretable for both protein and carbohydrate (Figure 1(b)). Exceptions are the side chain of Asn55 for which no electron density is visible and a break between residues Gly205 and Ser206 in the otherwise continuous electron density. Included in the final model are 12 trisaccharide molecules, 16 Ca2+ ions, of which 8 are tightly bound at the dimer interfaces as binuclear centers, 4 acetate ions, 1259 water molecules as well as residues 2-293 of the four protein molecules. The first residue (Met1) is not included in the model since it is only partly visible in the electron density map. The four protein molecules are essentially identical and the root mean square distances (r.m.s.d.) between the Cα-atoms vary between 0.036 and 0.038 Å when pair-wise comparing the four protomers (named A, B, C and D). In this text, only molecule A or the A/B dimer are discussed if not stated otherwise.
Table 1.
Data collection and refinement statistics
| Data collection | MOA in complex with Galα (1,3)[Fucα (1,2)]Gal |
|---|---|
| Space group | P3 |
| Cell parameters | |
| a, b, c (Å) | 121.3, 121.3, 100.0 |
| α β γ (°) | 90, 90, 120 |
| Wavelength (Å) | 0.934 |
| Resolution (Å) | 47-1.8 (1.9-1.8) |
| Rmerge (%) | 10.9 (47.1) |
| I / σI | 12.5 (3.3) |
| Completeness (%) | 99.2 (98.2) |
| Multiplicity | 8.8 (5.1) |
| Refinement | |
| Resolution (Å) | 30-1.8 |
| No. unique reflections | 143810 |
| Rwork / Rfree (%) | 16.4/18.9 |
| R.m.s deviations from ideal values30 | |
| Bond lengths (Å) | 0.012 |
| Bond angles (Å) | 1.41 |
| Average/Wilson B-factor (Å2) | 11.8/13.5 |
| Real space correlation coefficient | 0.95 |
| Ramachandran outliers (%)1 | 2.5 |
| PDBid | 3EF2 |
Values for the highest resolution shell are shown in parenthesis.
Ramachandran analysis performed as described31.
Figure 1.
MOA in complex with the blood group B determinant. (a) Schematic representation of the MOA homodimer. One protomer is colored green and the other changing color from blue at the N-terminus to red at the C-terminus. The four calcium ions bound as binuclear centers at the dimer interface are represented by dark blue spheres and the bound blood group B trisaccharide molecules as yellow stick-models. (b) The surface of the γ-site is depicted together with the trisaccharide Galα(1,3)[Fucα(1,2)]Gal shown as a stick-model. The final 2FO−FC electron density map (contoured at 1.0σ) is shown for the carbohydrate. The protein surface is colored red for negative charges, white for hydrophobic residues, light blue for polar nitrogens and pink for polar oxygens. All figures were made using PyMoL [http://pymol.sourceforge.net/].
Carbohydrate binding
The N-terminal domain of MOA (residues 2-156) adopts a β-trefoil fold as found in many carbohydrate-binding proteins. The pseudo three-fold symmetry of the β-trefoil fold creates three potential carbohydrate binding sites, referred to as α, β and γ. When comparing the protein structure of this domain for the two available MOA structures (the complex with the xenotransplantation epitope Galα(1,3)Galβ(1,4)GlcNAc, PDBid 2IHO and the complex with the blood group B trisaccharide Galα(1,3)[Fucα(1,2)]Gal, PDBid 3EF2), it is found that the overall conformation of the N-terminal domain is preserved irrespective of which sugar molecule is bound (r.m.s.d. = 0.2 Å when comparing all Cα-atoms of the domain).
In the structure of the xenotransplantation complex, carbohydrate binding was found to be strongest to the α-site, second strongest to the β-site and weakest to the γ-site where no carbohydrate molecule was included in the model12. In the structure of the blood group B complex the electron density map is continuous, strong and easily interpretable in all three binding sites and all three trisaccharide molecules have accordingly been included in the model. All carbohydrates are modeled with the occupancy 1.0 and when comparing the average temperature factors for the trisaccharide, it is lowest for the α-site, second lowest for the γ-site and highest for the β-site (Table 2).
Table 2.
Average temperature factors (Å2) for the carbohydrates
| α-site | β-site | γ-site | |
|---|---|---|---|
| Galα | 6.0 | 13.5 | 9.5 |
| Galβ | 6.9 | 11.8 | 8.4 |
| Fuc | 11.5 | 19.1 | 17.9 |
| Trisaccharide | 8.1±0.1 | 14.8±0.1 | 12.2±0.2 |
The average values for the three sugar residues are calculated for the ligands bound to the A-protomer, while the values for the trisaccharides are average values over all four protomers.
The structure of the branched blood group B trisaccharide alone has been studied both by X-ray crystallography and by NMR13. The agreement between the two structures was excellent indicating nearly identical conformations in solution and in the crystal13. The same preferred conformation of this relatively rigid carbohydrate molecule is observed also when it is bound to MOA as reported here. A superimposition shows that the bound and unbound structures have almost identical conformations and the glycosidic torsion angles are also similar (Table 3).
Table 3.
Glycosidic torsion angles
| Galα(1,3)Gal | Fucα (1,2)Gal | |||
|---|---|---|---|---|
| ϕ | ψ | ϕ | ψ | |
| MOA α-site | 46.8° | 64.1° | 304° | 275° |
| MOA β-site | 44.7° | 66.7° | 295° | 252° |
| MOA γ-site | 50.5° | 60.2° | 291° | 237° |
| PDBid 2OBT14 | 54.1° | 99.0° | 287° | 238° |
| PDBid 2VNO-115 | 66.4° | 59.8° | 285° | 261° |
| PDBid 2VNO-215 | 72.6° | 57.0° | 284° | 257° |
| Trisaccharide13 | 56.3° | 60.0° | 294° | 269° |
Glycosidic torsion angles (ϕ: O5-C1-O-Cx′ and ψ: C1-O-Cx′-Cx+1′) calculated for the two glycosidic linkages in Galα(1,3)[Fucα(1,2)]Gal. Shown are values for the trisaccharide bound at the three distinct sites in MOA, for the trisaccharide bound to norovirus14, for the trisaccharide bound at two sites in the Clostridium perfringens CBM15 and for the unbound trisaccharide13.
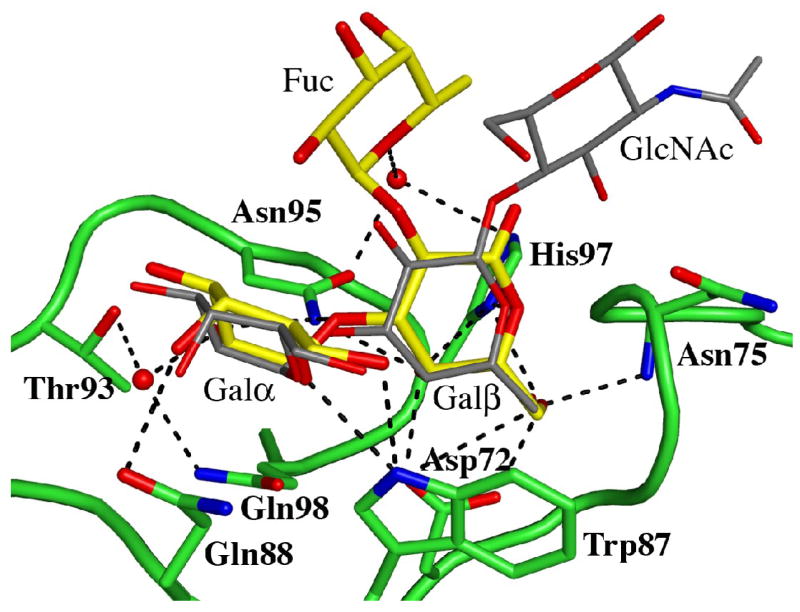
MOA specifically recognizes Galα(1,3)Gal-terminating carbohydrates and the two galactose residues are bound in extended shallow grooves on the MOA surface. The binding of the two galactose residues to the α- and β-sites is very similar to what was observed for the xenotransplantation trisaccharide when comparing the conformations of the sugar rings, the number of interactions formed with the protein and the interaction distances (Figure 2(a)). In the γ-site, where no sugar molecule was modeled in the xenotransplantation complex structure, the two galactose residues bind analogous to the binding in the β-site, but with slightly shorter bond lengths and a few more direct contacts to the protein. Superimposition of the two galactose residues of the Galα(1,3)Galβ(1,4)GlcNAc trisaccharide onto the two corresponding galactose residues of Galα(1,3)[Fucα(1,2)]Gal indicate no steric hindrance that could explain the weak binding to the γ-site in the xenotransplantation epitope complex structure. However, in the present P3 crystal form, the sugar bound in the γ-site is involved in water-mediated crystal packing contacts with a neighboring protein molecule within the crystal, which may explain the improved binding of the ligand to the γ-site compared to the structure published earlier.
Figure 2.
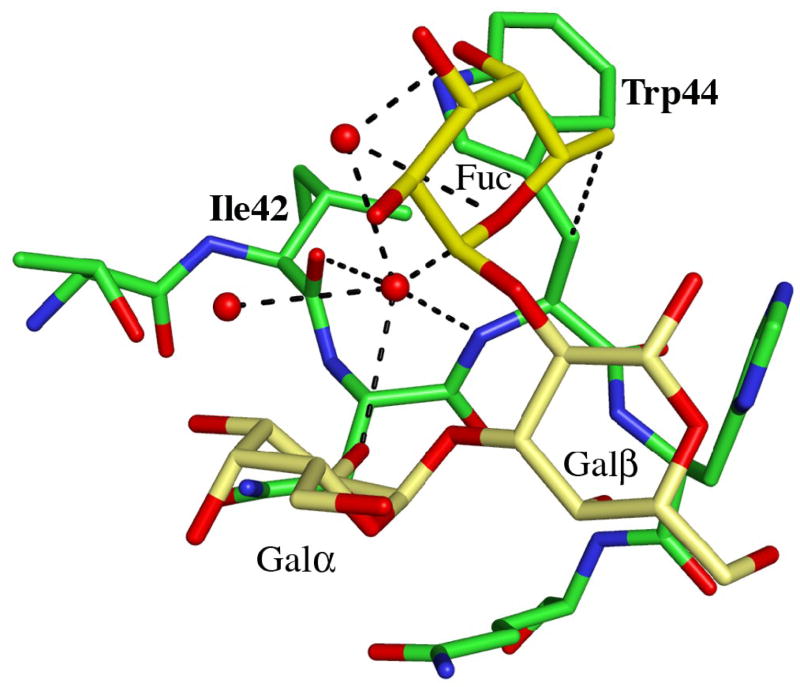
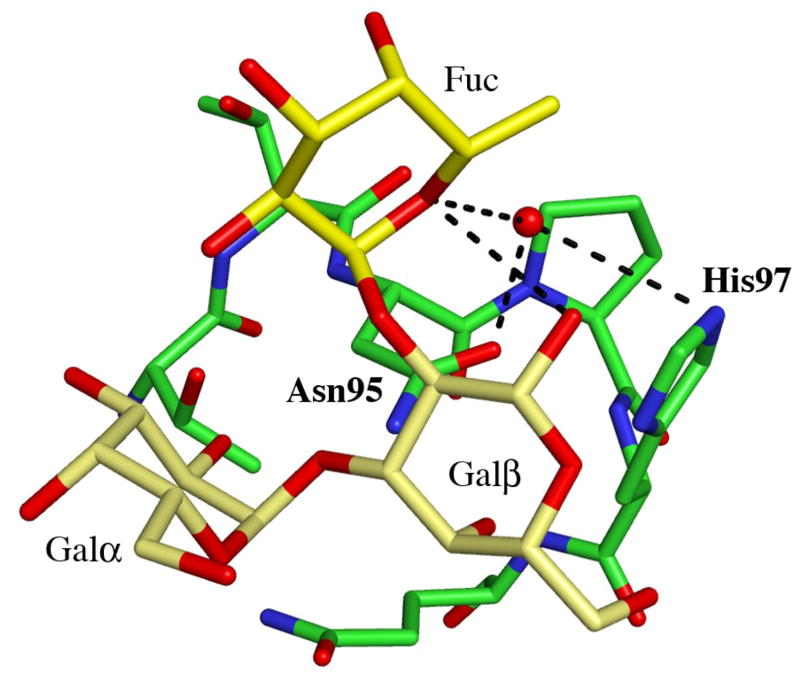
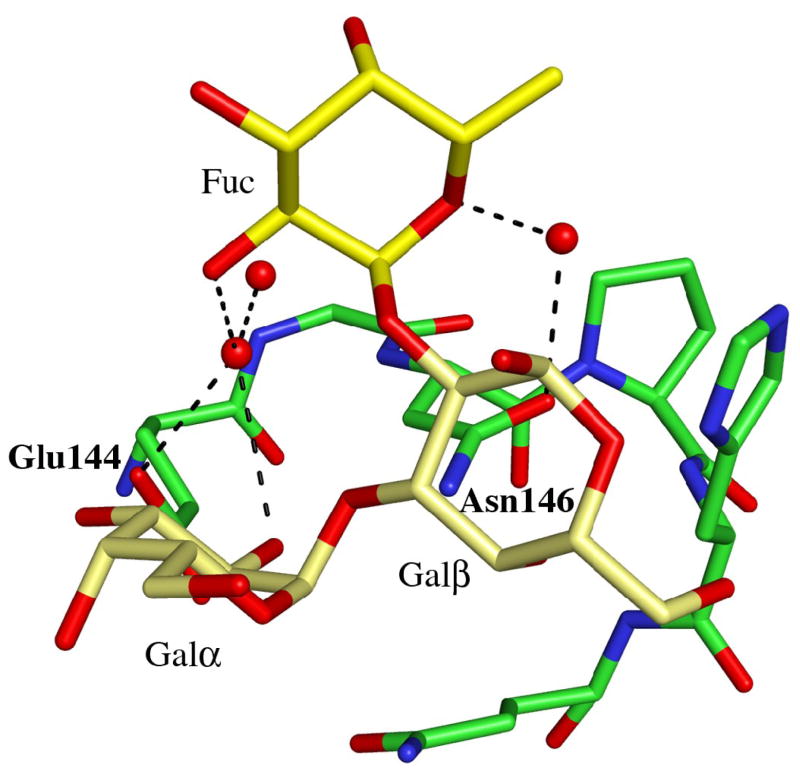
Details of the blood group B binding sites. (a) The blood group B trisaccharide (yellow) bound to the β-site. Direct and indirect hydrogen bonds between the ligand and the protein are indicated by dashed lines (cut-off at 3.4 Å). For comparison, the xenotransplantation epitope trisaccharide (gray), PDBid 2IHO, is superimposed onto the binding site. (b)–(d) The interactions provided by the fucose residue are indicated by dashed lines, hydrogen bonds with a cut-off at 3.4 Å and C-C interactions with a cut-off at 4.0 Å for (b) the α-site, (c) the β-site and (d) the γ-site, respectively. Water molecules are represented as red spheres.
Adding an L-fucosyl group to Galα(1,3)Gal to afford the branched blood group B trisaccharide Galα(1,3)[Fucα(1,2)]Gal has been reported to enhance the binding affinity to MOA 5-fold3. In the complex between MOA and the blood group B trisaccharide the fucose is pointing away from the protein surface. There are no direct hydrogen bonds between the fucose atoms and the protein in any of the binding sites. The only potential intra-carbohydrate hydrogen bond involving a fucose residue is formed between fucose O5 and Galβ O1 in the β-site (distance 3.3 Å), however, there are strong intra-carbohydrate van der Waals contacts (≤ 4 Å) between the fucose and foremost Galα. The shortest distance (3.9 Å) between the fucose and the protein is found in the α-site (Figure 2(b)) - this is the carbon-carbon distance from C6 of the fucose to Cβ of Trp44. In addition, all three binding sites exhibit significant water-mediated interactions involving the fucose: In the α-site, a water molecule within hydrogen bonding distance (3.2Å) from fucose O5 is also situated within hydrogen bonding distance (3.1 Å) to the amino nitrogen of Trp44 (Figure 2(b); Table 4). In the β-site (Figure 2(c)), none of the fucose atoms is closer to the protein than 4.6 Å, but there is a strong indirect interaction between the fucose O5, a water molecule and Asn95 Oδ1 (distances are 2.9 Å between O5 and the water molecule and 2.8 Å between the water molecule and the protein). The situation in the γ-site (Figure 2(d)) is very similar to the one in the β-site, with no fucose-protein distances being shorter than 4.5 Å. Here, two water molecules mediate hydrogen bonds to the protein. The first water molecule simultaneously binds to fucose O5 and to Oδ1 of Asn146 (both distances being 2.8 Å) and the second water molecule binds to the fucose O2 and to Glu144 Oε1 (with distances of 2.9 Å each). According to Winter et al.3, the increase in binding affinity due to the fucose residue has both enthalpic and entropic contributions. Based on the crystal structure reported here, these contributions are likely to result mainly from water-mediated interactions and prestabilization of the branched structure due to strong intra-carbohydrate van der Waals contacts.
Table 4.
Carbohydrate-protein/water hydrogen bonds
| α-site | β-site | γ-site | |
|---|---|---|---|
| Ligand atom | Interaction partner (distance in Å) | ||
| Fuc | |||
| Fuc O1 | WaterA (3.1) | - | - |
| Fuc O2 | WaterA (2.8) | Water (2.5) | Water (2.5) |
| Water (2.8) | WaterF (2.6) | ||
| Water (2.9)* | |||
| Fuc O3 | - | - | Water (3.0) |
| WaterF (3.1) | |||
| Fuc O4 | WaterB (2.8) | - | Water (3.1) |
| Fuc O5 | WaterB (3.2) | Water (2.9)* | Water (2.8)* |
| WaterC (3.2)* | |||
| Galβ | |||
| GalβO3 | Water (3.1) | Asn95Nδ2 (3.1) | Asn146Nδ2 (3.0) |
| GalβO4 | Asp20Oδ2 (2.6) | Asp72Oδ2 (2.7) | Asp123Oδ2 (2.6) |
| WaterD (2.8)* | Asn95Nδ2 (3.0) | Asn146Nδ2 (2.8) | |
| His45Nδ1 (3.0) | His97Nδ1 (3.0) | His148Nδ1 (3.2) | |
| GalβO5 | His45Nδ1 (3.0) | His97Nδ1 (3.2) | His148Nδ1 (3.1) |
| GalβO6 | Asp20Oδ1 (2.6) | Asp72Oδ1 (2.6) | Asp123Oδ1 (2.6) |
| Asp23N (2.8) | Asn75N (2.9) | Asn126N (2.7) | |
| His45Nδ1 (3.0) | His97Nδ1 (3.2) | His148Nδ1 (3.0) | |
| Galα | |||
| GalαO2 | Asn43Nδ2 (2.7) | Asn95Nδ2 (2.9) | Asn146Nδ2 (2.9) |
| Glu144Oε2 (2.6) | |||
| WaterC (2.9)* | WaterE (3.3) | Glu144Oε1 (3.1) | |
| WaterD (2.7)* | Water (2.7)* | Water (3.1)* | |
| GalαO3 | Asn43Nδ2 (3.1) | Glu144Oε1 (2.7) | |
| Thr38Oγ1 (2.7) | |||
| Thr38N (3.3) | Water (2.7) | Water (2.8) | |
| Water (2.7)* | WaterE (3.0) | WaterG (3.2) | |
| GalαO4 | Gln36O (3.3) | Gln88Oε1 (3.3) | Thr139Oγ1 (2.9) |
| WaterG (3.0) | |||
| GalαO5 | Trp35Nε1 (3.0) | Trp87Nε1 (2.9) | Trp138Nε1 (3.0) |
| GalαO6 | Trp35Nε1 (3.0) | Trp87Nε1 (3.0) | Trp138Nε1 (3.1) |
| WaterA (2.8) | |||
| Water (2.7)* | |||
Hydrogen bonds between carbohydrate atoms and protein/water atoms with distances < 3.4Å are listed. Water molecules also hydrogen bonding to the protein are indicated by *. When the same water molecule is involved in more than one carbohydrate interaction it is given a letter suffix.
In the β- and γ-sites there is evidence in the electron density map for binding of either anomer of the reducing galactose unit, Galβ. For each site, only the anomer having the highest occupancy is included in the model - β-Gal in the β-site and α-Gal in the γ-site. In the α-site, only the β anomer is observed.
Comparison with other Galα(1,3)[Fucα(1,2)]Gal complexes
Among the published structures deposited in the PDB to date, two protein complexes have the same bound ligand as used in this study, namely the blood group B trisaccharide Galα(1,3)[Fucα(1,2)]Gal. One structure involves the P domain from the VA387 norovirus capsid protein that utilizes human blood group antigens as receptors during the infection process14. The P domain binds both blood group A and B antigens, mainly interacting with the fucose residue common to both antigens. The other protein is the carbohydrate binding module (CBM) of an endo-β-galactosidase from the bacterium Clostridium perfringens which is virulent to both animals and humans15. This CBM also binds both blood group A and B antigens and in the complex all three sugars residues contribute to the interaction. However, no direct interactions are evident for either the 2-acetamidogroup of GalNAcα in the blood group A determinant or the O2 oxygen of the Galα in the blood group B determinant. MOA differs from these two proteins in having specificity for the blood group B determinant only because of both direct and water-mediated hydrogen bonds to the O2 oxygen of Galα. The larger acetamido group cannot be accommodated in the binding site, due to steric interference. Despite the differences in binding modes, the conformations of the trisaccharide molecules are similar (Table 3).
C-terminal domain
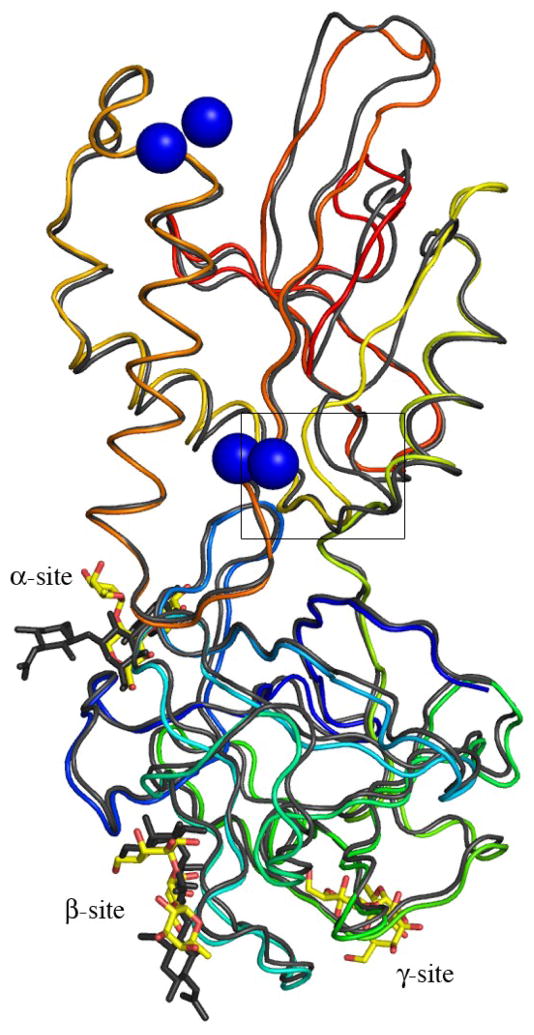
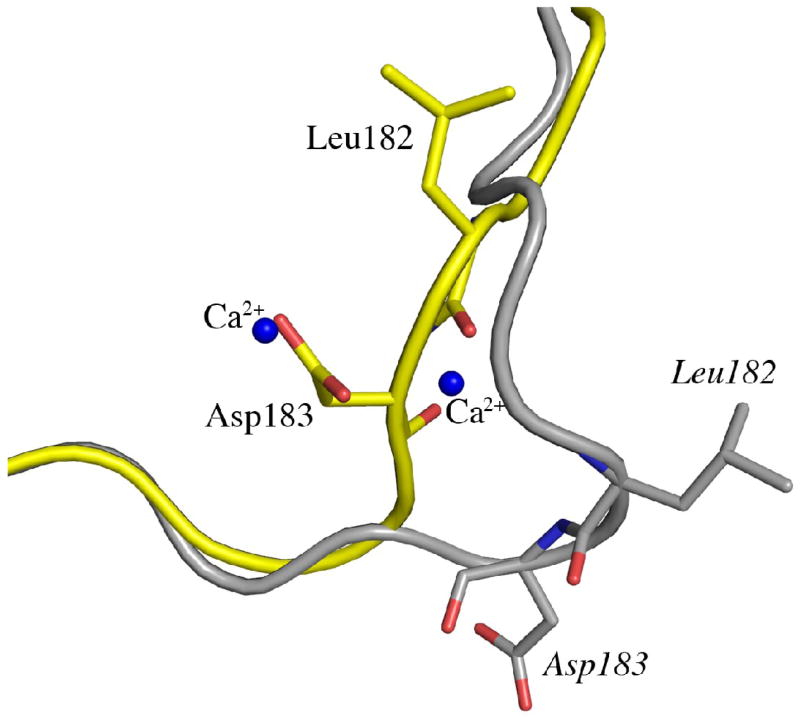
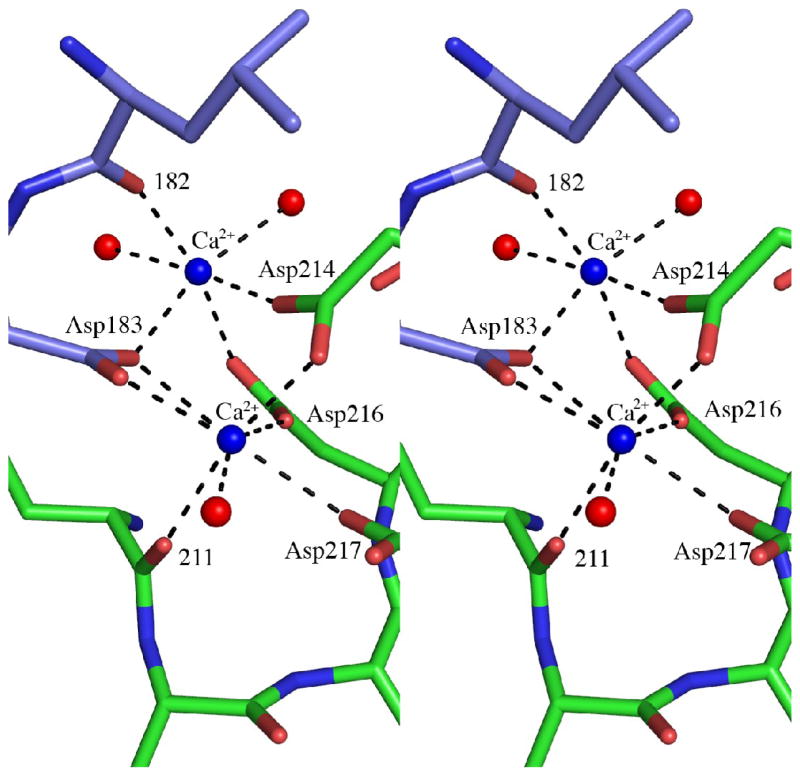
In contrast to the N-terminal domain, which is essentially identical in the two MOA structures, there is a pronounced difference in the C-terminal domain (Figure 3(a) and (b)). A structural superimposition of the C-terminal domain (residues 157-293) of the blood group B complex and the xenotransplantation epitope complex (PDBid 2IHO), gives an r.m.s.d. for the protein Cα-atoms of 1.8 Å, although, individual atoms move as much as 16 Å. The parts that differ most and that had to be completely rebuilt in the blood group B trisaccharide complex model are residues 172-184, 247-257 and 283-293. These residues form three loops that are closely juxtaposed facing the outside of the dimer. The observed structural changes in the C-terminal domain are caused by the tight and specific binding of four calcium ions bound as two binuclear centers to the dimer interface (Figures 1(a) and 3(c)). It is in particular residues 182 and 183 that completely change orientation upon calcium binding, thereby dragging the neighboring residues along (Figure 3(b)).
Figure 3.
Conformational changes induced by the binding of calcium. (a) Superimposition of MOA Cα-traces for the two ligand complexes. Only one protomer is shown for each MOA structure, however, all four calcium ions bound as two binuclear centers at the dimer interface are shown. The structure in complex with the xenotransplantation epitope Galα(1,3)Galβ(1,4)GlcNAc (no Ca2+ bound) is shown in gray and the complex with the blood group B trisaccharide Galα(1,3)[Fucα(1,2)]Gal (Ca2+ bound) is colored from blue at the N-terminus to red at the C-terminus. The Galα(1,3)Galβ(1,4)GlcNAc trisaccharides are drawn as gray stick-models and the Galα(1,3)[Fucα(1,2)]Gal trisaccharides as yellow stick-models. The calcium ions are indicated by blue spheres. (b) Close-up of a part of the protein (corresponding to residues 170-190, boxed in panel (a) to illustrate the movement of residues 182 and 183 upon calcium binding. (c) Stereo figure showing the details of the calcium coordination at the dimer interface. The calcium ions are represented as blue spheres and the interacting protein residues are shown as stick-models colored in green and blue for the two protomers, respectively. The calcium coordination is indicated by dashed lines and water molecules are depicted as red spheres.
The two calcium ions per binuclear center are located 3.85 Å apart at the dimer interface. One of the ions is coordinated by the main chain oxygen of residue 211, the carboxylates of aspartic acid residues 214, 216 and 217 from one protomer as well as aspartic acid residue 183 from the other protomer and one water molecule. The coordination is pentagonal bipyramidal (metal-donor distances < 2.5 Å) and such a coordination is commonly observed for divalent calcium ions16,17. The average temperature factor for this Ca2+ is 8.8 Å2. The second calcium ion is coordinated by the carboxylates of aspartic acid residues 214 and 216 from one protomer as well as aspartic acid residue 183 and the main chain oxygen of residue 182 from the other protomer and two water molecules, one of which having lower occupancy. This second calcium ion thus does not have a pentagonal bipyramidal coordination, but rather an octahedral one and the average temperature factor for this Ca2+ is 11.1 Å2.
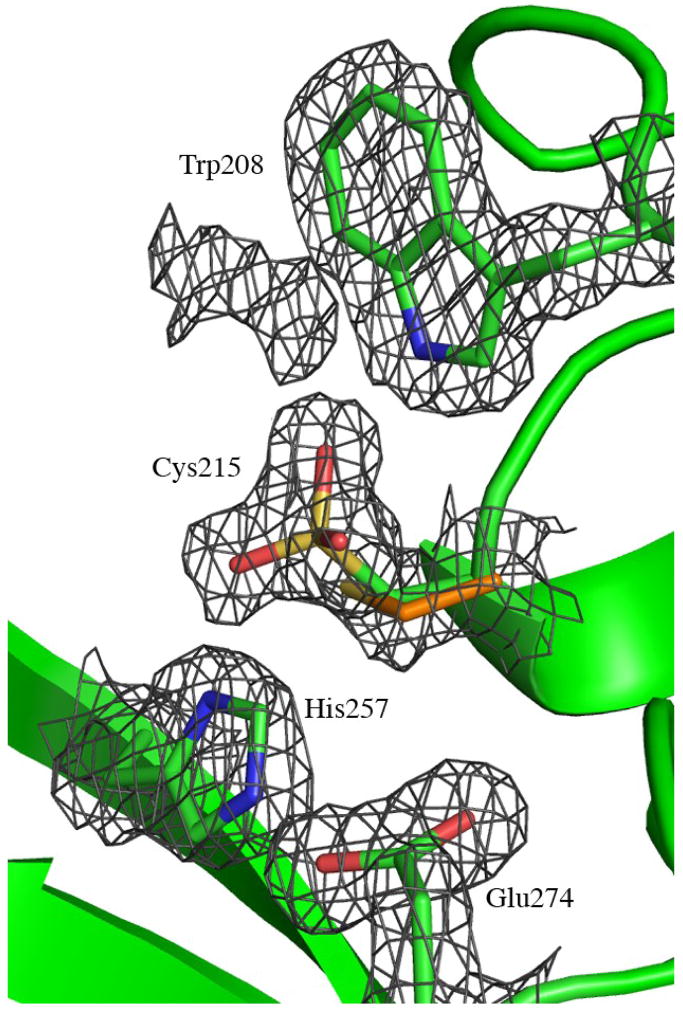
When we first solved the structure of MOA in complex with the xenotransplantation epitope (PDBid 2IHO) and the C-terminal domain was compared with structures available in the PDB, three residues in MOA where identified as members of a potential catalytic triad in a putative active site12. These three residues are Cys215, His257 and Glu274. In the structure of MOA in complex with the blood group B trisaccharide and Ca2+ those residues are found even closer to each other. The electron density map indicates that the side chain of Cys215 is oxidized in about 50% of the molecules in the crystal (Figure 4(a)). This is true for all four polypeptide chains in the asymmetric unit. In the model that has been deposited in the PDB (PDBid 3EF2), only the oxidized form is included, with occupancy 1.0.
Figure 4.
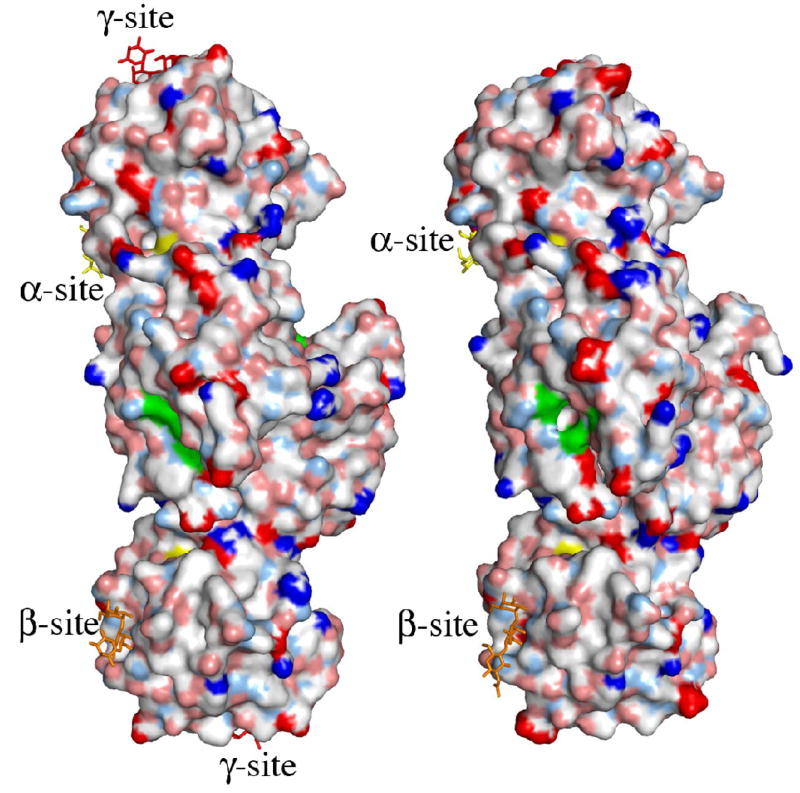
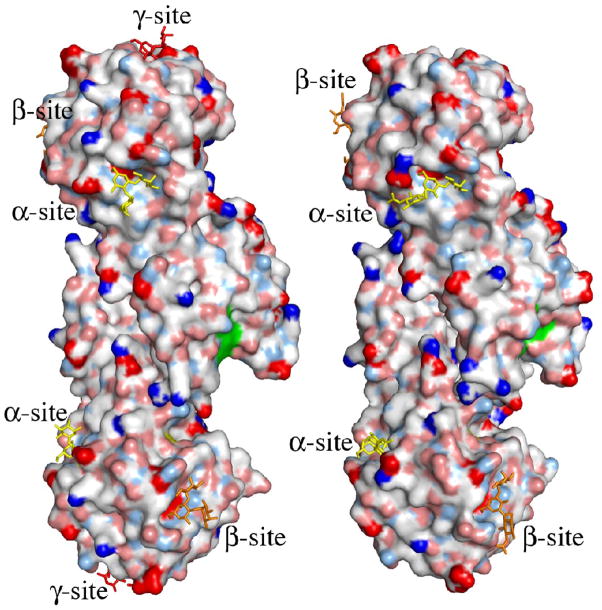
The putative active site of MOA. (a) Close-up view featuring the potential catalytic triad (residues Cys215, His257 and Glu274). The electron density map (final 2FO−FC map contoured at 1.0 σ) is shown for the protein side chains. Cys215 is oxidized in about 50% of the molecules in the crystal and depicted are both the oxidized form (green carbons) and the reduced form (orange carbons). The side chain of Trp208 and the unassigned electron density adjacent to it are also shown in this picture. (b)–(c) Surface representation of the MOA dimers, to the left the blood group B determinant complex (Ca2+ bound) and to the right the xenotransplantation epitope complex (no Ca2+ bound). Coloring scheme for the protein surface: positive charge (blue), negative charge (red), hydrophobic (white), polar N (light blue), polar O (pink) and sulfurs (yellow). The potential catalytic triad is highlighted in green and the trisaccharides are colored yellow, orange and red when bound to the α-, β- and γ-site, respectively. (b) and (c) represent two alternative views, related to each other by a 90° rotation around a vertical axis.
As a consequence of the conformational change induced by the Ca2+-binding, the surface of the MOA dimer is slightly changed and a wide and deep cleft is formed, in which the three residues of the potential catalytic triad are clustered at one side and are readily accessible (Figure 4(b) and (c)). The conformational change also affects the dimer interface. The buried surface area on each protomer upon dimer formation is reduced from 1800 Å2 in the structure without Ca2+ to 1370 Å2 in the structure with Ca2+ present. For each protomer the number of residues forming the interaction surface decreases from 49 to 39 and the number of intermolecular hydrogen bonds decreases from 21 to 19 as a result of Ca2+ binding.
Crystal packing
MOA was crystallized in complex with the trisaccharide Galα(1,3)[Fucα(1,2)]Gal. The space group of the crystals is P3, with four protomers in the asymmetric unit. The four protomers are arranged as two homodimers and the molecules are tightly packed within the crystal. Three α-sites meet at the crystallographic three-fold axis bringing the carbohydrate molecules close to each other at this axis. The O1 oxygen of Galβ is hydrogen bonding to both O2 and O3 of the fucose in the neighboring trisaccharide molecule with distances of 2.9 Å each. The involvement of this hydroxyl group in the crystal-packing interactions in the α-site explains why this galactose residue is only found as a β-anomer and not as a mixture of α- and β-anomers as observed for the carbohydrates bound in the β- and γ-sites. In the β-site there are no crystal packing interactions, whereas in the γ-site, water-mediated crystal contacts are observed. When MOA was earlier co-crystallized with the trisaccharide Galα(1,3)Galβ(1,4)GlcNAc, in space groups P21 and P3221 and in the absence of Ca2+, the same kind of homodimer was formed, but the packing of the dimers within the crystal was very different12,18.
Implications
MOA has been shown to have high affinity for non-reducing terminal Galα(1,3)Gal carbohydrates, especially the xenotransplantation epitope Galα(1,3)Galβ(1,4)GlcNAc and the blood group B determinant Galα(1,3)[Fucα(1,2)]Gal3,5,6. Now the crystal structures of MOA in complex with both these trisaccharides have been solved. For the complex with the xenotransplantation epitope Galα(1,3)Galβ(1,4)GlcNAc, differences in binding were observed for the three binding sites12. For the blood group B trisaccharide Galα(1,3) [Fucα(1,2)]Gal complex on the other hand, the electron density indicates uniform binding of the trisaccharide to all three binding sites. This shows that all three sites are capable of binding the carbohydrate ligand, despite the slight differences in the protein surfaces of the three sites.
Unexpectedly, the P3 crystal form of MOA presented in this work was found to bind calcium ions. This was not the case for the earlier crystal forms, which did not contain calcium in the crystallization buffers. Binding of metals is a common theme in proteins. They can stabilize the protein 3D-structure by neutralizing charges in the protein and thereby bringing different parts of the protein closer together than what would be possible otherwise. In addition, many enzymes use metals for their catalytic activities. Ca2+ is often found both as a stabilizer of the structure and as a trigger inducing conformational changes upon sensing the calcium concentration in the environment19,20.
The biological function of MOA is still unknown. When the first crystal structure of the protein was solved we suggested that the C-terminal domain of the protein might have an enzymatic function in addition to the well-known carbohydrate binding properties of the N-terminal domain12. In the MOA structure presented here, a binuclear Ca2+ center is observed directly next to the potential active site. The calcium binding induces a conformational change of the protein that changes the surface of the dimer and opens up a cleft with a large and flat surface, which might provide the binding site for a large substrate molecule. The proposed catalytic triad (Cys215, His257 and Glu274) is situated in one corner of this cleft and the side chain of Trp208 is close to the side chain of Cys215 and may contribute to substrate binding by stacking interactions – unassigned electron density is seen adjacent to this residue in both the present and the earlier MOA structures (Figure 4(a)). The side chain of Cys215 seems to be accessible and reactive since it was observed to bind a MalNEt molecule (N-ethylmaleimide or NEM) in the earlier structure and is found to be oxidized in the present structure. It should, however, be kept in mind that no catalytic function is yet assigned to MOA and the discussion about substrates and catalytically important residues is speculative. It also needs to be shown if calcium is the preferred metal in all sites also under biological conditions.
A database search for proteins with a sequence similar to MOA, only yielded one hit – the mushroom Polyporus squamosus lectin (PSL). PSL also has an N-terminal β-trefoil domain and a C-terminal domain of unknown function21. When comparing the sequences of MOA and PSL1a, the first isoform of PSL, it is found that not only the three residues suggested to be part of a catalytic triad, but also the four aspartic acid residues taking part in the specific calcium binding and the tryptophan residue found close to the potential active site are conserved in both proteins.
In summary, we have solved the structure of MOA in complex with the branched blood group B trisaccharide and Ca2+ and compared it to the structures of other complexes binding the same ligand reported in the literature. The MOA structure stands out as the only structure specifically recognizing blood group B determinants. The specific binding to blood group B-structures is achieved by both direct and water-mediated hydrogen bonds to the O2 oxygen of Galα. Blood group A structures, which are slightly larger due to the replacement of Galα by a GalNAc residue, would not fit into the MOA binding site, due to steric interference. Binding to MOA is enhanced compared to the xenotransplantation epitope investigated earlier. According to our structural data, the additional fucosyl residue mainly contributes to the binding via water-mediated interactions. The natural ligand as well as the biological function of MOA are, however, still unknown. In this context, the chance-finding that MOA binds two Ca2+ ions in the putative active site at the dimer interface, may yield new clues as to the function of this protein. Ca2+ binding is associated with significant conformational changes in the MOA C-terminal domain, whereas the N-terminal carbohydrate-binding domain is unaffected.
Materials and methods
Isolation and purification
MOA was isolated from the fruiting bodies of Marasmius oreades and purified as described earlier3,4. The purifed protein was dialyzed against water and lyophilized before dissolving it in 10 mM Tris-HCl pH 7.5 to a protein-concentration of 20 mg/ml. The branched blood group B trisaccharide Galα(1,3)[Fucα(1,2)]Gal was purchased from Dextra Laboratories Ltd., UK and dissolved to a concentration of 10 mM in water. Protein (20 mg/ml) and sugar (10 mM) were mixed at a volume ratio of 1:1 before crystallization.
Crystallization
Small rod-shaped crystals of MOA co-crystallized with Galα(1,3)[Fucα(1,2)]Gal were obtained in 0.1 M Hepes buffer pH 6.5, 0.2 M calcium acetate and 18 % PEG8000 using the hanging-drop vapor diffusion technique at room temperature. To test if addition of various compounds could improve the crystal quality, the additive screen MD1-11 from Molecular Dynamics Ltd., UK, was employed. The largest crystals grew upon the addition of 0.02 M betaine and these crystals were used for data collection. Crystals with dimensions 0.02 mm × 0.02 mm × 0.3 mm were frozen in liquid nitrogen without the addition of any extra cryo-protectant.
Data collection, processing, scaling and structure determination
A dataset was collected at ID14-2, ESRF, Grenoble, France. The wavelength was 0.934 Å and 200 images with 1° oscillation were collected. The images were processed using MOSFLM22 and scaled with Scala23,24. Scaling statistics are given in Table 1. The crystals belong to space group P3 with cell parameters a = b = 121.3 Å and c = 100.0 Å. There are four MOA protomers in the asymmetric unit corresponding to a Matthews coefficient25 VM = 3.34 Å3/Da and a solvent content of 63 %. The structure was solved by molecular replacement with one protomer from the earlier MOA structure (PDBid 2IHO) as a search model using the program MOLREP26.
Model building and refinement
First, manual building of the parts that differed from the 2IHO structure (residues 173-184, 247-257 and 283-293) was performed in Coot27. Thereafter further rebuilding in Coot was alternated with refinement using Refmac528. Sugar molecules and calcium and acetate ions were incorporated into the model before water molecules were added using the Arp/wArp function in Refmac5 (density > 2.5 sigma). The two weakly bound ions per protomer have been modeled as Ca2+, however, their identities are ambiguous. The shape of the electron density and the coordination indicates non-water identities. The coordination is in both cases mainly oxygen-mediated with the minimum distance to the protein being 3.6 Å. Refinement statistics are given in Table 2 and for the final model Rfree = 18.9 % and Rcryst = 16.4 %. Root mean square distances have been calculated using O29.
Acknowledgments
The authors want to thank EMBIO, UiO for financial support to E.M.G., the Norwegian Research Council (grant 171631/V40; to U.K.) and the NIH (grant GM-29470; to I.J.G.) for research grants and the ESRF for providing synchrotron beamtime.
Footnotes
Accession number
The coordinates and structure factors have been deposited at the Protein Data Bank with PDBid 3EF2.
Publisher's Disclaimer: This is a PDF file of an unedited manuscript that has been accepted for publication. As a service to our customers we are providing this early version of the manuscript. The manuscript will undergo copyediting, typesetting, and review of the resulting proof before it is published in its final citable form. Please note that during the production process errors may be discovered which could affect the content, and all legal disclaimers that apply to the journal pertain.
References
- 1.Elo J, Estola E. Phytagglutinins present in Marasmius oreades. Ann Med Exp Biol Fenn. 1952;30:165–7. [PubMed] [Google Scholar]
- 2.Elo J, Estola E, Malmström N. Anticoagulants in fungi. Ann Med Exp Biol Fenn. 1953;31:82–90. [PubMed] [Google Scholar]
- 3.Winter HC, Mostafapour K, Goldstein IJ. The mushroom Marasmius oreades lectin is a blood group type B agglutinin that recognizes the Galα1,3Gal and Galα1,3Galβ1,4GlcNAc porcine xenotransplantation epitopes with high affinity. J Biol Chem. 2002;277:14996–15001. doi: 10.1074/jbc.M200161200. [DOI] [PubMed] [Google Scholar]
- 4.Kruger RP, Winter HC, Simonson-Leff N, Stuckey JA, Goldstein IJ, Dixon JE. Cloning, expression, and characterization of the Galα1,3Gal high affinity lectin from the mushroom Marasmius oreades. J Biol Chem. 2002;277:15002–5. doi: 10.1074/jbc.M200165200. [DOI] [PubMed] [Google Scholar]
- 5.Rempel BP, Winter HC, Goldstein IJ, Hindsgaul O. Characterization of the recognition of blood group B trisaccharide derivatives by the lectin from Marasmius oreades using frontal affinity chromatography-mass spectrometry. Glycoconj J. 2003;19:175–80. doi: 10.1023/A:1024297623445. [DOI] [PubMed] [Google Scholar]
- 6.Teneberg S, Alsén B, Ångström J, Winter HC, Goldstein IJ. Studies on Galα3-binding proteins: comparison of the glycosphingolipid binding specificities of Marasmius oreades lectin and Euonymus europaeus lectin. Glycobiology. 2003;13:479–86. doi: 10.1093/glycob/cwg049. [DOI] [PubMed] [Google Scholar]
- 7.Murphy LA, Goldstein IJ. Five α-D-galactopyranosyl-binding isolectins from Bandeiraea simplicifoliaseeds. J Biol Chem. 1977;252:4739–4742. [PubMed] [Google Scholar]
- 8.Rogers DJ, Blunden G, Evans PR. Ptilota plumosa, a new source of a blood-group B specific lectin. Med Lab Sci. 1977;34:193–200. [PubMed] [Google Scholar]
- 9.Sakakibara F, Kawauchi H, Takayanagi G. Blood group B-specific lectin of Plecoglossus altivelis (Ayu fish) eggs. Biochim Bophys Acta. 1985;26:103–11. doi: 10.1016/0304-4165(85)90279-x. [DOI] [PubMed] [Google Scholar]
- 10.Tempel W, Tschampel S, Woods RJ. The xenograft antigen bound to Griffonia simplicifolia lectin 1-B4. X-ray crystal structure of the complex and molecular dynamics characterization of the binding site. J Biol Chem. 2002;277:6615–21. doi: 10.1074/jbc.M109919200. [DOI] [PMC free article] [PubMed] [Google Scholar]
- 11.Lescar J, Loris R, Mitchell E, Gautier C, Chazalet V, Cox V, Wyns L, Pérez S, Breton C, Imberty A. Isolectin I-A and I-B of Griffonia (Bandeiraea) simplicifolia. J Biol Chem. 2002;277:6608–14. doi: 10.1074/jbc.M109867200. [DOI] [PubMed] [Google Scholar]
- 12.Grahn E, Askarieh G, Holmner Å, Tateno H, Winter HC, Goldstein IJ, Krengel U. Crystal structure of the Marasmius oreades mushroom lectin in complex with a xenotransplantation epitope. J Mol Biol. 2007;369:710–21. doi: 10.1016/j.jmb.2007.03.016. [DOI] [PubMed] [Google Scholar]
- 13.Otter A, Lemieux RU, Ball RG, Venot AP, Hindsgaul O, Bundle DR. Crystal state and solution conformation of the B blood group trisaccharide α-L-Fucp-(1→2)-[α-D-Galp]-(1→3) -β-D-Galp-OCH3. Eur J Biochem. 1999;259:295–303. [PubMed] [Google Scholar]
- 14.Cao S, Lou Z, Tan M, Chen Y, Liu Y, Zhang Z, Zhang XC, Jiang X, Li X, Rao Z. Structural basis for the recognition of blood group trisaccharides by norovirus. J Virology. 2007;81:5949–5957. doi: 10.1128/JVI.00219-07. [DOI] [PMC free article] [PubMed] [Google Scholar]
- 15.Gregg KJ, Finn R, Abbot DW, Boraston AB. Divergent modes of glycan recognition by a new family of carbohydrate-binding modules. J Biol Chem. 2008;283:12604–12613. doi: 10.1074/jbc.M709865200. [DOI] [PMC free article] [PubMed] [Google Scholar]
- 16.Harding MM. The geometry of metal-ligand interactions relevant to proteins. Acta Crystallogr D Biol Crystallogr. 1999;55:1432–42. doi: 10.1107/s0907444999007374. [DOI] [PubMed] [Google Scholar]
- 17.Harding MM. Geometry of metal-ligand interactions in proteins. Acta Crystallogr D Biol Crystallogr. 2001;57:401–11. doi: 10.1107/s0907444900019168. [DOI] [PubMed] [Google Scholar]
- 18.Grahn E, Holmner Å, Cronet C, Tateno H, Winter HC, Goldstein IJ, Krengel U. Crystallization and preliminary X-ray crystallographic studies of a lectin from the mushroom Marasmius oreades. Acta Crystallogr D Biol Crystallogr. 2004;60:2038–9. doi: 10.1107/S0907444904021183. [DOI] [PubMed] [Google Scholar]
- 19.Strynadka NJC, James MNG. Towards an understanding of the effects of calcium on protein structure and function. Curr Op Struct Biol. 1991;1:905–14. [Google Scholar]
- 20.McPhalen CA, Stryadka NC, James MN. Calcium-binding sites in proteins: a structural perspective. Adv Protein Chem. 1991;42:77–144. doi: 10.1016/s0065-3233(08)60535-5. [DOI] [PubMed] [Google Scholar]
- 21.Tateno H, Winter HC, Goldstein IJ. Cloning, expression in Escherichia coli and characterization of the recombinant Neu5Acα2, 6Galβ1,4GlcNAc-specific high-affinity lectin and its mutants from the mushroom Polyporus squamosus. Biochem J. 2004;382:667–75. doi: 10.1042/BJ20040391. [DOI] [PMC free article] [PubMed] [Google Scholar]
- 22.Leslie AGW. Recent changes to the MOSFLM package for processing film and image plate data. Joint CCP4 and ESF-EACBM Newsletter on Protein Crystallography. 1992;26 [Google Scholar]
- 23.Collaborative Computational Project Number 4. The CCP4 suite: programs for protein crystallography. Acta Crystallogr D. 1994;50:760–3. doi: 10.1107/S0907444994003112. [DOI] [PubMed] [Google Scholar]
- 24.Evans PR. SCALA. Joint CCP4 and ESF-EACBM. Newsletter on Protein Crystallography. 1997;33:22–4. [Google Scholar]
- 25.Matthews BW. Solvent content of protein crystals. J Mol Biol. 1968;33:491–7. doi: 10.1016/0022-2836(68)90205-2. [DOI] [PubMed] [Google Scholar]
- 26.Vagin A, Teplyakov A. MOLREP: an Automated Program for Molecular Replacement. J Appl Cryst. 1997;30:1022–5. [Google Scholar]
- 27.Emsley P, Cowtan K. Coot: model-building tools for molecular graphics. Acta Crystallogr D Biol Crystallogr. 2004;60:2126–32. doi: 10.1107/S0907444904019158. [DOI] [PubMed] [Google Scholar]
- 28.Murshudov GN, Vagin AA, Dodson EJ. Refinement of macromolecular structures by the maximum-likelihood method. Acta Crystallogr D Biol Crystallogr. 1997;53:240–55. doi: 10.1107/S0907444996012255. [DOI] [PubMed] [Google Scholar]
- 29.Jones TA, Zou J-Y, Cowan SW, Kjeldgaard M. Improved methods for building protein models in electron density maps and the location of errors in these models. Acta Crystallogr A. 1991;47:110–19. doi: 10.1107/s0108767390010224. [DOI] [PubMed] [Google Scholar]
- 30.Engh RA, Huber R. Accurate bond and angle parameters for X-ray protein structure refinement. Acta Crystallogr A. 1991;47:392–400. [Google Scholar]
- 31.Kleywegt GJ, Jones TA. Phi/Psi-chology: Ramachandran revisited. Structure. 1996;4:1395–400. doi: 10.1016/s0969-2126(96)00147-5. [DOI] [PubMed] [Google Scholar]


