

Abstract
Background. Chronic kidney disease (CKD) is associated with increased mortality in patients with heart failure (HF). However, its association with hospitalization in HF patients has not been well studied.
Methods. Of 7788 patients in the Digitalis Investigation Group trial, 3527 had CKD, defined by an estimated glomerular filtration rate (GFR) <60 ml/min/1.73 m2 body surface area (BSA). Propensity scores for CKD were calculated using a multivariable logistic regression model and used to match 2399 pairs of patients with and without CKD. Matched Cox regression analyses were used to estimate association of CKD with outcomes.
Results. All-cause hospitalization occurred in 1636 (rate, 4233/10 000 person-years) and 1587 (rate, 3733/10 000 person-years) patients respectively, with and without CKD (matched hazard ratio [HR] for CKD, 1.18, 95% confidence interval [CI], 1.08–1.29; P < 0.0001). Matched HR for cardiovascular and HF hospitalization were respectively 1.17 (95% CI, 1.06–1.28, P = 0.002) and 1.28 (95% CI, 1.13–1.45, P < 0.0001). Compared to GFR ≥60 ml/min/1.73 m2 BSA, HR for all-cause hospitalization for GFR 45–59 and <45 ml/min/1.73 m2 BSA were respectively 1.04 (95% CI, 0.94–1.16; P = 0.422) and 1.58 (95% CI, 1.34–1.87; P < 0.0001). Similarly, HR for all-cause death for GFR 45–59 and <45 ml/min/1.73 m2 BSA were respectively 1.03 (95% CI, 0.90–1.18; P = 0.651) and 1.70 (95% CI, 1.40–2.07; P < 0.0001). Matched HR for death due to cardiovascular causes and progressive HF were respectively 1.24 (95% CI, 1.09–1.40; P = 0.001) and 1.42 (95% CI, 1.16–1.72; P = 0.001).
Conclusion. CKD was associated with increased mortality and hospitalization in ambulatory patients with chronic HF, which increased progressively with worsening kidney function.
Keywords: chronic kidney disease, heart failure, hospitalization, mortality
Introduction
Heart failure (HF) is common and associated with increased mortality and hospitalization [1]. It is also the leading cause of hospitalization for the population 65 years and older. Chronic kidney disease (CKD), defined as an estimated glomerular filtration rate (GFR) <60 ml/min/1.73 m2 body surface area (BSA), is also common [2]. CKD is associated with increased mortality in patients with HF [3–7]. We have recently demonstrated that in a propensity-matched cohort of chronic HF patients, CKD was associated with increased all-cause mortality and that CKD-associated all-cause mortality was higher in diastolic than in systolic HF [4]. However, the effects of CKD on cause-specific mortality and hospitalization were not reported. The purpose of this propensity-matched study was to determine the association of CKD with all-cause and cause-specific hospitalization and cause-specific mortality in ambulatory patients with chronic HF.
Methods
Study design
We conducted a secondary analysis of the Digoxin Investigation Group (DIG) trial data. DIG was a randomized clinical trial to determine the effect of digoxin in HF [8]. Patients were recruited from 302 clinical centres in the United States (N = 186) and Canada (N = 116) over 31.5 months during 1991–1993. Detailed description of the design, patient characteristics and results of the DIG trial has been published previously [8].
Patients
DIG enrolled 7788 ambulatory chronic HF patients in normal sinus rhythm, of whom 6800 had an ejection fraction ≤45%. Patients with serum creatinine >2.5 mg/dl were excluded from the DIG trial. Most patients were receiving diuretics (78%) and ACE inhibitors (93%). Beta-blockers were not approved for HF at that time and data on beta-blockers were not collected. HF was diagnosed by symptoms, signs or radiographic evidence of HF. Baseline data on ejection fraction were obtained from all 7788 participants. Our primary analysis in this study comprised a subset of 4798 DIG patients based on a 1:1 match by the propensity score predicting the likelihood of mild-to-moderate CKD at baseline.
Kidney function
Data on baseline serum creatinine were collected at randomization from all 7788 participants. We estimated baseline GFR using the four-variable Modification of Diet in Renal Disease (MDRD) formula [9] and defined CKD as calculated GFR <60 ml/min/1.73 m2 BSA [10].
Outcomes
The primary outcome of this study was the all-cause hospitalization during a median follow-up of 38 months. Vital status was collected up to 31 December 1995 and was ascertained for 99% of the patients. Secondary outcomes included cause-specific hospitalizations and mortalities.
Statistical analysis
We used propensity scores to reduce imbalances in baseline covariate between patients with and without CKD displayed in the pre-match panel of Table 1, which shows that generally, patients with CKD were older with higher comorbidity and sickness burden. The propensity score for CKD may be defined as the conditional probability of having CKD given measured baseline covariates [4,11–16]. We calculated the propensity score for CKD for each patient using a multivariable logistic regression model (c statistic = 0.76), in which CKD (present or absent) was the outcome variable and all available baseline covariates (Table 1 and Figure 1) were used as predictors. We then used these derived propensity scores to match 2399 (68%) CKD patients with 2399 non-CKD patients who had the similar propensity scores [4,16,17].
Table 1.
Baseline patient characteristics, before and after propensity score matching
| Before matching | After matching | ||||
|---|---|---|---|---|---|
| No CKD, randoma | P-value | CKD, matched | P-value | No CKD, matched | |
| (N = 2399) | (N = 2399) | (N = 2399) | |||
| Mean (±SD) | |||||
| Age (years) | 59.9 (±11.0) | <0.0001 | 65.4 (±8.8) | 0.776 | 65.4 (±8.9) |
| Ejection fraction (%) | 31.5 (±12.0) | 0.140 | 32.0 (±12.7) | 0.789 | 31.9 (±12.5) |
| Systolic blood pressure (mmHg) | 126 (±19) | <0.0001 | 128 (±21) | 0.905 | 128 (±20) |
| Body mass index (kg/m2) | 27.6 (±5.5) | 0.011 | 27.2 (±5.2) | 0.801 | 27.2 (±5.2) |
| Serum potassium (mEq/l) | 4.32 (±0.42) | 0.031 | 4.35 (±0.45) | 0.871 | 4.35 (±0.40) |
| Median duration of HF (months) | 29 (±36) | 0.164 | 31 (±37) | 0.971 | 31 (±39) |
| N (%) | |||||
| Female sex | 456 (19%) | <0.0001 | 564 (24%) | 0.760 | 574 (24%) |
| Non-white race | 473 (20%) | <0.0001 | 280 (12%) | 0.451 | 297 (12%) |
| Ischaemic aetiology for HF | 1580 (66%) | <0.0001 | 1699 (71%) | 0.726 | 1710 (71%) |
| NYHA functional classes III–IV | 648 (27%) | <0.0001 | 770 (32%) | 0.598 | 753 (31%) |
| Prior myocardial infarction | 1469 (61%) | 0.012 | 1553 (65%) | 0.525 | 1574 (66%) |
| Hypertension | 1045 (44%) | 0.014 | 1130 (47%) | 0.795 | 1140 (48%) |
| Diabetes mellitus | 626 (26%) | 0.022 | 697 (29%) | 0.849 | 703 (29%) |
| Digoxin (pre-trial use) | 1026 (43%) | 0.861 | 1032 (43%) | 0.397 | 1002 (42%) |
| Digoxin (trial use) | 1183 (49.3%) | 0.544 | 1204 (50.2%) | 0.624 | 1186 (49.4%) |
| ACE inhibitors | 2258 (94%) | 0.369 | 2243 (94%) | 0.685 | 2235 (93%) |
| Non-potassium-sparing diuretics | 1748 (73%) | <0.0001 | 1902 (79%) | 0.915 | 1906 (79%) |
| Potassium-sparing diuretics | 152 (6%) | 0.070 | 184 (8%) | 0.788 | 190 (8%) |
| Potassium supplement | 615 (26%) | 0.018 | 688 (29%) | 0.873 | 683 (29%) |
| Jugular venous distension | 281 (12%) | 0.051 | 326 (14%) | 0.496 | 310 (13%) |
| Pulmonary congestion by x-ray | 307 (12.8%) | 0.085 | 348 (14.5%) | >0.999 | 348 (14.5%) |
aTo avoid inflated significance due to the larger sample size of the pre-match cohort, we identified a random sample of 2399 patients with no CKD from the pre-match cohort of 4261 patients without CKD and merged them with 2399 matched CKD patients to assemble a pre-match cohort of 4798 patients, which is the same as that of the matched cohort.
ACE = angiotensin-converting enzyme; CKD = chronic kidney disease; HF = heart failure; NYHA = New York Heart Association.
Fig. 1.

Absolute standardized differences in baseline covariates between patients with and without chronic kidney disease, before and after propensity score matching (post-match standardized difference <5% indicates excellent covariate balance).
The effectiveness of the model to calculate propensity scores is best assessed by post-match balance in baseline covariates [15], which in turn is best assessed by standardized differences, expressed as a percentage of the pooled standard deviations [4,16,18]. As such, we plotted absolute standardized differences for all baseline covariates between CKD and non-CKD patients before and after matching. We supplemented these pre- and post-match selection bias assessments with the chi-square test and Student's t-test or the Wilcoxon rank-sum test as appropriate for continuous and categorical variables (Table 1).
Because there was no significant interaction between CKD and ejection fraction (using a cutoff of 45%) using Mantel–Haenszel tests of homogeneity and multivariable Cox proportional hazards models for predicting all-cause hospitalization, all subsequent analyses were based on all 4798 matched patients. We used Kaplan–Meier survival analyses and matched Cox proportional hazards models to estimate the association of CKD with various outcomes. We confirmed the assumption of proportional hazards by a visual examination of the log (minus log) curves. Formal sensitivity analyses were conducted to determine the effect of a potential hidden confounder on our study findings [19,20]. We then categorized patients with GFR <60 ml/min/1.73 m2 BSA into two groups based on GFR > or ≤ 45 ml/min/1.73 m2 BSA, created dummy variables, and compared their associations with all-cause death and all-cause hospitalization in reference to those with GFR ≥60 ml/min/1.73 m2 BSA.
To determine if the effects of CKD on hospitalization varied by patients’ age, sex, race, HF aetiology, NYHA functional class, presence of diabetes, treatment with ACE inhibitors, diuretics and digoxin, we conducted subgroup analyses among matched patients. At first, we compared absolute risk differences for each of the subgroups by subtracting the rates of hospitalization between patients with and without CKD [21] and then tested for interactions in Cox proportional hazards models entering first-order interaction terms between CKD and the covariates above, adjusting for propensity score. All statistical tests were evaluated using a two-tailed 95% confidence level. All data analyses were performed using SPSS for Windows version 14 [22].
Results
Baseline patient characteristics
In the matched cohort, patients with (n = 2399) and without (n = 2399) CKD were similar in all 32 baseline covariates (Table 1). Mean propensity score for patients with and without CKD was 0.48, with a standardized difference of 0.1% in linear after-matching propensity score. Absolute standardized differences for all measured covariates were reduced to <5% in the post-match cohort (Figure 1).
CKD and hospitalization
All-cause hospitalization occurred in 1587 (rate, 3733/10 000 person-years) patients without CKD and in 1636 (rate, 4233/10 000 person-years) patients with CKD, respectively, during 4251 and 3865 person-years of follow-up [hazard ratio (HR), 1.18, 95% confidence interval (CI), 1.08–1.29; P <0.0001; Table 2]. Kaplan–Meier plots for all-cause hospitalization by CKD are displayed in Figure 2a. Results of our sensitivity analysis suggest that an unmeasured binary covariate could potentially explain this finding if it would increase the odds of CKD by 8.1% (two-tailed P = 0.0002), and also be a near-perfect predictor of all-cause hospitalization and not be strongly correlated with any of the covariates displayed in Figure 1.
Table 2.
Cause-specific hospitalizations in heart failure patients with chronic kidney disease (CKD)
| Cause for hospitalizationa | Rate/10 000 person-years follow-up | Rate difference (per | Matched HR | P-value | |
|---|---|---|---|---|---|
| (hospitalizations/follow-up in years) | 10 000 person-years)b | (95% CI)c | |||
| No CKD (N = 2399) | CKD (N = 2399) | ||||
| All-cause | 3733 (1587/4251) | 4233 (1636/3865) | 500 | 1.18 (1.08 – 1.29) | <0.0001 |
| Cardiovascular | 2381 (1214/5099) | 2739 (1276/4658) | +359 | 1.17 (1.06–1.28) | 0.002 |
| Worsening heart failure | 1072 (666/6212) | 1330 (764/5744) | +258 | 1.28 (1.13–1.45) | <0.0001 |
| Ventricular arrhythmia, Cardiac arrest | 159 (112/7052) | 129 (87/6745) | −30 | 0.91 (0.67–1.25) | 0.574 |
| SV arrhythmiasd | 146 (103/7052) | 171 (114/6671) | +25 | 1.19 (0.88–1.60) | 0.255 |
| AV block, bradyarrhythmia | 8 (6/7202) | 18 (12/6850) | +10 | 2.25 (0.69–7.31) | 0.177 |
| Suspected digoxin toxicity | 33 (24/7178) | 63 (43/6795) | +30 | 1.71 (1.00–2.94) | 0.050 |
| Myocardial infarction | 196 (138/7043) | 205 (137/6692) | +9 | 1.06 (0.81–1.38) | 0.686 |
| Unstable angina | 465 (307/6609) | 426 (272/6386) | −39 | 0.87 (0.73–1.05) | 0.147 |
| Stroke | 189 (133/7024) | 145 (98/6745) | −44 | 0.72 (0.54–0.97) | 0.029 |
| Coronary Revscularizatione | 85 (60/7093) | 72 (49/6767) | −12 | 0.96 (0.64–1.44) | 0.835 |
| Cardiac transplantation | 17 (12/7191) | 17 (12/6858) | +1 | 1.38 (0.55–3.42) | 0.493 |
| Other cardiovascularf | 413 (278/6728) | 486 (308/6335) | +73 | 1.15 (0.95–1.39) | 0.142 |
| Respiratory infection | 261 (181/6930) | 275 (182/6617) | +14 | 1.29 (1.02–1.63) | 0.037 |
| Other non-cardiovascular | 1423 (826/5805) | 1582 (859/5431) | +159 | 1.51 (1.03–1.29) | 0.016 |
| Unspecified | 22 (16/7190) | 20 (14/6855) | −2 | 1.20 (0.52–2.78) | 0.670 |
| Number of hospitalizations | 3730 (1587/4254) | 4226 (1634/3866) | +496 | ||
aData shown include the first hospitalization of each patient due to each cause.
bAbsolute rate differences were calculated by subtracting the rate of hospitalization in the non-CKD group from the rate of hospitalization in the CKD group (before values were rounded).
cHazard ratios (HR) and confidence intervals (CI) were estimated from matched Cox proportional-hazards models that used the first hospitalization of each patient for each reason.
dSupraventricular (SV) arrhythmias include atrioventricular (AV) block and bradyarrhythmias.
eThis category includes coronary-artery bypass grafting and percutaneous transluminal coronary angioplasty.
fThis category includes embolism, venous thrombosis, peripheral vascular disease, hypertension, other vascular surgery, cardiac catheterization and other types of catheterization, pacemaker implantation, installation of automatic implantable cardiac defibrillator, electrophysiologic testing, transplant-related evaluation, nonspecific chest pain, atherosclerotic heart disease, hypotension, orthostatic hypotension and valve operation.
Fig. 2.
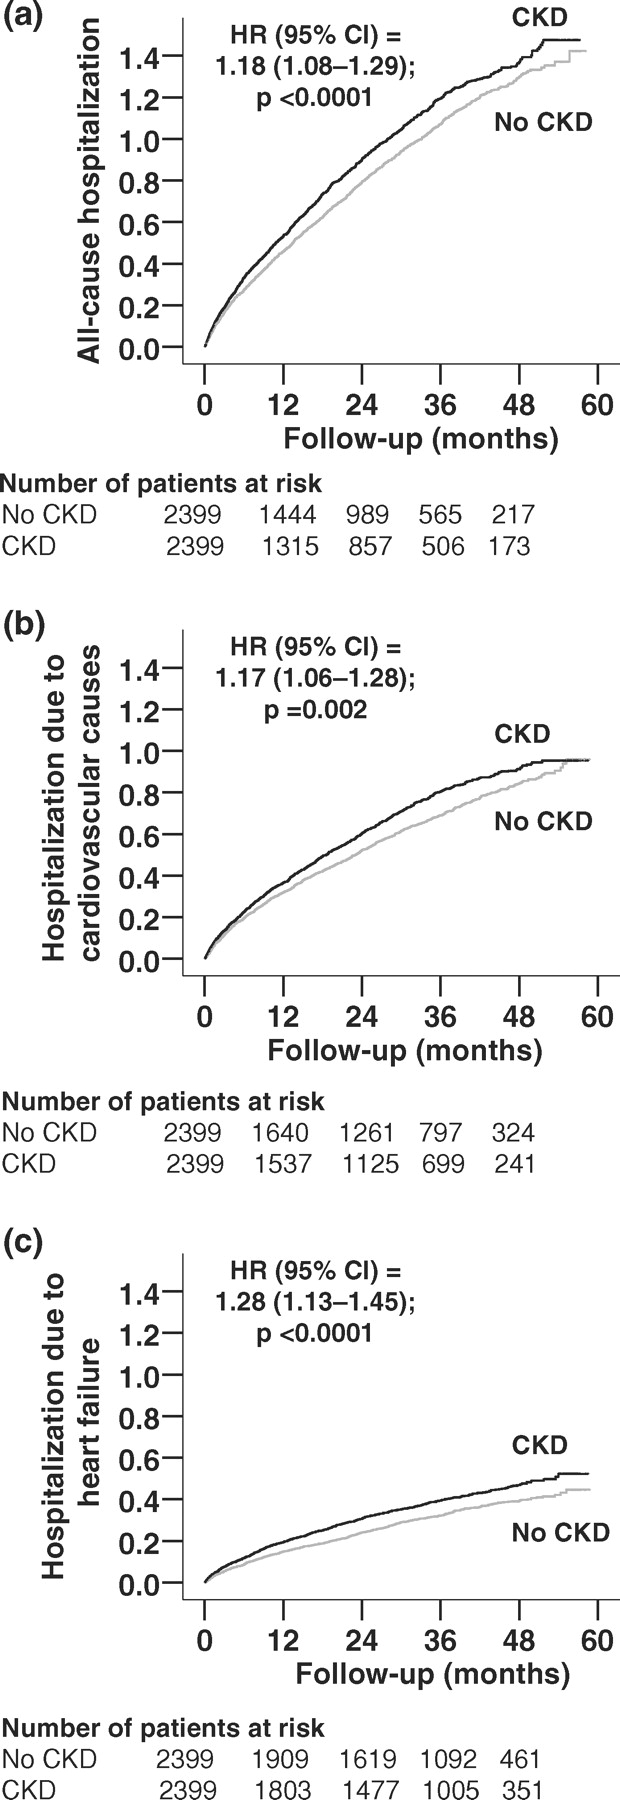
Kaplan–Meier plots for cumulative hazard for hospitalization due to (a) all causes, (b) cardiovascular causes and (c) worsening heart failure.
Of the 2399 patients with GFR ≤60 ml/min/1.73 m2 BSA, 1697 had GFR 45–59 ml/min/1.73 m2 BSA and 702 had GFR ≤45 ml/min/1.73 m2 BSA. All-cause hospitalization occurred in 66%, 66% and 75% of patients, respectively, with GFR ≥60, 45–59 and ≤45 ml/min/1.73 m2 BSA. When compared with GFR ≥60 ml/min/1.73 m2 BSA, GFR ≤45 ml/min/1.73 m2 BSA was associated with a higher risk of all-cause hospitalization (HR, 1.58; 95% CI, 1.34–1.87; P < 0.0001), but GFR 45–59 ml/min/1.73 m2 BSA was not (HR, 1.04; 95% CI, 0.94–1.59; P = 0.422).
When we used the National Kidney Foundation criteria for CKD staging, all-cause hospitalization occurred in 68% and 73% of patients, respectively, with GFR 30–59 (n = 2284) and ≤30 (n = 115) ml/min/1.73 m2 BSA with respective HR of 1.16 (95% CI, 1.06–1.27; P = 0.002) and 1.77 (95% CI, 1.16–2.69; P = 0.008).
Cardiovascular hospitalization occurred in 1214 patients without CKD (rate, 2381/10 000 person-years) and 1276 patients with CKD (rate, 2739/10 000 person-years), respectively, during 5099 and 4658 person-years of follow-up (HR, 1.17, 95% CI, 1.06–1.28; P = 0.002; Table 2). Kaplan–Meier plots for cardiovascular hospitalization by CKD are displayed in Figure 2b.
Hospitalization due to worsening HF occurred in 666 patients without CKD (rate, 1072/10 000 person-years) and 764 patients with CKD (rate, 1330/10 000 person-years), respectively, during 6212 and 5744 person-years of follow-up (HR, 1.28, 95% CI, 1.13–1.45; P <0.0001). Kaplan–Meier plots for HF hospitalization by CKD are displayed in Figure 2c. Associations of CKD with other cause-specific hospitalizations are displayed in Table 2.
CKD and cause-specific mortality
As presented in our companion paper, CKD was associated with increased all-cause mortality (HR, 1.22, 95% CI, 1.09–1.36; P <0.0001; Table 3) [4]. The CKD-associated risk of death increased progressively with a decrease in GFR. All-cause mortality occurred in 32%, 32% and 48% of patients with GFR ≥60, 45–59 and ≤45 ml/min/1.73 m2 BSA, respectively. When compared with GFR ≥60 ml/min/1.73 m2 BSA, GFR ≤45 ml/min/1.73 m2 BSA was associated with increased all-cause mortality (HR, 1.70; 95% CI, 1.40–2.07; P ≤ 0.0001), but GFR 45–59 ml/min/1.73 m2 BSA was not (HR, 1.03; 95% CI, 0.90–1.18; P = 0.651).
Table 3.
Cause-specific mortalities in heart failure patients with chronic kidney disease (CKD)
| Cause for mortality | Rate/10 000 person-years follow-up | Rate difference (per | Matched HR | P-value | |
|---|---|---|---|---|---|
| (mortality/follow-up in years) | 10 000 person-years)a | (95% CI)b | |||
| No CKD (N = 2399) | CKD (N = 2399) | ||||
| All-causec | 1049 (757/7216) | 1282 (882/6877) | +233 | 1.22 (1.09–1.36) | <0.0001 |
| Cardiovascular | 809 (584/7216) | 1011 (695/6877) | +202 | 1.24 (1.09–1.40) | 0.001 |
| Progressive heart failure | 334 (241/7216) | 452 (311/6877) | +118 | 1.42 (1.16–1.72) | 0.001 |
| Other cardiacd | 423 (305/7216) | 513 (353/6877) | +90 | 1.20 (1.01–1.42) | 0.044 |
| Other vasculare | 53 (38/7216) | 45 (31/6877) | −8 | 0.65 (0. 38–1.11) | 0.112 |
| Non-cardiac-non-vascular | 170 (123/7216) | 211 (145/6877) | +41 | 1.25 (0.95–1.66) | 0.117 |
| Unknown | 69 (50/7216) | 61 (42/6877) | −8 | 0.92 (0.58–1.46) | 0.722 |
aAbsolute rate differences were calculated by subtracting the rate hospitalization in the non-CKD group from the rate of hospitalization in the CKD group (before values were rounded).
bHazard ratios (HR) and confidence intervals (CI) were estimated from matched Cox proportional-hazards models that used the first hospitalization of each patient for each reason.
cBased on Ahmed A et al. Am J Cardiol 2007; 99: 393–398.
dThis category includes deaths presumed to result from arrhythmia without evidence of worsening heart failure and deaths due to atherosclerotic coronary disease, bradyarrhythmias, low-output states and cardiac surgery.
eThis category includes deaths due to stroke, embolism, peripheral vascular disease, vascular surgery and carotid endarterectomy.
Using the National Kidney Foundation criteria for CKD staging, all-cause death occurred in 36% and 59% of patients, respectively, with GFR 30–59 and ≤30 ml/min/ 1.73 m2 BSA with respective HR 1.19 (95% CI, 1.06–1.33; P = 0.003) and 1.89 (95% CI, 1.17–3.03; P = 0.009).
Cardiovascular mortality occurred in 584 patients without CKD (rate, 809/10 000 person-years) and 695 patients with CKD (rate, 1011/10 000 person-years), respectively, during 7216 and 6877 person-years of follow-up (HR, 1.24, 95% CI, 1.09–1.40; P = 0.001; Table 3). Results of our sensitivity analysis suggest that an unmeasured binary covariate could potentially explain this finding if it would increase the odds of CKD by 17.0% (two-tailed P = 0.00004), and also be a near-perfect predictor of cardiovascular mortality and not be strongly correlated with any of the covariates displayed in Figure 1. Mortality due to progressive HF occurred in 241 patients without CKD (rate, 334/10 000 person-years) and 311 patients with CKD (rate, 452/10 000 person-years; HR, 1.42, 95% CI, 1.16–1.72; P = 0.001).
Subgroup analyses
The association of CKD and all-cause hospitalization was observed in a wide spectrum of HF patients including systolic and diastolic HF (Figure 3). There were no significant interactions between CKD and any of the subgroups studied.
Fig. 3.

Association of chronic kidney disease and all-cause hospitalization in subgroups of propensity score-matched heart failure patients (ACE = angiotensin-converting enzyme; CI = confidence interval; HR = hazard ratio; NYHA = New York Heart Association).
Discussion
The findings from the current study demonstrate that CKD was associated with increased hospitalization due to all causes, cardiovascular causes and worsening HF. The risk for hospitalization and mortality increased as GFR decreased, becoming significant with a GFR <45 ml/min/ 1.73 m2 BSA. These findings are important as HF is the leading cause of hospitalization for populations 65 years and older, and, with the ageing of the population, the prevalence of HF is projected to double in the coming decades. Additionally, these data and our recently published companion paper [4] support the intrinsic prognostic value of CKD in HF and highlight the fact that CKD-associated poor outcomes are not due to its expected association with traditional risk factors that were well balanced in our matched cohort.
CKD and HF share many of the risk factors and pathogenic pathways including hypertension, diabetes and the activation of the renin–angiotensin–aldosterone system. It is possible that the presence of CKD indicates an increased burden of disease severity in patients with HF. However, the propensity matching was able to achieve excellent balance in baseline covariates between patients with and without CKD. Thus, the increased hospitalization cannot be explained by any of the measured covariates, including age, ischaemic heart disease, diabetes, NYHA class, ejection fraction or receipt of medications, all of which had been well balanced with post-match absolute standardized differences at <5% (Table 1 and Figure 1).
Increased CKD-related mortality and hospitalizations were primarily due to cardiovascular causes and in particular, due to worsening HF. Abnormalities in extracellular fluid volume mediated by the renin–angiotensin–aldosterone system activation and nitric oxide and reactive oxygen species have been implicated in the development and propagation of this syndrome [23,24], and the cardio-renal syndrome may be responsible for progressive disease and worsening failure in both organ systems.
The effect of CKD was more pronounced with worsening GFR. We note that CKD was significantly associated with increased mortality and hospitalization at both GFR cutoffs of ≤30 and ≤45 ml/min/1.73 m2 BSA but not <60 ml/min/1.73 m2 BSA. These findings suggest that the National Kidney Foundation definition of stage 3 CKD (GFR 30–59 ml/min/1.73 m2 BSA) may represent a heterogeneous group. Patients with GFR 30–44 ml/min/1.73 m2 BSA were prognostically more similar to those with GFR ≤30 ml/min/1.73 m2 BSA. On the other hand, patients with GFR 45–59 ml/min/1.73 m2 BSA were similar to those with GFR ≥60 ml/min/1.73 m2 BSA. These findings suggest that for HF patients, a cutoff of GFR 45 ml/min/1.73 m2 BSA may be more appropriate for risk stratification.
One of the key differences in the current analysis from our companion study on mortality is that CKD had an equivalent effect on the risk of hospitalization for systolic and diastolic HF. We have previously reported that CKD had a greater mortality risk in diastolic HF than in systolic HF. It is not clear why diastolic HF patients suffered more CKD-related deaths but had similar CKD-related hospitalization as systolic HF patients. One plausible explanation of this disparity might be that CKD-related deaths in diastolic HF patients may have been due to sudden cardiac death that may have precluded hospital admissions. However, we had no data on sudden cardiac death.
Other findings from our subgroup analyses are similarly interesting and potentially hypothesis generating. Significant CKD-associated increases in all-cause hospitalization were only noted in subgroups of patients ≤65 years of age, men, whites and those with NYHA classes I and II, receiving ACE inhibitors and diuretics, but not receiving digoxin. However, because of the small sample sizes and lack of significant interactions, these findings should be interpreted with caution. There is no known physiological basis why CKD would be less harmful in HF patients who are elderly, women, non-whites or have higher NYHA class symptoms. CKD has been shown to increase mortality in the elderly and women [25,26] and in one study increased the risk of incident HF among blacks [26]. The only subgroup analysis that approached significant interaction (P = 0.060) in our subgroup analyses was by the use of digoxin. CKD did not increase the risk of hospitalization in HF patients randomized to receive digoxin. This is not surprising given the well-known effect of digoxin on hospitalization in HF [8].
The lack of a significant effect of CKD in non-white HF patients was unexpected and is most likely due to the low representation of non-whites in the study population. However, the strong effect of CKD on hospitalization in the white patients echoes data from the National Heart Care Project that demonstrated a more pronounced increase in CKD-related mortality in elderly white patients hospitalized with HF than in blacks [27]. The reasons for these racial disparities remain unclear and need further investigation.
The finding that CKD is associated with increased hospitalization has important implications. The presence of CKD in the setting of HF should be routinely quantified to stratify risk, as it will impact patients’ quality of life and the health care system in general. Systolic HF should be treated with neurohormonal blockade such as ACE inhibitors or ARBs and beta-blockers. However, currently there is no evidence of a benefit from these drugs in those with diastolic HF. Diuretics should be used judiciously to achieve and maintain euvolaemia. [16] CKD is a risk factor for digoxin toxicity, and thus digoxin should be used in lower dosages in these patients [28]. The optimal therapy of HF and CKD remains to be defined.
There are several potential limitations of our study. As in any observational study, propensity score matching cannot account for unmeasured or hidden covariates. Results of our sensitivity analysis suggest that the findings of the current study may be modestly sensitive to an unmeasured covariate. However, for such a covariate to be a confounder, it must be strongly correlated with both CKD and outcomes and not strongly correlated with the covariates shown in Table 1. Results of our study are based on predominantly white, male, relatively younger HF patients with normal sinus rhythm and mild-to-moderate CKD, which might limit generalizability of these findings to other populations. We did not have data about the progression of CKD during the trial, and proteinuria was not measured in the study. The MDRD formula used may have underestimated GFR in those with GFR >60 ml/min/1.73 m2 BSA [29]. We also have no data on severity of comorbid conditions. Even though chronological age was balanced at baseline between patients with and without CKD, it is possible that those with CKD had higher biological age. We did not have data on the use of beta-blockers although this was probably low as these drugs were not yet approved for use in systolic HF at the time. It is likely that some of these covariates such as ejection fraction or medication use may have altered during follow-up. However, such regression dilution is likely to have underestimated the association observed in our analysis.
In conclusion, in a cohort of propensity-matched HF patients in which patients with and without CKD were well balanced in all measured baseline covariates, the presence of CKD was associated with increased hospitalization, and the risk of hospital admission was particularly high for those with GFR <45 ml/min/1.73 m2 BSA. The presence of CKD should be used to risk stratify HF patients, and they should be appropriately managed in an outpatient setting using established guideline recommendations to improve outcomes. Additional research is needed to identify ideal treatment strategies and guidelines for these high-risk patients [30].
Acknowledgments
The Digitalis Investigation Group (DIG) study was conducted and supported by the NHLBI in collaboration with the DIG investigators. This manuscript was prepared using a limited access dataset obtained by the NHLBI and does not necessarily reflect the opinions or views of the DIG Study or the NHLBI.
Funding. Dr. Campbell is supported by the National Institutes of Health (NIH) through grants from the National Institute of Diabetes and Digestive and Kidney Diseases, 1-K23-DK-64649-1A2 and by the National Kidney Foundation Young Investigator Program. Dr. Ahmed is supported by the NIH through grants from the National Heart, Lung, and Blood Institute (R01-HL085561 and P50-HL077100), and a generous gift from Ms. Jean B. Morris of Birmingham, Alabama.
Conflict of interest statement. None declared.
References
- 1.Rosamond W, Flegal K, Friday G, et al. Heart disease and stroke statistics—2007 update: a report from the American heart association statistics committee and stroke statistics subcommittee. Circulation. 2007;115:e69–e171. doi: 10.1161/CIRCULATIONAHA.106.179918. [DOI] [PubMed] [Google Scholar]
- 2.Coresh J, Astor BC, Greene T, et al. Prevalence of chronic kidney disease and decreased kidney function in the adult US population: third national health and nutrition examination survey. Am J Kidney Dis. 2003;41:1–12. doi: 10.1053/ajkd.2003.50007. [DOI] [PubMed] [Google Scholar]
- 3.Ahmed A, Kiefe CI, Allman RM, et al. Survival benefits of angiotensin-converting enzyme inhibitors in older heart failure patients with perceived contraindications. J Am Geriatr Soc. 2002;50:1659–1666. doi: 10.1046/j.1532-5415.2002.50457.x. [DOI] [PubMed] [Google Scholar]
- 4.Ahmed A, Rich MW, Sanders PW, et al. Chronic kidney disease associated mortality in diastolic versus systolic heart failure: a propensity matched study. Am J Cardiol. 2007;99:393–398. doi: 10.1016/j.amjcard.2006.08.042. [DOI] [PMC free article] [PubMed] [Google Scholar]
- 5.Mahon NG, Blackstone EH, Francis GS, et al. The prognostic value of estimated creatinine clearance alongside functional capacity in ambulatory patients with chronic congestive heart failure. J Am Coll Cardiol. 2002;40:1106–1113. doi: 10.1016/s0735-1097(02)02125-3. [DOI] [PubMed] [Google Scholar]
- 6.McAlister FA, Ezekowitz J, Tonelli M, et al. Renal insufficiency and heart failure: prognostic and therapeutic implications from a prospective cohort study. Circulation. 2004;109:1004–1009. doi: 10.1161/01.CIR.0000116764.53225.A9. [DOI] [PubMed] [Google Scholar]
- 7.Shlipak MG, Smith GL, Rathore SS, et al. Renal function, digoxin therapy, and heart failure outcomes: evidence from the digoxin intervention group trial. J Am Soc Nephrol. 2004;15:2195–2203. doi: 10.1097/01.ASN.0000135121.81744.75. [DOI] [PubMed] [Google Scholar]
- 8.The Digitalis Investigation Group The effect of digoxin on mortality and morbidity in patients with heart failure. N Engl J Med. 1997;336:525–533. doi: 10.1056/NEJM199702203360801. [DOI] [PubMed] [Google Scholar]
- 9.Levey AS, Bosch JP, Lewis JB, et al. Modification of Diet in Renal Disease Study Group A more accurate method to estimate glomerular filtration rate from serum creatinine: a new prediction equation. Ann Intern Med. 1999;130:461–470. doi: 10.7326/0003-4819-130-6-199903160-00002. [DOI] [PubMed] [Google Scholar]
- 10.National Kidney Foundation K/DOQI clinical practice guidelines for chronic kidney disease: evaluation, classification, and stratification. Am J Kidney Dis. 2002;39:S1–S266. [PubMed] [Google Scholar]
- 11.Rosenbaum P, Rubin D. Reducing bias in observational studies using subclassifications on the propensity score. J Am Stat Assoc. 1984;79:516–524. [Google Scholar]
- 12.Rosenbaum PR, Rubin DB. The central role of propensity score in observational studies for causal effects. Biometrika. 1983;70:41–55. [Google Scholar]
- 13.Rubin D. Estimating causal effects from large data sets using propensity scores. Ann Intern Med. 1997;127:757–763. doi: 10.7326/0003-4819-127-8_part_2-199710151-00064. [DOI] [PubMed] [Google Scholar]
- 14.Rubin D. Using propensity score to help design observational studies: application to the tobacco litigation. Health Serv Outcomes Res Methodol. 2001;2:169–188. [Google Scholar]
- 15.Rubin DB. On principles for modeling propensity scores in medical research. Pharmacoepidemiol Drug Saf. 2004;13:855–857. doi: 10.1002/pds.968. [DOI] [PubMed] [Google Scholar]
- 16.Ahmed A, Husain A, Love TE, et al. Heart failure, chronic diuretic use, and increase in mortality and hospitalization: an observational study using propensity score methods. Eur Heart J. 2006;27:1431–1439. doi: 10.1093/eurheartj/ehi890. [DOI] [PMC free article] [PubMed] [Google Scholar]
- 17.Levesque R. A Guide for SPSS® and SAS® Users. 2nd edn. Chicago, IL: SPSS Inc; 2005. [Google Scholar]
- 18.Normand ST, Landrum MB, Guadagnoli E, et al. Validating recommendations for coronary angiography following acute myocardial infarction in the elderly: a matched analysis using propensity scores. J Clin Epidemiol. 2001;54:387–398. doi: 10.1016/s0895-4356(00)00321-8. [DOI] [PubMed] [Google Scholar]
- 19.Rosenbaum PR. Sensitivity analysis for matched case-control studies. Biometrics. 1991;47:87–100. [PubMed] [Google Scholar]
- 20.Rosenbaum P. Sensitivity to hidden bias. In: Rosenbaum P, editor. Observational Studies. New York: Springer; 2002. pp. 110–124. [Google Scholar]
- 21.Rothwell PM. Treating individuals 2. Subgroup analysis in randomised controlled trials: importance, indications, and interpretation. Lancet. 2005;365:176–186. doi: 10.1016/S0140-6736(05)17709-5. [DOI] [PubMed] [Google Scholar]
- 22.SPSS . SPSS for Windows. Rel 14 edn. Chicago, IL: SPSS Inc; 2006. [Google Scholar]
- 23.Hillege HL, Girbes AR, de Kam PJ, et al. Renal function, neurohormonal activation, and survival in patients with chronic heart failure. Circulation. 2000;102:203–210. doi: 10.1161/01.cir.102.2.203. [DOI] [PubMed] [Google Scholar]
- 24.Bongartz LG, Cramer MJ, Doevendans PA, et al. The severe cardiorenal syndrome: ‘Guyton revisited’. Eur Heart J. 2005;26:11–17. doi: 10.1093/eurheartj/ehi020. [DOI] [PubMed] [Google Scholar]
- 25.Deo R, Fyr CL, Fried LF, et al. Kidney dysfunction and fatal cardiovascular disease—an association independent of atherosclerotic events: results from the Health, Aging, and Body Composition (Health ABC) study. Am Heart J. 2008;155:62–68. doi: 10.1016/j.ahj.2007.08.012. [DOI] [PubMed] [Google Scholar]
- 26.Bibbins-Domingo K, Chertow GM, Fried LF, et al. Renal function and heart failure risk in older black and white individuals: the health, aging, and body composition study. Arch Intern Med. 2006;166:1396–1402. doi: 10.1001/archinte.166.13.1396. [DOI] [PubMed] [Google Scholar]
- 27.Smith GL, Shlipak MG, Havranek EP, et al. Race and renal impairment in heart failure: mortality in blacks versus whites. Circulation. 2005;111:1270–1277. doi: 10.1161/01.CIR.0000158131.78881.D5. [DOI] [PubMed] [Google Scholar]
- 28.Ahmed A, Rich MW, Love TE, et al. Digoxin and reduction in mortality and hospitalization in heart failure: a comprehensive post hoc analysis of the DIG trial. Eur Heart J. 2006;27:178–186. doi: 10.1093/eurheartj/ehi687. [DOI] [PMC free article] [PubMed] [Google Scholar]
- 29.Smilde TD, van Veldhuisen DJ, Navis G, et al. Drawbacks and prognostic value of formulas estimating renal function in patients with chronic heart failure and systolic dysfunction. Circulation. 2006;114:1572–1580. doi: 10.1161/CIRCULATIONAHA.105.610642. [DOI] [PubMed] [Google Scholar]
- 30.Bakris G, Williams M, Dworkin L, et al. Preserving renal function in adults with hypertension and diabetes: a consensus approach. National Kidney Foundation Hypertension and Diabetes Executive Committees Working Group. Am J Kidney Dis. 2000;36:646–661. doi: 10.1053/ajkd.2000.16225. [DOI] [PubMed] [Google Scholar]