

Abstract
Background. Decreased renal cortical neuronal NO synthase (nNOS) abundance/activity correlates with progression of chronic kidney disease (CKD) in a number of animal models.
Methods. Western blotting with both N-terminal and C-terminal antibodies, immunoprecipitation, proteomics, RT-PCR and in situ hybridization were used to identify nNOS splice variants in the rat kidney.
Results. We have identified two nNOS proteins and transcripts in the rat kidney; nNOSα (∼160 kDa) and nNOSβ (∼140 kDa), a catalytically active exon-2 deletion variant, lacking both the PDZ and protein inhibitor of nNOS (PIN) domains. We also report that nNOSβ protein abundance is increased in the kidney at 11 weeks following 5/6th nephrectomy (5/6NX)-induced CKD while nNOSα protein abundance is diminished. The transcript data parallel the protein data in 5/6NX. By in situ hybridization, there is abundant nNOSα mRNA widely distributed throughout the normal kidney cortex, with very sparse nNOSβ mRNA confined to a few proximal tubules. In a second injury model (6 weeks after 5/6 renal mass reduction by combined right kidney ablation and infarction of ∼2/3 of the left kidney; 5/6 A/I), nNOSα mRNA almost disappears from the kidney cortex while nNOSβ mRNA abundance increases in tubules and tubulo-interstitium.
Conclusion. The renal cortical nNOSβ protein is present in low abundance in the normal kidney and increases with injury, in an inverse pattern of change with the nNOSα.
Keywords: 5/6 nephrectomy, in situ hybridization, nNOSα, nNOSβ, proteomics
Introduction
Neuronal NO synthase (nNOS) is widely distributed in the normal kidney with abundant expression in macula densa, proximal tubules and collecting duct [1,2]. The first nNOS described was an ∼160 kDa protein, currently known as the nNOSα. However, alternate splicing can produce many nNOS mRNA variants and other nNOS protein isoforms have been identified in extrarenal tissues: nNOSβ ∼ 140 kDa, nNOSγ ∼125 kDa, nNOSμ ∼165 kDa and nNOS-2 ∼144 kDa [2–10].
In this study, we compared an N-terminal antibody (recognizing the unique PDZ-PIN region of nNOSα) to a C-terminal antibody (that theoretically recognizes all nNOS variants), to determine whether multiple nNOS protein isoforms exist in the rat kidney. A targeted proteomics approach was used, and the presence of the relevant transcripts was investigated using RT-PCR. We also re-analysed the kidney cortex (KC) from a previously published study on 5/6th nephrectomy (5/6NX) chronic kidney disease (CKD) [11] to determine whether changes in nNOSβ protein abundance occur with kidney injury. In order to localize the nNOS isoforms, we conducted in situ hybridization studies in sham and CKD kidneys 6 weeks after 5/6 renal mass reduction by combined ablation and infarction (5/6 A/I).
Subjects and methods
The following tissues were harvested from control male (n = 4) and female (n = 3) Sprague Dawley (Harlan, Indianapolis, IN, USA) rats; aorta, KC, kidney medulla (KM), skeletal muscle, heart, lung, liver, small intestine, testis and cerebellum. Western blots were performed on the KC taken from sham and 5/6NX rats, each n = 6 (details published previously [11]) using a C-terminal antibody (ABR PA1-033; Affinity BioReagents, Golden, CO, USA). For in situ hybridization, the left kidney was obtained from one control and one rat at 6 weeks after 5/6 A/I. Supplies were from Sigma, St Louis, MO, USA, unless otherwise specified.
For western blot, 5–300 μg of protein (in 50 μl) was loaded on 7.5% gels, separated by SDS–PAGE (200 V, 2.5 h) and blotted to Hy-bond nitrocellulose membranes (1.75 h, 0.18 Amps, Amersham Biosciences, Piscataway, NJ, USA). A positive control (5–10 μg rat cerebellar lysate) and molecular weight (MW) markers were run on each gel. The membranes were blocked and probed with one of the following antibodies: a C-terminal rabbit polyclonal antibody (ABR PA1-033, 1:250 dilution for ECL detection, 1:4000 dilution for ECL Advance detection, overnight incubation) or an N-terminal rabbit polyclonal antibody [12] (1:5000 dilution for ECL detection, 1-h incubation), followed by a secondary goat anti-rabbit IgG-HRP antibody (BioRad, Hercules, CA, USA; 1:3000 for ECL; 1:60 000 for ECL Advance detection, 1-h incubation). The bands were visualized using ECL or ECL Advance (Amersham Biosciences) and captured with a VersaDoc image analysis system (BioRad).
For peptide competition, 150 μg of neutralizing peptide (ABR PEP-190) was incubated with 3.75 μg of the C-terminal nNOS antibody (ABR PA1-033) overnight at 4°C and centrifuged. The supernatant was diluted in a blocking solution (1:4000) and used for nNOS detection. The control membrane was probed with the ABR PA1-033 alone. Both membranes were then probed with a secondary goat anti-rabbit IgG-HRP antibody (BioRad; 1:60 000 dilution, 1-h incubation).
For immunoprecipitation, KC/KM and cerebellum were homogenized with a lysis buffer (20 mM Tris–HCl, 150 mM NaCl, 1% Triton X-100, 0.5% Nonidet P-40, 1 mM EDTA, 1 mM EGTA, 20 mM sodium orthovanadate, 20 mM NaF, 5 mM phenylmethylsulfonyl fluoride, 21 μg/ml aprotinin, 5 μg/ml leupeptin) and centrifuged. The supernatant (KC = 1.5 ml, 26 μg protein/μl; KM = 1 ml, 25 μg/μl; Cer = 1 ml, 11.5 μg/μl) was incubated with 20–80 μl of an ABR PA1-033 C-terminal nNOS antibody overnight at 4°C with continuous rotation. Protein A-Sepharose beads (30–50 μl, Amersham Biosciences) were added, rotated for 2 h at 4°C, washed, re-suspended in 50 μl of 2× Laemmli buffer, boiled for 3 min and loaded onto 7.5% gels. The proteins were separated by 1D-SDS–PAGE (200 V, 2.5 h) and stained with Coomassie blue. Bands of interest were excised under fully sterile conditions.
Protein digestion, peptide mass fingerprinting and sequence tagging [12,13] were conducted on individual bands excised as 1–3 mm3 plugs from the 1D-SDS–PAGE gels as follows. Plugs were conditioned and de-stained with 20 μl of 0.1 M NH4HCO3 for 15 min followed with 30 μl of 99.9% acetonitrile. The gel pieces were dried, re-hydrated with 20 μl of 0.02 M dithiothreitol in 0.1 M NH4HCO3 and heated at 56°C for 45 min for reduction of disulfide bonds. The solution was replaced with 0.055 M iodoacetamide in 0.1 M NH4HCO3 for alkylation of reduced thiols (30 min in the dark). The alkylation solution was removed. The gel plugs were conditioned for 15 min with 200 μl of 0.05 M NH4HCO3, and then dehydrated with 200 μl of 99.9% acetonitrile. After 15 min, the solution was removed, and gel plugs were dried by vacuum centrifuge and re-hydrated with 3 μl of 20 ng/μl modified trypsin (Promega, Madison, WI, USA) in 0.05 M NH4HCO3. The re-hydrated gel pieces were covered with 5–6 μl of 0.05 M NH4HCO3 solution and incubated overnight at 37°C. The samples were cooled, and the trypsinization reaction was stopped by the addition of 1 μl of 0.1% trifluoroacetic acid (TFA). MALDI matrix was α-cyano-4-hydroxycinnamic acid (α-CN) containing 10 mM NH4H2PO4. The samples were (a) spotted as 1:1 (v/v) samples of protein digest: α-CN or (b) desalted sample aliquots (0.7–1.0 μl, 4 mg/ml α-CN, 50% acetonitrile, 0.1% TFA) spotted directly onto MALDI sample targets using C18 Zip Tips® (Millipore, Salem, MA, USA). Samples were air-dried in the dark and cleared of particulate matter with compressed gas prior to sample plate loading into the mass spectrometer.
Positive ion MALDI-TOF mass spectra were acquired using an Applied Biosystems (Foster City, CA, USA) AB4700 protein analyser operating in reflectron mode and with ion source pressure of ∼0.5 μTorr. After a 400-ns time-delayed ion extraction period, the ions were accelerated to 20 kV for TOF mass spectrometric analysis. A total of 600–1000 laser shots (355 nm Nd:YAG solid-state laser operating at 200 Hz) were acquired and signal-averaged. Individual sample plates were calibrated, and plate modelling was performed using a six-peptide calibration standard with (1) des-Arg1-Bradykinin, (2) angiotensin I, (3) Glu1-Fibrinopeptide B, (4) ACTH (1–17), (5) ACTH (18–39) and (6) ACTH (7–38). Data were analysed using Mascot 1.9 against the 20051115/20061212 Swiss Protein database assuming (a) monoisotopic peptide masses, (b) cysteine carbamidomethylation, (c) variable oxidation of methionine, (d) no missed trypsin cleavage sites, (e) MS mass accuracy >50 ppm and (f) a MSMS mass accuracy >0.3 Da. Limitation of the original protein mass was not employed within the Mascot search. A Mascot score of ≥65 was considered to be statistically significant (P < 0.05).
For RT-PCR, RNA was extracted using TRI reagent treated with DNase I (Ambion, Austin, TX, USA) and reverse transcribed with random primers (Invitrogen, Carlsbad, CA, USA). Complementary DNA (0.5 μg) from each sample was amplified by PCR using 50 ng of each primer and the FailSafeTM PCR system (Epicentre, Madison, WI, USA) in a 50 μl final volume. Forward primers targeting Exon 1a, 1b, and 1c were made according to Lee et al. [4]. Reverse primers were designed from rat-specific sequences (NM_052799) targeting exon 2, 5 and 6 (Ex2:5′-ccgcagcacctcctcgaatc 3′; Ex5:5′-accccgtttccagtgtgctcttca 3′; Ex6:5′-gcgccatagatgagctcggtg 3′). Ribosomal 18S (Ambion) served as a ‘housekeeping’ gene. Complimentary DNA was amplified simultaneously for all tissues, electrophoresed on a 0.7% or 1.5% agarose gels (depending on the expected PCR product size) and stained with ethidium bromide. Images were captured using a VersaDoc image analysis system (BioRad).
The same mRNA fragments for rat nNOSα and β analysed by RT-PCR were also targeted by in situ hybridization. The 5′ end of the forward and reverse primer sequences was modified by incorporating a T7-specific transcription factor recognition site (seq: TAA TAC GAC TCA CTA TAG GGA AGC CGG ATC) to produce nNOS-specific riboprobes. Kidneys were harvested fixed in 4% buffered paraformaldehyde (pH 7.0), embedded in OCT (Electron Microscopy Sciences, PA, USA) and sectioned at 10 μm using a cryotome. After acid hydrolysis in 0.2 M HCl, the sections were digested with 3 μg/ml of proteinase K for 15 min at room temperature in diethyl-pyrocarbonate-treated phosphate-buffer saline (PBS), pH 7.0. After acetylation, the probe was added to a 500 μl pre-warmed prehybridization solution [5 mM ethylenediaminetetraacetic acid, 0.1% Triton X-100, 0.1% CHAPS, 50 μg/ml heparin sulfate, 5× saline sodium citrate (SSC) solution, 10% dextran sulfate, 50% formamide, 0.2 mol/l DTT and 1 mg/ml tRNA]. Cover slips were applied with paraffin strips. Hybridization was performed overnight in a moist chamber at 65°C. The cover slips were removed, and the sections were washed in a graded series (5×, 2×, 0.2×) of SSC buffer + 0.1% Triton X. The reaction was blocked with 10% goat serum for 60 min at room temperature, and then the sections were incubated with the anti-daioxigenin antiserum diluted in 10% goat serum (1:2000) at room temperature overnight. The sections were washed (100 mM Tris, pH 9.5, 100 mM NaCl, 50 mM MgCl2, 1% Tween 20) and rinsed (50 mM Tris, pH 7.5, 150 mM NaCl, 100 mM KCl, 0.1% Tween 20) several times. They were developed with a BM Purple Substrate (Roche Ltd, CA, USA) and counterstained with Nuclear Fast Red (Vector Laboratories Inc., CA, USA). They were then dehydrated with serial ethanol concentrations, followed by xylol. The sections were mounted with the Cytoseal XYL medium (Fisher Sci, MA, USA) and evaluated under a Zeiss AxioCam MRc5 laboratory microscope.
Results
Homogenates of the rat kidney cortex and medulla (KC/KM) were immunoblotted using an N-terminal antibody [12] that detects the nNOSα and gives a single band at ∼160 kDa in KC/KM and cerebellum (Figure 1A). To investigate the presence of other possible nNOS isoforms, we used a C-terminal nNOS antibody that by western blot gave bands in normal KC/KM at the MWs of nNOSα (∼160 kDa) and nNOSβ (∼140 kDa). In addition, we detected a band at ∼125 kDa (Figure 1B), the correct MW for the nNOSγ. All three bands faded when incubated with the neutralizing peptide (Figure 2), suggesting that they were nNOS isoforms or proteins with structural homogeneity to AA 1409–1424 of nNOS.
Fig. 1.

Immunoblots of a male kidney cortex (KC, 200 μg), kidney medulla (KM, 100 μg) and control cerebellar lysate (Cer, 5 μg) with the N-terminal nNOS antibody (A) and ABR PA1-033 C-terminal nNOS antibody (B). Lanes: 1 = male KC, 2 = male KM, 3 = female KC, 4 = female KM, 5 = Cer.
Fig. 2.

Immunoblots of a female kidney cortex (KC), kidney medulla (KM), and control cerebellar lysate (Cer) with the ABR PA1-033 C-terminal nNOS antibody in the absence (A) and presence (B) of neutralizing peptide. KC/KM samples were from three separate females. Lanes: 1–3 = KC, 4–6 = KM, 7 = Cer.
Homogenates from KC/KM and cerebellum were immunoprecipitated with a C-terminal antibody and electrophoresed (1D-SDS–PAGE). Data were acquired by MALDI-TOF MS and MS/MS. We identified nNOS in the ∼170 and ∼160 kDa bands of cerebellum (Table 1; C3/C4). The observed peptide coverage for C4 spans the rat nNOS protein sequence from amino acid (AA) residue 36–1407, consistent with nNOSα. While nNOS was also detected in C3, we could not determine if this larger isoform was the nNOSμ since the tryptic peptide mass/fragments associated with the 34AA insert were not observed.
Table 1.
Proteins identified by MALDI-TOF MS/MS-MS
| Band | Protein ID | Protein accession number | MASCOT score | Sequence coverage (%) | Number of matching non-redundant peptides | Estimated MW (kDa) | Calculated MW (kDa) |
|---|---|---|---|---|---|---|---|
| C3 | nNOS | P29476 | 169 | 15 | 20 | 190 | 161.8 |
| C3 | Clathrin heavy chain | P11442 | 141 | 13 | 19 | 190 | 193.2 |
| C4 | nNOS | P29476 | 600 | 33 | 37 | 160 | 161.8 |
| KM3 | Clathrin heavy chain | P11442 | 251 | 23 | 28 | 190 | 193.2 |
| KM4 | nNOS | P29476 | 138 | 18 | 19 | 160 | 161.8 |
| KM5 | nNOS | P29476 | 187 | 17 | 21 | 150 | 161.8 |
| KC3 | Clathrin heavy chain | P11442 | 458 | 32 | 42 | 190 | 193.2 |
| KC4 | Spectrin-α-chain brain | P16546 | 136 | 15 | 18 | 160 | 168 |
| KC4 | Myosin-6 | Q9UM54 | 78 | 11 | 14 | 160 | 150 |
| KC5 | Aminopeptidase N | P15684 | 76 | 12 | 9 | 150 | 109.6 |
C, cerebellum; KM, kidney medulla; KC, kidney cortex. Peptide masses were searched against the Swiss Protein data (20051115) and all taxa (197 228 sequences and 71 581 181 residues) assuming complete alkylation of cysteine with iodoacetamide, partial oxidation of methionine, no missed cleavages by trypsin and a MS mass tolerance of 50 ppm & MSMS mass tolerance of 0.3 Da. The Mascot score is the absolute probability that the observed match is a random event. The Mascot score is reported as −10 × log10(P), where P is the absolute probability; therefore, the lower the probability that an observed match is a random event, the higher the score. In this study, a score of ≥65 was considered significant. The sequence coverage is the number of amino acid (AA) residues identified by peptide sequence tagging compared to the parent protein (AA identified/total AA in parent protein).
In KM, nNOS was identified in ∼160 and ∼140 kDa bands (Table 1; KM4/KM5). KM4 contained peptide ions mapping to the rat nNOSα from AA 36–1400 whereas only peptides spanning AA 360–1400 were identified in KM5. Of note, we did not identify the R.VSKPPVIISDLIR.G, the R.GIASETHVVLILR.G or the R.GPEGFTTHLETTFTGDGTPK.T tryptic peptides, predicted to be present within AA 1–358 of the nNOSα, consistent with the identification of the ∼140 kDa band as the nNOSβ. Due to low abundance, we were unable to detect the nNOS protein in KC by MS although four unrelated proteins were present: clathrin heavy chain (CLH), spectrin-α chain brain (SPTA2), myosin-6 (MYO6) and aminopeptidase N (AMPN) (Table 1). There is no homology between CLH, SPTA2, MYO6 and AMPN and the immunogen of the ABR C-terminal antibody or nNOS. In addition, CLH, SPTA2 and MYO6 were identified by immunoprecipitation in the absence of an antibody suggesting protein–protein interactions and/or non-specific binding to protein A. AMPN was identified by MALDI-TOF MS/MS-MS in only one immunoprecipitation and not in repeated studies, suggesting contamination rather than a lack of ABR nNOS antibody specificity [14].
Although an immunoreactive protein band at ∼125 kDa (nNOSγ) was detected with the ABR nNOS C-terminal antibody by western blot analysis, we were unable to confirm the presence of nNOSγ by proteomic analysis in either KM or KC.
RT-PCR was performed on the same KM samples used for proteomic analysis, using various untranslated regions of exon 1 [4]. Two bands were detected with exon 1a–exon 5 primer pairing indicating the presence of nNOSα (∼1365 bp) and nNOSβ (∼310 bp) mRNA expression (Figure 3). As shown in Figure 4, nNOSα and/or nNOSβ mRNA was present in various rat tissues including KC/KM, skeletal muscle, liver, small intestine, lung, testis and cerebellum. To test for the presence of the nNOSγ transcript, exon 1a–exon 6 primer pairing was performed. Again, only two bands were detected indicating the presence of nNOSα (∼1603 bp) and nNOSβ (∼548 bp), but no nNOSγ mRNA expression (Figure 3).
Fig. 3.

End-point RT-PCR of the kidney medulla using forward primers targeting exon 1a, 1b or 1c (previously published and sequenced by Lee et al. [4]) and reverse primers targeting exon 5 or exon 6. The DNA ladder is shown on the left.
Fig. 4.

End-point RT-PCR of various male rat tissues: kidney cortex (KC), kidney medulla (KM), cerebellum (Cer), testis (T), lung (Lu), aorta (A), liver (Li), small intestine (Si), heart (H) and skeletal muscle (M). nNOSα transcript was detected using a forward primer targeting exon 1a and a reverse primer targeting exon 2. nNOSβ transcript was detected using a forward primer targeting exon 1a and a reverse primer targeting exon 6. Ribosomal 18S was used as an internal control. The KC/KM samples used for end-point RT-PCR were the same tissue samples used in generating the KC/KM proteomic data. DNA ladders are shown on the left and right.
We recently reported that the nNOSα protein was decreased in KC with 5/6NX [11]. Using the C-terminal antibody, we confirm that nNOSα protein abundance is decreased, while nNOSβ protein abundance is increased following injury (Figure 5). We have also reported previously that the nNOSα protein was decreased in KC with 5/6 A/I [15,16]. Using in situ hybridization, we have confirmed and extended our previous findings. In the sham kidney, there is extensive nNOSα labelling that was widely distributed in almost all structures of renal cortex (Figure 6). Glomeruli displayed high nNOSα labelling intensity with the most prominent tubular intensity in the macula densa, while proximal tubules and renal interstitium were less pronounced. There was scant nNOSβ mRNA labelling in the sham KC, with no visible staining in the glomeruli and occasional scattered staining in the proximal tubules. In the 5/6 A/I kidney, the nNOSα was barely detectable in any cortical structures, while the nNOSβ was widely distributed, mainly in proximal tubules, with moderate labelling in interstitium and no staining in the glomerulus or macula densa (Figure 6).
Fig. 5.

Densitometry showing abundance of nNOSα (A) and nNOSβ (B) in the kidney cortex of sham (n = 6) and 5/6 nephrectomy (5/6NX; n = 6) rats studied 15 weeks after surgery, using the ABR PA1-033 C-terminal nNOS antibody. Data obtained using the N-terminal antibody specific for nNOSα are also shown for comparison (C) [8]. *P < 0.05 versus sham.
Fig. 6.
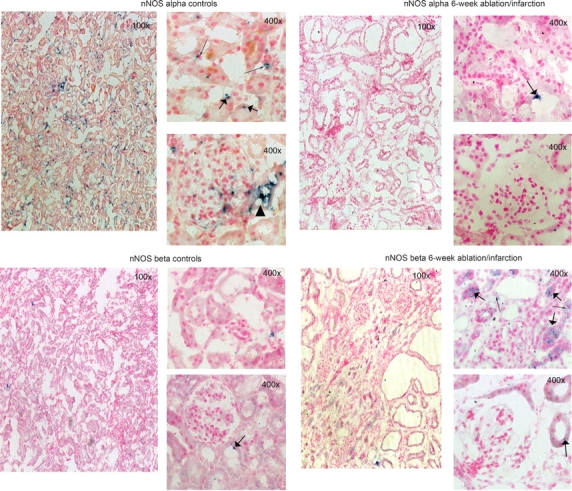
Representative images of nNOSα and nNOSβ mRNA expression (blue stain) in the kidney cortex from control (A, C) and 6-week 5/6 A/I rats (B, D) visualized by in situ hybridization. All were counterstained with Nuclear Fast Red. The top 400× panels show proximal tubules, while sections containing glomeruli are shown on the bottom 400× panels. Proximal tubules are marked with a thin arrow, while a thick arrow points at interstitial staining. Black triangle represents macula densa.
Discussion
The major novel finding in this study is that predominantly not only the nNOSα but also the nNOSβ protein is present in the normal rat kidney. In addition, we have confirmed the presence of two nNOS mRNA transcripts (nNOSα, nNOSβ) arising from the same 5′ untranslated region. There is widespread cortical distribution of the nNOSα transcript in glomeruli, tubules and interstitium and sparse nNOSβ transcript, confined to proximal tubules. The distribution of the nNOS isoforms changes in CKD, with loss of cortical nNOSα and an increase in the nNOSβ protein and transcript, with the transcript localized to proximal tubules and interstitium.
Unlike full-length (∼160 kDa) nNOSα, nNOSβ lacks PDZ and PIN domains. The PDZ-domain targets nNOSα to the membrane, thus the nNOSβ will only occur in the cytosol [17] as shown for rat intestine [7]. Despite this cytosolic location (similar to inducible NOS), the nNOSβ is calcium/calmodulin dependent [17]. The PIN domain contains a protein–protein binding site where PIN inhibits nNOSα activity [18], while the nNOSβ cannot be influenced by protein–protein interactions. In vitro studies have shown that the nNOSβ is catalytically active, with ∼80% of the nNOSα activity when transfected into COS cells [17]. Studies in the mouse brain show colocalization of citrulline (NOS product) and nNOSβ [19]; thus, the renal nNOSβ is likely to be a functional enzyme although under different regulation compared to the nNOSα.
The nNOSβ is present in many brain areas in wild-type mice, and in the nNOSα knockout mouse the brain nNOSβ abundance increases [19]. Further, in nNOSα knockout mice, the nNOSβ was able to maintain normal penile erection, suggesting that there may be compensatory upregulation of nNOSβ when nNOSα-derived NO is deficient [20]. We have previously observed reductions in renal cortical nNOSα with concurrent increases in nNOSβ mRNA and protein in rapamycin-treated Fisher/Lewis renal allografts and Fisher/Fisher isografts [21]. We also recently reported that nNOSα abundance (using an N-terminal antibody) was reduced with 5/6NX [11]. In the present study, we confirmed this using a C-terminal antibody and also observed increased nNOSβ protein abundance in 5/6NX rats, again suggesting an attempt at compensatory upregulation in response to renal injury. We also observed an increase in nNOSβ mRNA in the 5/6 A/I KC. Previously, we reported an overall fall in total NO production with 5/6NX [11] and 5/6 A/I [15,16] as measured by urinary nitrite + nitrate excretion. This means that the increased renal cortical nNOSβ seen here in both of these models cannot compensate for an overall loss of NO. Furthermore, we always observe a reduction in the in vitro NOS activity of renal cortex from CKD models where the nNOSα has been reduced [1], suggesting that the increased nNOSβ cannot completely replace renal NO generation.
Whether the increased renal cortical nNOSβ is beneficial in CKD, or ends up contributing to the injury, is not clear. The presence of nNOSβ in the normal kidney and brain, and preservation of critical physiologic functions in the nNOSα knockout [19,20], suggests that activity of this isoform is not inherently damaging. In addition, we have preliminary data showing that there is a selective increase in the nNOSβ transcript and protein in the kidney of the midterm pregnant rat, coincident with the gestational renal vasodilation [22]. However, in the present study the in situ hybridization data show that in CKD the nNOSβ is expressed in different locations to the normally occurring nNOSα, again suggesting that nNOSβ-derived NO cannot fully compensate in restoration of NO-dependent functions. For example, there appears to be no nNOSβ in the macula densa in either control or CKD animals. Vallon and colleagues previously suggested that only the nNOSα is expressed in the macula densa and that no compensatory macula densa nNOSβ upregulation occurs in the nNOSα knockout mouse [23]. In the absence of nNOSα, therefore, the nNOS-dependent vasodilatory component of tubuloglomerular feedback control of GFR [23] is likely to be lost in CKD. If macula-densa-derived NO also contributes to glomerular mesangial matrix production, this could also mean an exacerbation of the sclerotic process. There are many questions that arise from these observations that we hope will stimulate further experimental and clinical studies.
We were able to use a proteomic approach to validate use of the ABR C-terminal antibody to detect nNOSβ, but only in the renal medulla where there is relatively high nNOS abundance. Despite detecting both nNOSα and nNOSβ transcripts in the rat KC, we could not confirm the presence of any nNOS protein in the KC by our proteomic analysis. This presumably resulted from a relatively low abundance of nNOS in the KC that was beneath the level of detectability of the proteomic methods we used. Given the large body of literature demonstrating that nNOS is present in very high concentrations in the macula densa, we hypothesize that the abundance of nNOS in the macula densa relative to total cortex is beneath the level of detection by the MS methods we have used.
Although an immunoreactive protein band at ∼125 kDa (nNOSγ) was detected with the ABR nNOS C-terminal antibody by western blot analysis, we were unable to confirm the presence of nNOSγ by proteomic analysis. While this absence could simply reflect low protein abundance, the fact that we could not detect any nNOSγ mRNA suggests that the nNOSγ is not present in the normal rat kidney. Of note, in vitro transfection studies showed that the nNOSγ has very low activity, ∼3% of the nNOSα [17]. Perhaps, this ∼125 kDa band (which was competed by neutralizing peptide) contains a novel nNOS variant?
Acknowledgments
These studies were supported by the NIH Grant R01DK056843 (to CB) and funding from the Department of Veterans Affairs Merit Review, Department of Energy (DE-FG02-05ER6406) and the James Graham Brown Foundation (to JK). Part of this work was previously published in abstract form as [22].
Conflict of interest statement. None declared.
References
- 1.Baylis C. Nitric oxide deficiency in chronic kidney disease. Gottschalk Lecture 2007. Am J Physiol Renal. 2008;294:F1–F9. doi: 10.1152/ajprenal.00424.2007. [DOI] [PubMed] [Google Scholar]
- 2.Alderton WK, Cooper CE, Knowles RG. Nitric oxide synthases: structure, function and inhibition. Biochem J. 2001;357:593–615. doi: 10.1042/0264-6021:3570593. [DOI] [PMC free article] [PubMed] [Google Scholar]
- 3.Brenman JE, Xia H, Chao DS, et al. Regulation of neuronal nitric oxide synthase through alternative transcripts. Dev Neurosci. 1997;19:224–231. doi: 10.1159/000111211. [DOI] [PubMed] [Google Scholar]
- 4.Lee MA, Cai L, Hubner N, et al. Tissue- and development-specific expression of multiple alternatively spliced transcripts of rat neuronal nitric oxide synthase. J Clin Invest. 1997;100:1507–1512. doi: 10.1172/JCI119673. [DOI] [PMC free article] [PubMed] [Google Scholar]
- 5.Wang Y, Newton DC, Marsden PA. Neuronal NOS: gene structure, mRNA diversity, and functional relevance. Crit Rev Neurobiol. 1999;13:21–43. doi: 10.1615/critrevneurobiol.v13.i1.20. [DOI] [PubMed] [Google Scholar]
- 6.Wang Y, Newton DC, Robb GB, et al. RNA diversity has profound effects on the translation of neuronal nitric oxide synthase. Proc Natl Acad Sci USA. 1999;96:12150–12155. doi: 10.1073/pnas.96.21.12150. [DOI] [PMC free article] [PubMed] [Google Scholar]
- 7.Huber A, Saur D, Kurjak M, et al. Characterization and splice variants of neuronal nitric oxide synthase in rat small intestine. Am J Physiol. 1998;275:G1146–G1156. doi: 10.1152/ajpgi.1998.275.5.G1146. [DOI] [PubMed] [Google Scholar]
- 8.Saur D, Paehge H, Schusdziarra V, et al. Distinct expression of splice variants of neuronal nitric oxide synthase in the human gastrointestinal tract. Gastroenterology. 2000;118:849–858. doi: 10.1016/s0016-5085(00)70171-5. [DOI] [PubMed] [Google Scholar]
- 9.Xie J, Roddy P, Rife TK, et al. Two closely linked but separable promoters for human neuronal nitric oxide synthase gene transcription. Proc Natl Acad Sci USA. 1995;92:1242–1246. doi: 10.1073/pnas.92.4.1242. [DOI] [PMC free article] [PubMed] [Google Scholar]
- 10.Oberbaumer I, Moser D, Bachmann S. Nitric oxide synthase 1 mRNA: tissue-specific variants from rat with alternative first exons. Biol Chem. 1998;379:913–919. [PubMed] [Google Scholar]
- 11.Tain YL, Freshour G, Dikalova A, et al. Vitamin E reduces glomerulosclerosis, restores renal neuronal NOS, and suppresses oxidative stress in the 5/6 nephrectomized rat. Am J Physiol Renal Physiol. 2007;292:F1404–F1410. doi: 10.1152/ajprenal.00260.2006. [DOI] [PubMed] [Google Scholar]
- 12.Lau KS, Grange RW, Isotani E, et al. nNOS and eNOS modulate cGMP formation and vascular response in contracting fast-twitch skeletal muscle. Physiol Genomics. 2000;2:21–27. doi: 10.1152/physiolgenomics.2000.2.1.21. [DOI] [PubMed] [Google Scholar]
- 13.Arthur JM, Thongboonkerd V, Scherzer JA, et al. Differential expression of proteins in renal cortex and medulla: a proteomic approach. Kidney Int. 2002;62:1314–1321. doi: 10.1111/j.1523-1755.2002.kid588.x. [DOI] [PubMed] [Google Scholar]
- 14.Lin Z, Crockett DK, Lim MS, et al. High-throughput analysis of protein/peptide complexes by immunoprecipitation and automated LC-MS/MS. J Biomol Tech. 2003;14:149–155. [PMC free article] [PubMed] [Google Scholar]
- 15.Szabo A, Wagner L, Erdely A, et al. Renal neuronal nitric oxide synthase protein expression as a marker of renal function. Kidney Int. 2003;64:1765–1771. doi: 10.1046/j.1523-1755.2003.00260.x. [DOI] [PubMed] [Google Scholar]
- 16.Erdely A, Wagner L, Muller V, et al. Protection of Wistar Furth rat from chronic renal disease is associated with maintained renal nitric oxide synthase. JASN. 2003;14:2526–2533. doi: 10.1097/01.asn.0000086476.48686.7d. [DOI] [PMC free article] [PubMed] [Google Scholar]
- 17.Brenman JE, Chao DS, Gee SH, et al. Interaction of nitric oxide synthase with the postsynaptic density protein PSD-95 and alpha1-syntrophin mediated by PDZ domains. Cell. 1996;84:757–767. doi: 10.1016/s0092-8674(00)81053-3. [DOI] [PubMed] [Google Scholar]
- 18.Jaffrey SR, Snyder SH. PIN: an associated protein inhibitor of neuronal nitric oxide synthase. Science. 1996;274:774–777. doi: 10.1126/science.274.5288.774. [DOI] [PubMed] [Google Scholar]
- 19.Eliasson MJ, Blackshaw S, Schell MJ, et al. Neuronal nitric oxide synthase alternatively spliced forms: prominent functional localizations in the brain. Proc Natl Acad Sci USA. 1997;94:3396–3401. doi: 10.1073/pnas.94.7.3396. [DOI] [PMC free article] [PubMed] [Google Scholar]
- 20.Hurt KJ, Sezen SF, Champion HC, et al. Alternatively spliced neuronal nitric oxide synthase mediates penile erection. Proc Natl Acad Sci USA. 2006;103:3440–3443. doi: 10.1073/pnas.0511326103. [DOI] [PMC free article] [PubMed] [Google Scholar]
- 21.Tain YL, Muller V, Szabo AJ, et al. Renal cortex neuronal nitric oxide synthase in response to rapamycin in kidney transplantation. Nitric Oxide. 2008;18:80–86. doi: 10.1016/j.niox.2007.10.001. [DOI] [PMC free article] [PubMed] [Google Scholar]
- 22.Smith C, Baylis C. Neuronal nitric oxide synthase (nNOS) in rat kidney during pregnancy. J Am Soc Nephrol. 2006;17:302A. Abstract. [Google Scholar]
- 23.Vallon V, Traynor T, Barajas L, et al. Feedback control of glomerular vascular tone in neuronal nitric oxide synthase knockout mice. J Am Soc Nephrol. 2001;12:1599–1606. doi: 10.1681/ASN.V1281599. [DOI] [PubMed] [Google Scholar]