

Abstract
Both mean genomes size and the variance in genome size among species are smaller on average in birds (class Aves) than in the other tetrapod classes. In order to test whether loss of protein-coding genes has contributed to genome size reduction in birds, we compared the chicken genome and five mammalian genomes. Numbers of members (paralogs) were significantly lower in the chicken gene families than in the corresponding mammalian families. Phylogenetic analyses of chicken, mammal, and fish paralogs supported the hypothesis that chicken-specific loss of paralogs occurred much more frequently than mammal-specific gene duplications. Moreover, the phylogenetic analyses supported the hypothesis that a substantial majority of the paralogs lost in chicken originated from duplications prior to the most recent common ancestor of tetrapods and bony fishes. In addition to loss of paralogs, numerous gene families present in the mammalian genomes were missing in the chicken genome; over 1,000 of these families were found in bony fishes, implying presence of the family in the tetrapod ancestor. In the set of families with more members on average in the mammals than in the chicken, immune system function was associated with a greater degree of gene family size reduction in the chicken, consistent with other evidence that immune system gene families have become particularly compact in birds.
Keywords: evolution of birds, gene deletion, gene duplication, genome size, immune system genes
Introduction
Mean genomes size is smaller on average in birds (class Aves) than in the other tetrapod classes, and variation in genome size is lower in birds than in the other tetrapod classes (Szarski 1976; Tiersch and Wachtel 1991). It has been proposed that reduced genome size in birds represents an adaptation to the high rate of oxidative metabolism in birds, which results primarily from the demands of flight (Szarski 1976, 1983; Tiersch and Wachtel 1991; Wachtel and Tiersch 1993; Hughes AL and Hughes MK 1995; Hughes 1999; Gregory 2002). Cell size and nuclear genome mass are correlated in vertebrates, and the cells of birds are generally smaller than the corresponding cells of mammals (Szarski 1976). Smaller cells are advantageous in an animal with a high rate of oxidative metabolism because a smaller cell has a greater surface area per volume of cytoplasm, thus facilitating gas exchange.
Several lines of evidence support the hypothesis that the reduction of genome size in birds is an adaptation and that it is correlated with the evolution of flight. Hughes AL and Hughes MK (1995) reported that introns in chickens are shorter on average than the corresponding introns of humans, although Vinogradov (1999) found that the length difference between chicken and mammalian introns was not always statistically significant, depending on the mammal species used for comparison and the statistical test employed. Hughes and Piontkivska (2005) showed that the amount of repeating DNA is reduced in the genome of the chicken in comparison to mammalian genomes; and the average length of individual simple sequence repeat arrays in the chicken is consistently smaller than arrays of the same type in human. The relatively smaller repeat array length in the chicken has involved numerous independent evolutionary events, thus strongly implying the presence of an adaptation (Hughes and Piontkivska 2005).
In addition, there is evidence that the loss or reduction in flying ability in birds is accompanied by an increase in genome size, suggesting that the reduced genome size of birds is maintained by strong purifying selection which is relaxed in flightless or poorly flying species (Hughes 1999). Organ et al. (2007) measured osteocyte size from bones of 26 extant tetrapod species and 31 extinct dinosaur species. Their results showed that cell sizes were already beginning to decrease along the lineage leading to birds, although they were not as small as those of extant flying birds, exactly as expected if reduced cell size coevolved with the high metabolic rate and activity level prerequisite for the evolution of flight.
Although numbers of members (paralogs) in different families of protein-coding genes have not been systematically compared between birds and mammals, there is some evidence suggesting that avian gene families may tend on average to have fewer members. The International Chicken Genome Sequencing Consortium (2004) noted that a somewhat higher proportion of human genes than of chicken genes had their closest hit in homology searches with a gene from the same species, suggesting more extensive recent gene duplication in human than in chicken. However, the extent of gene duplications in families is in some cases tied to function. Certain gene families (including one family of olfactory receptors, one family of taste receptors, and the ultrahigh sulfur keratin–associated protein family) are overrepresented in human in comparison to chicken (International Chicken Genome Sequencing Consortium 2004). By contrast, other families (including one family of olfactory receptors, lectin-like natural killer cell receptors, and certain histone families) are overrepresented in the chicken in comparison to human (International Chicken Genome Sequencing Consortium 2004).
Here we conduct a genome-wide comparison of gene family sizes between the chicken genome and five mammalian genomes. We test the following three hypotheses: 1) that loss of entire gene families has occurred at a greater rate in chicken than in mammals; 2) that the chicken genome includes on average smaller numbers of paralogs per gene family than found in mammals; and 3) that, when a given family has fewer members in chicken than in mammals, this situation has been caused by paralog loss in chicken more frequently than by in mammal-specific gene duplication.
In addition, we focus particular attention on immune system genes. It is known that the major histocompatibility complex (MHC) of the chicken is more compact than that of mammals, leading to its characterization as a “minimal essential” MHC (Kaufman 1999), a situation that may be characteristic of birds in general (Hughes et al. 2008). Similarly, in the chicken and possibly in all birds, the immunoglobulin genes are much reduced in number in comparison to other vertebrates, in conjunction with a mechanism of generating immunoglobulin diversity by somatic gene conversion (McCormack et al. 1991). A number of studies have found evidence that mammalian genes functioning in the immune system show on average faster rates of amino acid sequence evolution than other genes (Murphy 1993; Hughes 1997). In order to test whether immune system function is also associated with increased rates of evolutionary change in gene family size, we examined the association between immune system function and variation among genomes with respect to numbers of paralogs.
Methods
Sequences Analyzed
The following vertebrate complete genomes were obtained from Ensembl version 45 (Hubbard et al. 2007; assembly version and number of loci in parentheses): human, Homo sapiens (NCBI36; 20,318 transcripts); dog, Canis familiaris (BROADD2; 18,239); rhesus monkey, Macaca mulatta (MMUL1; 20,296); mouse, Mus musculus (NCBIM36; 22,244); rat, Rattus norvegicus (RGSC3.4; 21,263); and chicken, Gallus gallus (WASHUC2; 14,190). We used the Blastclust software (Altschul et al. 1997) to identify gene families; this program identifies homology by user-determined criteria and then links homologs into families using a single-linkage method so that each gene is assigned to only one family. As search criteria, we used a minimum E value of 10−6 and at least 30% similarity across at least 50% of the sequence lengths. These relatively relaxed criteria were chosen in order to identify as many homologs as possible between mammals and chicken (Hughes and Friedman 2004; Hughes et al. 2005).
Functional Categories
Using information from the biological process categories of the Gene Ontology project (The Gene Ontology Consortium 2000, 2008), each gene family was scored for presence of 1) one or more members having immune system function and 2) one or more members functioning in cell–cell signaling. Because many immune system molecules are involved in cell–cell signaling, we examined both these processes in order to identify distinctive characteristics of immune system gene families.
Phylogenetic Analyses
In order to test whether family size differences between the chicken and mammalian genomes are due to gene loss in the chicken or gain in the mammals, we conducted phylogenetic analyses of selected families. The families chosen met the following criteria: 1) the number of family members in the chicken was less than that in any of the mammals, 2) the coefficient of variation in family size among the mammalian genomes was less than 100%, and 3) the difference between the highest and lowest number of paralogs among the mammals was less than 10. The latter two criteria were chosen so that the phylogenetic tree included a relatively balanced representation of the five mammal genomes because it is generally believed that balanced representation of taxa yields more reliable evolutionary inferences (e.g., Heath et al. 2008).
We included homologous sequences from teleost fishes in order to provide rooting for relevant subtrees within phylogenetic trees. For our selected families, the predicted proteins from Ensembl teleost genome data for the zebrafish, Danio rerio (ZFISH7) and green puffer fish, Tetraodon nigroviridis (TETRAODON7) were added to set of proteins from chicken and mammals; and gene families were assembled as described above. The same process was used to find homologs in the two fish species of 10,227 gene families present in one or more mammals but missing from the chicken genome.
Phylogenetic trees were constructed by two methods: 1) the Neighbor-Joining (NJ) method (Saitou and Nei 1987) as implemented in the MEGA4 program (Tamura et al. 2007) and 2) the quartet maximum likelihood (QML) method implemented in the Tree-Puzzle 5.0 program (Schmidt et al. 2002). NJ trees were based on the JTT distance (Jones et al. 1992), and the reliability of clustering patterns was assessed by bootstrapping (Felsenstein 1985) using 1,000 bootstrap samples. QML trees were based on the JTT model, allowing rate variation among sites. Because NJ and QML methods yielded similar results, only the former are reported here.
In phylogenetic trees or subtrees, we identified the phylogenetic patterns associated with a mammal-specific gene duplication (fig. 1A) or bird-specific gene loss (fig. 1B). A mammal-specific gene duplication was judged to be supported at the 95% level if, in a phylogeny of the form illustrated in figure 1A, either of the two marked branches received 95% or better bootstrap support. A bird-specific gene loss was supported at the 95% level if the marked branch in figure 2B received 95% or better bootstrap support. A phylogeny of the form shown in figure 1C also supported a bird-specific gene loss. The difference between the patterns illustrated in figure 1B and C was that, in the former, it is possible to infer that the gene lost in the bird lineage arose via a gene duplication prior to the most recent common ancestor (MRCA) of tetrapods and teleosts. Note that all these inferences do not depend on the overall rooting of the tree. All that must be assumed is that a cluster (subtree) containing both fish and tetrapod genes can root other clusters in the same tree containing mammal and bird genes (together, in many cases, with additional fish genes).
FIG. 1.—
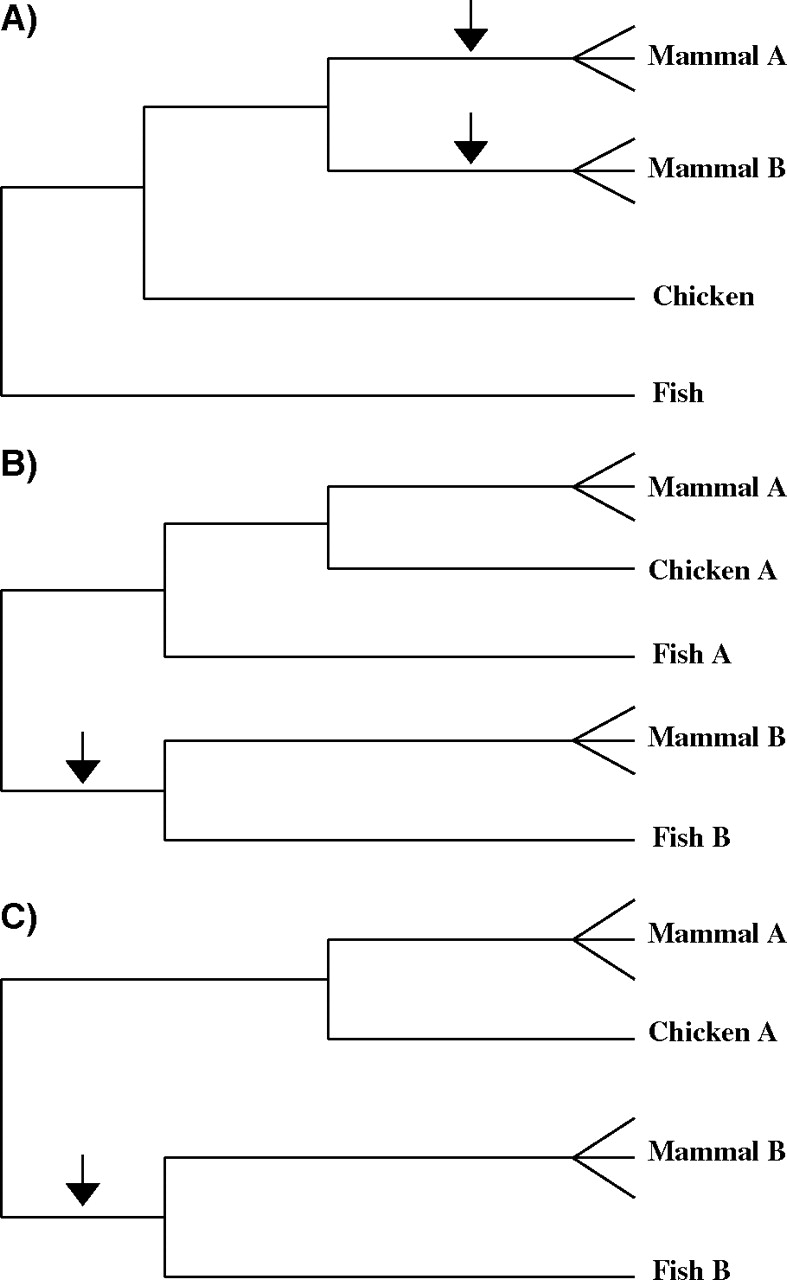
Schematic representation of phylogenetic tree topologies indicative of a mammal-specific duplication (A) or of loss of a paralog in the chicken lineage (B and C). In each case, (A) and (B) represent paralogous genes. In the case of (B), the topology supports the hypothesis that the gene lost in the chicken lineage was one that had duplicated prior to the MRCA of tetrapods and teleosts. In the case of (C), the topology supports the hypothesis that the gene lost in the chicken lineage was one that had duplicated at least prior to the MRCA of birds and mammals. Statistical support for these hypotheses was based on support for the branches marked by arrows; in (A), the higher of the support figures for the two branches indicated was used.
FIG. 2.—

(A) Numbers of gene families with gene numbers in mammals less than in chicken, equal to chicken, and greater than chicken. Average numbers for five mammal genomes and totals for each individual mammal genome are shown. Numbers of families with gene numbers greater than in chicken were significantly more numerous than the reverse (sign test; Bonferroni-corrected P < 0.001 in each case). (B) Numbers of gene families with gene numbers less than in chicken, equal to chicken, and greater than chicken in families with at least one member in each of the five mammalian genomes and in the chicken. Numbers of families with gene numbers greater than in chicken were significantly more numerous than the reverse (sign test; Bonferroni-corrected P < 0.001 in each case).
Results
Gene Family Numbers
We identified 18,516 gene families present in at least one of the six genomes analyzed (the chicken genome and the five mammalian genomes). In 11,988 (64.7%) of these families, the mean number of family members in mammals was greater than the number of family members in the chicken, whereas in only 4,469 families (24.1%), the member of family members in chicken exceeded the mammalian average. The difference between the two quantities was highly significant (sign test; P < 0.001, Bonferroni-corrected for multiple testing; fig. 2A). In only 2,059 families (11.1%), the number of family members in the chicken was equal to the mammalian average (fig. 1A).
We analyzed the 18,516 gene families separately for each of the five mammalian genomes. In each case, the number of families with more members in the mammal than in the chicken was significantly greater than the number of families with more members in the chicken than in the mammal (fig. 2A; sign test; P < 0.001, Bonferroni-corrected for multiple testing, in each case). The ratio of the number of families with more members in the mammal than in the chicken to the number of families with more members in the chicken than in the mammal ranged from 1.41 in the case of the dog to 1.85 in the case of the mouse (fig. 2A).
Of the 18,516 families, a total of 10, 227 (55.2%) were missing entirely from the chicken genome. The largest number of families missing from any of the mammalian genomes was 9,643 (52.1%) missing from the rat. The genome with the lowest proportion of families missing was the human, with 8,482 (45.8%) families missing.
In the comparisons between the chicken and individual mammalian genomes, the proportion of families with equal numbers of members in the mammal and in the chicken was quite high, ranging from 52.7% in the case of human to 62.9% in the case of the dog (fig. 2A). A substantial proportion of the families with equal numbers in the chicken genome and in one of the mammalian genomes were either families absent in both genomes or families that were represented by a single member (singletons) in each genome. For example, of 9,797 genes with equal numbers in the human and chicken genome, 5,730 (58.7%) were absent from both genomes and 3,247 (33.3%) were singletons in both genomes. Similar results were seen in the case of the other four mammalian genomes (data not shown).
In order to test whether the large proportion of missing gene families influenced the results, we analyzed separately for each of the five mammalian species the set of families with at least one member in that species and in the chicken (fig. 2B). In each case, the number of families with more members in the mammal than in the chicken was significantly greater than the number of families with more members in the chicken than in the mammal (fig. 2B; sign test; P < 0.001, Bonferroni-corrected for multiple testing, in each case). The ratio of the number of families with more members in the mammal than in the chicken to the number of families with more members in the chicken than in the mammal ranged from 2.82 in the rat to 3.88 in the mouse (fig. 2A). In these comparisons, the proportion of families with equal numbers of members in the mammal and in the chicken was again high, ranging from 70.1 % in the rat to 74.5% in the dog (fig. 2B). A substantial proportion of the cases with equal numbers in the mammal and the chicken were singletons. For example, of 4,033 families with equal numbers of members in the chicken and in the human, 3,247 (80.5%) were singletons; the results were similar for the other four mammal species (data not shown).
Overall, there were 1,903 families with exactly the same number of members in the chicken and in all five mammalian species. Of these, 1,692 (88.8%) were singletons; 173 (9.1%) were two member families; 32 (1.7%) were three-member families; 5 (0.3%) were four-member families; and 1 (0.1%) was a six-member family (the lipase family).
Missing Families
There were 16,442 families having at least one member in at least one of the five mammalian species. Of these families, 11,100 (67.5%) were missing entirely in at least one of the mammalian genomes. Of the 11,100 families missing entirely in at least one of the mammalian genomes, 9,162 (82.5%) were also missing from the chicken genome. By contrast, of 5,342 families present in all five mammalian genomes, only 1,065 (19.9%) were missing from the chicken genome. The difference in proportions was highly significant (χ2 = 6011.7; 1 degree of freedom; P < 0.001).
We used the coefficient of variation (CV = standard deviation/mean × 100%) as a scale-free measure of the variation in number of paralogs across the mammalian genomes analyzed. We computed the CV in number of paralogs in mammals for each of the 16,442 families having at least one member in at least one of the five mammalian species. We categorized families as to whether or not the family was missing in at least one mammal and as to whether or not it was present in the chicken and compared median CV in the number of paralogs in mammals among categories (fig. 3). There was a highly significant difference in median CV among categories (fig. 3). If the family was missing in at least one mammal, median CV for families missing in the chicken (223.6%) greatly exceeded that for families present in the chicken (63.9%; fig. 3). On the other hand, in the case of families not missing in any of the mammals, median CV for families present in the chicken (6.2%) was greater than that for families missing in the chicken (0.0%; fig. 3).
FIG. 3.—

Median CV (%) in the number of paralogs for gene families categorized on the basis of presence or absence in the chicken and on the basis of presence in all mammals or absence in at least one mammal. Numbers over bars are numbers of families in each category. There was a significant difference in median among categories (P < 0.001; Kruskal–Wallis test).
Of the 10,227 families missing from the chicken genome, 1,749 (17.1%) were found by homology search to include homologues in the zebrafish, the green puffer fish, or both these teleost fishes. The absence of these 1,749 families in the chicken could thus be attributed to loss of families present in the tertrapod ancestor. The median CV in number of paralogs in mammals in the case of these 1,749 genes (70.7%) was significantly lower than that of the remaining 8,479 families missing in mammal (median CV = 223.6%; Mann–Whitney test; P < 0.001). Moreover, 585 (33.4%) of the 1,749 ancestral families lost in the chicken were present in all five mammalian genomes; and 349 of these (20.0% of the 1,749 ancestral families) showed no variation in number of paralogs among the five mammalian genomes. Thus, the ancestral families lost in the chicken included a substantial number whose presence in mammalian genomes was conserved.
Phylogenetic Analyses
We used phylogenetic analyses of families with more members in the mammal genomes than in the chicken genome in order to test whether the lower family sizes in the chicken were due to mammal-specific duplications or gene loss in the chicken. In our data set, there were a total of 330 families in which one or more branches receiving 50% bootstrap support or better supported either gene duplication in the mammals before radiation of the placental orders (fig. 1A) or gene loss in the chicken lineage (fig. 1B and C). In these families, there were 486 events of gene loss in the chicken lineage receiving 50% bootstrap support or better, as compared with only 36 events of mammal-specific gene duplication. Thus, in these data, the ratio of gene loss in birds to mammal-specific gene duplication was 13.5:1. Of the 486 cases of gene loss, in 429 cases (88.3%), the phylogeny supported the hypothesis that the gene lost in birds originated by gene duplication before the MRCA of bony fish and tetrapods.
The results were similar when a more stringent bootstrap criterion was used. There were a total of 264 families in which one or more branches receiving 95% bootstrap support or better supported either gene duplication in the mammals before radiation of the placental orders (fig. 1A) or gene loss in the chicken lineage (fig. 1B and C). In these families, there were 342 events of gene loss in the chicken lineage receiving 95% bootstrap support or better, as compared with only 28 events of mammal-specific gene duplication. The ratio of gene loss in birds to mammal-specific gene duplication was thus about 12:1 in these data. Of the 342 cases of gene loss, in 298 cases (87.1%), the phylogeny supported the hypothesis that the gene lost in birds originated by gene duplication before the MRCA of bony fish and tetrapods.
The t-complex protein-11 (TCP-11) family provides an example of a mammal-specific duplication (fig. 4). The phylogenetic tree supported the hypothesis that there are two ancient TCP-11–like paralogs, TCP-11L1 and TCP-11L2, in mammalian genomes, which are shared by chicken and zebrafish (fig. 4). The tree thus supported the hypothesis that TCP-11L1 and TCP-11L2 arose by gene duplication prior to the MRCA of bony fish and tetrapods (fig. 4). On the other hand, the tree supported the hypothesis that the TCP-11 gene has duplicated in mammals, giving rise to an autosomally located copy (TCP-11) and a copy on the X chromosome TCP-11-X (fig. 4). The fact that a single chicken gene formed an outgroup to the mammalian TCP-11 and TCP-11-X clusters supported the hypothesis that this duplication occurred in the mammalian lineage after its divergence from the avian lineage (fig. 4).
FIG. 4.—

NJ tree of the t-complex protein-11 (TCP-11) family, illustrating a mammal-specific duplication (that of TCP-11 and TCP-11-X). The tree was based on the JTT distance at aligned amino acid positions. Numbers on the branches represent the percentage of 1,000 bootstrap samples supporting a given branch. Sequences are designated by Ensembl accession numbers.
Figure 5 shows an example of a family in which the phylogeny supports loss of an ancient paralog in the chicken. This family includes phosphoglucomutase 2 (PGM2) and phosphoglucomutase 2–like 1 (PGM2L1). The latter molecule has been shown to have activity as a glucose-1,6-bisphosphate synthase and a high level of expression in the brain (Maliekal et al. 2007). The tree supported the hypothesis that these two genes arose by an ancient duplication prior to the MRCA of tetrapods and bony fishes (fig. 5). However, the chicken lacks a PGM2L1 gene, supporting loss of this ancient gene in the chicken (fig. 5). Maliekal et al. (2007) reported a similar topology in a phylogenetic analysis of this family including not only vertebrate but also invertebrate, protist, and yeast PGM2 genes.
FIG. 5.—

NJ tree of the phosphoglucomutase 2 (PGM2) family, illustrating loss of one paralog (PGM2L1) in the chicken lineage. The tree was based on the JTT distance at aligned amino acid positions. Numbers on the branches represent the percentage of 1,000 bootstrap samples supporting a given branch. Sequences are designated by Ensembl accession numbers.
Immune System Families
In 11,988 families, the mean number of paralogs in the mammalian genomes was greater than the number of paralogs in the chicken. These families were classified on the basis of presence or absence of immune system function and presence or absence of a function in cell–cell signaling. There was a highly significant difference in median CV in the number of paralogs among categories (P < 0.001; Kruskal–Wallis test; fig. 6A). Median CV in the number of paralogs in mammals was much higher (223.6%) for families lacking either immune or cell–cell signaling functions than for families having one or both these functions (fig. 6A). On the other hand, when families lacking either immune or cell–cell signaling functions were excluded from the analysis, there was no significant difference (Kruskal–Wallis test) among the three remaining categories with respect to median CV in the number of paralogs.
FIG. 6.—
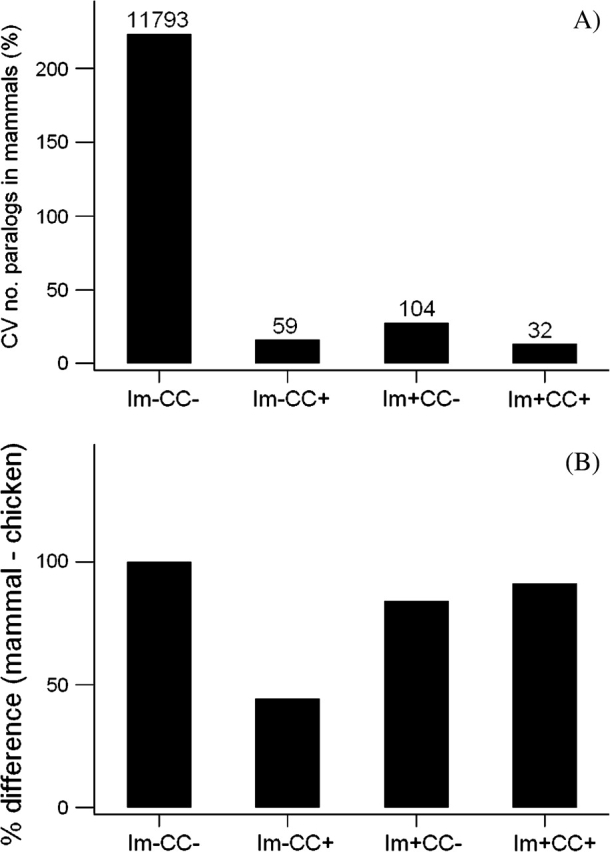
(A) Median CV (%) in the number of paralogs for 11,988 families for which the mean number of paralogs in the mammalian genomes was greater than the number of paralogs in the chicken; and (B) median % difference between mammal and chicken for the same set of families. In each case, the families are characterized by the presence (Im+) or the absence (Im−) of immune system function and by the presence (CC+) or the absence (CC−) of cell–cell signaling function. The numbers of families in each category are given in (A). In each case, there was a significant difference among categories (P < 0.001 in each case; Kruskal–Wallis test).
For the same set of genes, we also computed the difference between the mean number of paralogs in mammals and the number of paralogs in the chicken and then expressed this difference as a percentage of the mean number of paralogs in mammals (% difference; fig. 6B). Categories differed significantly with respect to median % difference (P < 0.001; Kruskal–Wallis test; fig. 6B). The median % difference was highest (100%) in the families lacking both immune system function and cell–cell signaling function (fig. 6B). On the other hand, median % difference was nearly twice as high in families having an immune system function but not a cell–cell signaling function (84.2%) than in families having a cell–cell signaling function but not an immune system function (44.4%). The median % difference was similarly elevated in families having both an immune system function and a cell–cell signaling function (91.1%; fig. 6B). Moreover, when families lacking either immune or cell–cell signaling functions were excluded from the analysis, there was a significant difference (P = 0.009; Kruskal–Wallis test) among the three remaining categories with respect to median % difference. Thus, in these families, immune system function was not associated with increased variation in family size among mammals. However, immune system function was associated with a greater degree of gene family size reduction in the chicken relative to mammals than was either cell–cell signaling function along or the absence of either immune or cell–cell signaling function.
Discussion
In order to test the hypothesis that a reduced number of gene family members has accompanied the reduction of genome sizes of birds, we compared the numbers of members (paralogs) in 18,516 gene families in the genomes of five mammals and the chicken. Consistent with our hypothesis, chicken gene families had fewer members than their mammalian counterparts in significantly more cases than the reverse was true. The same pattern was seen in comparison with the mammalian average and with the individual mammalian genomes.
A higher proportion of gene families were missing entirely from the chicken genome than from the mammalian genomes. Certain families had a tendency to be missing from genomes of both birds and mammals. Over 80% of families missing from one or more of the mammalian genomes were also missing from the chicken, whereas only about 20% of the families present in all five of the mammalian genomes were absent in the chicken genome. In addition, for families missing in at least one mammal, the number of paralogs across the mammalian species was much more variable for families missing in the chicken than for families present in the chicken. Thus, many families missing in the chicken genome evidently belong to a set of families whose membership is relatively unconstrained in mammals as well.
The International Chicken Genome Sequencing Consortium (2004) estimated that a certain proportion of genes (5–10%) might be missing from the Ensembl prediction set available at that time. The more recent Ensembl set used here is based on a 46.5 Mb larger assembly yet actually includes 5.7% fewer predicted genes than the earlier assembly, suggesting that the initial projections regarding the total number of genes in the chicken genome may have been inflated. Certain genes are no doubt missing from the chicken gene set, but the same is no doubt true of all the mammalian genome assemblies analyzed here. Thus, although there may be some errors in genome assembly and gene prediction in all the species analyzed, it seems very unlikely that these factors alone can account for the striking differences in numbers of paralogs observed between the chicken genome and those of mammals.
By contrast, homology search involving genomes of the zebrafish and puffer fish revealed 1,749 gene families present in bony fishes and at least one mammal but absent from the chicken. We thus can infer that these families were present in the ancestral tetrapods but have been lost in the chicken lineage. Many of these families, in contrast to others missing from the chicken genome, showed relatively little variation in family size among mammals; and 20% of these families showed no variation in size among the five mammalian genomes. Thus, the ancestral families lost in the chicken included many with a strongly conserved presence in mammals.
In phylogenetic analyses of gene families with more members in the mammals than in the chicken, we found that reduced family sizes in the chicken were due to gene loss in the chicken far more frequently (by a ratio of about 12:1) than they were due to mammal-specific gene duplications. Moreover, a substantial majority of the paralogs lost in the chicken were genes that could be shown by phylogenetic analysis to have arisen by duplication prior to the MRCA of tetrapod and teleost lineages. Thus, the evolution of birds involved substantial loss of ancestral duplicates.
Certain models of the evolution of new gene function postulate that duplicate genes may undergo complementary loss-of-function mutations, thereby rendering loss of either duplicate deleterious to fitness (Lynch and Force 2000). The fact that birds were able to eliminate numerous ancient duplicated genes is thus surprising because it implies that a substantial fraction of duplicates have not undergone an irreversible loss of complementary functions. In some cases, the ability to forego a certain function may have been a consequence of unique avian adaptations. For example, the PGM2L1 protein, which has been lost in the chicken (fig. 6), functions in mammals as a glucose-1,6-bisphosphate synthase, with particularly high levels of expression in the brain (Maliekal et al. 2007). Glucose-1,6-bisphosphate is hypothesized to play a regulatory role in hypoxia in mammals (Maliekal et al. 2007); the fact that, because of the more efficient avian respiratory system, the avian brain is better supplied with oxygen under hypoxic conditions than is the mammalian brain (Bouverot 1978) may eliminate the need for a brain-specific glucose-1,6-bisphosphate synthase in birds.
Although our phylogenetic analyses documented relatively few mammal-specific gene duplications, some of these also may be relevant to biological differences between mammals and birds. For example, there was evidence of a mammal-specific duplication of TCP-11, which gave rise to an autosomal copy and a copy that is located on the X chromosome in each of the five mammals analyzed here (fig. 5). This duplication presumably occurred in conjunction with the evolution of the XY sex determination mechanism in mammals, which differs from the female-heterogametic system found in birds.
In the set of families with more members on average in the mammals than in the chicken, immune system function was associated with an enhanced degree of gene family size reduction in the chicken relative to mammals. It is well known that birds have reduced numbers in the MHC and immunoglobulin gene families in comparison to most other vertebrates (McCormack et al. 1991; Kaufman 1999); and our results suggest that there may be a general trend toward compact family sizes in avian immune system genes. Our results support the hypothesis that, in the evolution of birds, the immune system has exhibited exceptional evolutionary flexibility in conforming to a general pattern of gene family size reduction.
Like other members of the family Phasianidae, the chicken has a relatively small genome size, even for birds (Tiersch and Wachtel 1991). In the absence of a complete genome representing another avian lineage, it is not possible to determine to what extent other bird genomes show a similar pattern of loss of protein-coding genes to that seen in the chicken. However, our results suggest that the loss of protein-coding genes may have accompanied the overall reduction of genome size in birds, along with the reduction in intron size (Hughes AL and Hughes MK 1995) and the loss of repeating DNA (Hughes and Piontkivska 2005). Quantitatively speaking, the loss of repeating DNA has made by far a greater contribution to the reduction of genome size than any other factor (Hughes and Piontkivska 2005). Nonetheless, our results suggest that the evolution of birds may have involved an overall simplification of the genome. If so, it is unclear how far back in the Archosauria the loss of paralogs began, but the genomes of extant Crocodilia can be expected to provide information regarding the extent to which the process of gene family size reduction had already begun in ancestral archosaurs.
Supplementary Material
Acknowledgments
This research was supported by grant GM43940 from the National Institutes of Health.
References
- Altschul SF, Madden TL, Schäffer AA, Zhang J, Zhang Z, Miller W, Lipman DJ. Gapped BLAST and PSI-BLAST: a new generation of protein database search programs. Nucleic Acids Res. 1997;25:3389–3402. doi: 10.1093/nar/25.17.3389. [DOI] [PMC free article] [PubMed] [Google Scholar]
- Bouverot P. Control of breathing in birds compared with mammals. Physiol Rev. 1978;58:604–655. doi: 10.1152/physrev.1978.58.3.604. [DOI] [PubMed] [Google Scholar]
- Felsenstein J. Confidence limits on phylogenies: an approach using the bootstrap. Evolution. 1985;39:783–791. doi: 10.1111/j.1558-5646.1985.tb00420.x. [DOI] [PubMed] [Google Scholar]
- Gregory TR. A bird's-eye view of the C-value enigma: genome size, cell size, and metabolic rate in the class Aves. Evolution. 2002;56:121–130. doi: 10.1111/j.0014-3820.2002.tb00854.x. [DOI] [PubMed] [Google Scholar]
- Heath TA, Zwickl DJ, Kim J, Hillis DM. Taxon sampling affects inferences of macroevolutionary processes from phylogenetic trees. Syst Biol. 2008;57:160–166. doi: 10.1080/10635150701884640. [DOI] [PubMed] [Google Scholar]
- Hubbard TJ, Aken BI, Beal K, Ballester B, Caccamo M, Chen Y, Clarke L, Coates G, Cunningham F, Cutts T, et al. (58 co-authors) Nucleic Acids Res. 2007;35:D610–D617. doi: 10.1093/nar/gkl996. [DOI] [PMC free article] [PubMed] [Google Scholar]
- Hughes AL. Rapid evolution of immunoglobulin superfamily domains expressed in immune system cells. Mol Biol Evol. 1997;14:1–5. doi: 10.1093/oxfordjournals.molbev.a025694. [DOI] [PubMed] [Google Scholar]
- Hughes AL. Adaptive evolution of genes and genomes. New York: Oxford University Press; 1999. [Google Scholar]
- Hughes AL, Ekollu V, Friedman R, Rose JR. Gene family content-based phylogeny of prokaryotes: the effect of search criteria. Syst Biol. 2005;54:268–276. doi: 10.1080/10635150590923335. [DOI] [PubMed] [Google Scholar]
- Hughes AL, Friedman R. Shedding genomic ballast: extensive parallel loss of ancestral gene families in animals. J Mol Evol. 2004;59:827–833. doi: 10.1007/s00239-004-0115-7. [DOI] [PubMed] [Google Scholar]
- Hughes AL, Hughes MK. Small genomes for better flyers. Nature. 1995;377:391. doi: 10.1038/377391a0. [DOI] [PubMed] [Google Scholar]
- Hughes AL, Piontkivska H. DNA repeat arrays in chicken and human genomes and the adaptive evolution of avian genome size. BMC Evol Biol. 2005;5:12. doi: 10.1186/1471-2148-5-12. [DOI] [PMC free article] [PubMed] [Google Scholar]
- Hughes CR, Miles S, Walbroel JM. Support for the minimal essential MHC hypothesis: a parrot with a single, highly polymorphic class II B gene. Immunogenetics. 2008;60:219–231. doi: 10.1007/s00251-008-0287-1. [DOI] [PubMed] [Google Scholar]
- International Chicken Genome Sequencing Consortium. Sequence and comparative analysis of the chicken genome provide unique perspectives on vertebrate evolution. Nature. 2004;432:695–777. doi: 10.1038/nature03154. [DOI] [PubMed] [Google Scholar]
- Jones DT, Taylor WR, Thornton JM. The rapid generation of mutation data matrices from protein sequences. Comput Appl Biosci. 1992;8:275–282. doi: 10.1093/bioinformatics/8.3.275. [DOI] [PubMed] [Google Scholar]
- Kaufman J. The chicken B locus is a minimal essential major histocompatibility complex. Nature. 1999;410:923–925. doi: 10.1038/44856. [DOI] [PubMed] [Google Scholar]
- Lynch M, Force A. The probability of duplicate gene preservation by subfunctionalization. Genetics. 2000;154:459–473. doi: 10.1093/genetics/154.1.459. [DOI] [PMC free article] [PubMed] [Google Scholar]
- Maliekal P, Sokolova T, Vertommen D, Veiga-da-Cunha M, Van Schaftingen E. Molecular identification of mammalian phosphopentomutase and glucose-1,6-bisphosphate synthase, two members of the α-D-phosphohexomutase family. J Biol Chem. 2007;282:31844–31851. doi: 10.1074/jbc.M706818200. [DOI] [PubMed] [Google Scholar]
- McCormack WT, Tjoelker LW, Thompson CB. Avian B-cell development: generation of an immunoglobulin repertoire by gene conversion. Annu Rev Immunol. 1991;9:219–241. doi: 10.1146/annurev.iy.09.040191.001251. [DOI] [PubMed] [Google Scholar]
- Murphy PM. Molecular mimicry and the generation of host defense protein diversity. Cell. 1993;72:823–826. doi: 10.1016/0092-8674(93)90571-7. [DOI] [PubMed] [Google Scholar]
- Organ CL, Shedlock AM, Meade A, Pagel M, Edwards SV. Origin of avian genome size and structure in non-avian dinosaurs. Nature. 2007;446:181–184. doi: 10.1038/nature05621. [DOI] [PubMed] [Google Scholar]
- Saitou N, Nei M. The neighbor-joining method: a new method for reconstructing phylogenetic trees. Mol Biol Evol. 1987;4:406–425. doi: 10.1093/oxfordjournals.molbev.a040454. [DOI] [PubMed] [Google Scholar]
- Schmidt HA, Strimmer K, Vingron M, von Haeseler A. TREE-PUZZLE: maximum likelihood phylogenetic analysis using quartets and parallel computing. Bioinformatics. 2002;18:502–504. doi: 10.1093/bioinformatics/18.3.502. [DOI] [PubMed] [Google Scholar]
- Szarski H. Cell size and nuclear DNA content in vertebrates. Int Rev Cytol. 1976;44:93–209. doi: 10.1016/s0074-7696(08)61648-4. [DOI] [PubMed] [Google Scholar]
- Szarski H. Cell size and the concept of wasteful and frugal evolutionary strategies. J Theor Biol. 1983;105:201–209. doi: 10.1016/s0022-5193(83)80002-2. [DOI] [PubMed] [Google Scholar]
- Tamura K, Dudley J, Nei M, Kumar S. MEGA4: molecular evolutionary genetics analysis (MEGA) software version 4.0. Mol Biol Evol. 2007;24:1596–1599. doi: 10.1093/molbev/msm092. [DOI] [PubMed] [Google Scholar]
- The Gene Ontology Consortium. Gene Ontology: tool for the unification of biology. Nature Genet. 2000;25:25–29. doi: 10.1038/75556. [DOI] [PMC free article] [PubMed] [Google Scholar]
- The Gene Ontology Consortium. The Gene Ontology project in 2008. Nucleic Acids Res. 2008;36:D440–D444. doi: 10.1093/nar/gkm883. [DOI] [PMC free article] [PubMed] [Google Scholar]
- Tiersch TT, Wachtel SS. On the evolution of genome size in birds. J Hered. 1991;82:363–368. doi: 10.1093/oxfordjournals.jhered.a111105. [DOI] [PubMed] [Google Scholar]
- Vinogradov AE. Intron-genome size relationship on a large evolutionary scale. J Mol Evol. 1999;49:376–384. doi: 10.1007/pl00006561. [DOI] [PubMed] [Google Scholar]
- Wachtel SS, Tiersch TR. Variations in genome mass. Comp Biochem Physiol B. 1993;104:207–213. doi: 10.1016/0305-0491(93)90360-h. [DOI] [PubMed] [Google Scholar]
Associated Data
This section collects any data citations, data availability statements, or supplementary materials included in this article.