Abstract
The dynamics of water in Aerosol-OT reverse micelles are investigated with ultrafast infrared spectroscopy of the hydroxyl stretch. In large reverse micelles, the dynamics of water are separable into two ensembles: slow interfacial water and bulklike core water. As the reverse micelle size decreases, the slowing effect of the interface and the collective nature of water reorientation begin to slow the dynamics of the core water molecules. In the smallest reverse micelles, these effects dominate and all water molecules have the same long time reorientational dynamics. To understand and characterize the transition in the water dynamics from two ensembles to collective reorientation, polarization and frequency selective infrared pump-probe experiments are conducted on the complete range of reverse micelle sizes from a diameter of 1.6–20 nm. The crossover between two ensemble and collective reorientation occurs near a reverse micelle diameter of 4 nm. Below this size, the small number of confined water molecules and structural changes in the reverse micelle interface leads to homogeneous long time reorientation.
INTRODUCTION
Water is not present as the pure bulk liquid in many naturally occurring and manmade systems. Usually, it is interacting with an interface, various solutes, or both. In some instances, only a small fraction of the water may be directly interacting with an interface or solute. At other times, water is in small pores or trapped between biomolecules and nearly all of the water is in contact with a surface. In the first case, most of the water is expected to behave like bulk water since it is far from an interface with only the water near the surface perturbed by interfacial interactions. In the second case, water might be expected to behave quite differently than bulk water since almost all water molecules are in contact with a surface. Both of these extremes occur in real situations including biological, geological, and chemical systems. Of particular interest is the intermediate regime in which a substantial fraction of the water is not in direct contact with the interface, yet the presence of the interface begins to play an important role in the dynamics of all the confined water. To understand the transition between the mostly bulk and mostly interfacial regimes, it is useful to explore a model system that can be tuned through this entire range.
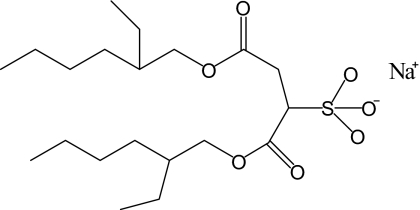
The ternary system of Aerosol-OT (AOT), water, and isooctane has proven to be a very useful model system for studying confined water and water near an interface. AOT is a surfactant that has an anionic sulfonate head group and sodium counter ion, which preferentially partition into the aqueous phase and branched, bulky alkyl tails that prefer a nonpolar phase. The structure of AOT is shown in Fig. 1. AOT forms well characterized, reverse micelles (spherical water pools) over a wide range of sizes with water nanopools ranging from radii of less than 1 nm up to tens of nanometers.1, 2, 3 Reverse micelles can be characterized by the parameter w0, the number of water molecules per surfactant molecule, w0=[H2O]∕[AOT]. The smallest reverse micelles have nearly all the water interacting directly with the interface while the largest have only a small fraction of the water interacting with the interface. The variation in the reverse micelle size permits the dynamics of water to be studied over the complete range.
Figure 1.
The structure of AOT.
The dynamics of water in AOT reverse micelles have been studied using a variety of techniques including nuclear magnetic resonance (NMR),4, 5 fluorescence,6, 7, 8, 9, 10, 11 neutron scattering,12 dielectric relaxation,13 molecular dynamics (MD) simulations,14, 15 and ultrafast infrared (IR) spectroscopy.16, 17, 18, 19, 20, 21, 22, 23, 24, 25, 26, 27 All of these techniques indicate that the dynamics of water slow as the reverse micelle size decreases. Ultrafast IR spectroscopy is particularly useful for studying the dynamics of confined water because the time resolution of the experiment allows the water dynamics to be directly measured on a picosecond time scale. In addition, the hydroxyl stretch absorption frequency is sensitive to the local hydrogen bonding environment of a water molecule, and the dynamics of water at different frequencies report on different water environments.
Piletic et al.17 presented a detailed study of the reverse micelle size dependent water dynamics at a single hydroxyl stretching frequency for each reverse micelle. In these experiments as in the ones discussed below, the OD stretch of dilute HOD in H2O was studied to eliminate vibrational excitation transfer, which interferes with the measurements. A core∕shell model consisting of a bulk water component and an interfacial water component that had the same characteristics as the smallest reverse micelle was shown to accurately reproduce the IR spectrum and vibrational lifetime of the OD stretch for all reverse micelle sizes. However, the orientational dynamics reported by the anisotropy decay did not fit the same core∕shell model. The dynamics in the large reverse micelles at the single frequency probed near the peak of the absorption spectrum appeared to be quite similar to bulk water. In the small reverse micelles, the dynamics were much slower and were analyzed using a wobbling-in-a-cone model28 for restricted orientational motion which assumed that all of the water molecules in the reverse micelle had the same dynamics.17 Later, Bakker and co-workers24 showed by probing several OH stretching frequencies of HOD in D2O AOT reverse micelles that the observed orientational dynamics of water in larger reverse micelles differed depending on the measurement wavelength. The differences were related to whether the water was close to or far from the interface. These experiments indicated that in large reverse micelles the orientational dynamics of the confined water were not completely coupled as they were in the smallest reverse micelles.24
Recently, Moilanen et al.27, 29 presented a detailed examination of the OD stretch of HOD in H2O in large AOT reverse micelles and lamellar structures (planar water sheets). The purpose of those studies was to measure the orientational dynamics of interfacial water when a significant bulklike pool was present as well as to determine the influence of geometry on the dynamics of confined water. In large reverse micelles, a significant amount of water is far from the interface, forming a bulklike water core, but by probing certain spectral regions, the contribution from the interfacial water was extracted. A two ensemble model consisting of a core of bulklike water and a shell of interfacial water was successful at describing the dynamics of water in all the large reverse micelles and lamellar structures studied. The dynamics of interfacial water in these water rich systems was independent of the size or geometry of the system with a characteristic vibrational lifetime of 4.3 ps and an orientational correlation time of 18 ps. From these results it was shown that the presence of an interface primarily affects only the water directly in contact with it in water rich systems, in agreement with NMR and MD simulation results of water interacting with the surface of biomolecules30, 31, 32, 33, 34 and model membranes.35, 36
While the dynamics in these water rich systems (large reverse micelles) were separable into two components it is important to note that the reorientational motion of water is, in general, a collective process involving concerted reorganization of both the first and second solvation shells of the reorienting water molecule.37, 38 This suggests that when the number of confined water molecules is small, the slow dynamics of water at the interface will affect the dynamics of the next water layer as well. MD simulations of water in small reverse micelles with w0<10 show that the effect of the interface dies off quickly as the distance from the interface increases, yet the water dynamics never reach bulklike behavior.15 Piletic et al. suggested that in small reverse micelles the collective nature of the hydrogen bonding network led to water dynamics that were homogeneous throughout the reverse micelle.
In this paper we examine the full range of sizes and interactions from the collective homogeneous dynamics in small reverse micelles to the two ensemble dynamics in large reverse micelles as well as the transition between these two. We present a complete size and frequency dependent study of the dynamics of water in AOT reverse micelles ranging in radius from less than 1 up to 10 nm. The results for the large reverse micelles have been described previously.27, 29 Here we will briefly discuss the large reverse micelles then focus on the small reverse micelles and the transition between the extremes of small and large which occurs at w0∼10.
EXPERIMENTAL PROCEDURES
Aerosol OT [sodium bis(2-ethylhexyl) sulfosuccinate], isooctane, H2O, and D2O (Aldrich, Inc.) were used as received. A 0.5 M stock solution of AOT in isooctane was prepared and the residual water content in the stock solution was determined by Karl Fischer titration to be 0.5 water molecules per AOT (w0=0.5). A stock solution of 5% HOD in H2O was added to the measured amounts of the 0.5 M stock solution to prepare reverse micelles with the desired w0. Reverse micelle sizes for a given w0 have been determined by photon correlation spectroscopy1 and viscosity measurements.2 Seven reverse micelles were studied with w0=2, 5, 10, 16.5, 25, 37, and 46 and diameters of 1.6, 2.3, 4.0, 5.8, 9.0, 17, and 20 nm, respectively.
Samples for IR absorption and ultrafast IR experiments were contained in sample cells composed of two CaF2 windows separated by a Teflon spacer. The thickness of the spacer was selected to maintain an optical density of ∼0.5 in the OD stretch region for all samples. The OD stretch of dilute HOD in H2O is used to eliminate problems due to vibrational excitation transfer that can cause artificial decay of the orientational correlation function.39, 40 MD simulations of HOD in bulk H2O demonstrate that dilute HOD does not change the properties of water, and the dynamics of HOD report on the dynamics of water.41
The laser system used for these experiments consists of a Ti:sapphire oscillator and regenerative amplifier pumping an OPA and difference frequency stage to produce ∼70 fs pulses at ∼4 μm. (2500 cm−1) The mid-IR light was split into an intense pump pulse and a weak probe pulse. Before the sample, the polarization of the pump pulse is rotated from horizontal to 45° relative to the horizontally polarized probe. The pump pulse is passed through a polarizer set to 45° immediately before the sample to ensure that the HOD molecules are excited by a linearly polarized pump pulse. The polarization of the probe is resolved parallel and perpendicular (+45° and −45° relative to vertical) to the pump after the sample using a computer controlled rotation stage. Another polarizer immediately after the resolving polarizer and just before the input to the monochromator is used to set the polarization entering the monochromator to horizontal to eliminate differences in the polarization dependent reflection and diffraction efficiencies in the monochromator.42 The probe is frequency dispersed by the monochromator and detected using a 32 element MCT detector (Infrared Associates and Infrared Systems Design).
The pump-probe signal measured parallel (I∥) and perpendicular (I⊥) to the pump polarization contains information about both the population relaxation and the orientational dynamics of the HOD molecules,43
| (1) |
| (2) |
where P(t) is the vibrational population relaxation and C2(t) is the second Legendre polynomial orientational correlation function. Pure population relaxation can be extracted from the parallel and perpendicular signals using
| (3) |
In the case of a single ensemble of molecules undergoing orientational relaxation, the orientational correlation function C2(t) can be determined from the anisotropy r(t) by
| (4) |
When multiple ensembles are present in a system, the population relaxation given in Eq. 3 is a weighted sum of the population relaxation of the ensembles. The expression for the anisotropy, Eq. 4, becomes much more complicated when more than one ensemble contributes to the signal, and it is no longer possible to divide out the population relaxation. These complications and methods for extracting the orientational correlation function of interfacial water have been discussed in detail previously27, 29 and will be briefly discussed in the text below.
RESULTS and DISCUSSION
Water dynamics in large reverse micelles: Two ensembles of water
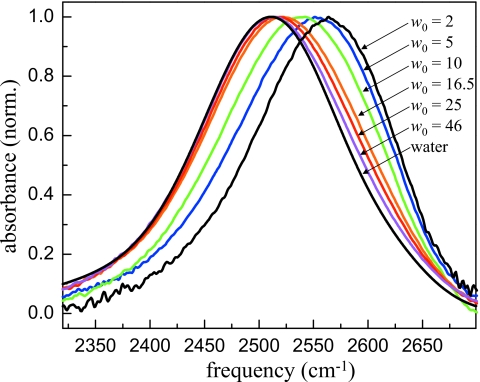
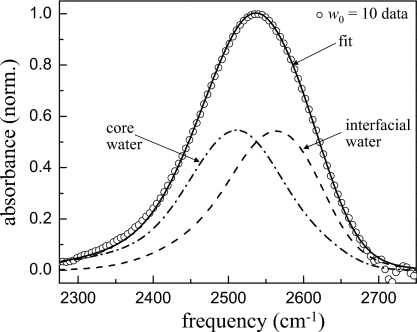
Large reverse micelles (w0≥16.5) have a significant amount of water that is more than two hydration shells away from the interface. Recently, it was shown that the dynamics of water in large reverse micelles could be separated into two ensembles, a bulklike ensemble in the core of the reverse micelle and an interfacial ensemble associated with water molecules directly interacting with the surface.27 To identify the spectral region most likely to contain information about the interface, the IR spectrum of the OD stretching mode of HOD in H2O was decomposed into bulk and interfacial components. The OD stretch is sensitive to the local electric fields and hydrogen bonding network around the HOD molecule.44 Figure 2 shows the IR absorption spectrum of the OD stretch of dilute HOD in H2O in AOT reverse micelles with bulk water for comparison. The largest reverse micelle w0=46 has an IR spectrum that is similar to bulk water but slightly shifted to higher frequency. As the reverse micelle size decreases, the frequency shift in the spectrum increases until at w0=2 the IR spectrum peaks at 2565 cm−1 as compared to the bulk water peak at 2509 cm−1. A shift to higher frequency is associated with either a weakening of hydrogen bonds or a decreased electric field along the direction of OD bond. The IR spectrum is primarily sensitive to local interactions. A number of authors have utilized this environmental selectivity to decompose the IR spectrum into contributions from bulk water and interfacial water.17, 27, 45, 46 The most reliable of these use the uncoupled OD stretch of dilute HOD in H2O to avoid complications due to the overlapping symmetric and antisymmetric stretches of H2O.14, 24 The core spectrum (water well removed from the interface) is taken to be that of bulk water and the interfacial spectrum is assumed to be that of the smallest reverse micelle, w0=2. From this, it is clear that interfacial water has a significantly blueshifted IR spectrum as compared to bulk water. Figure 3 shows an example of a two component fit to the spectrum of the w0=10 reverse micelle. The only adjustable parameter in this fit is the relative amount of the two basis spectra, bulk water and w0=2. Based on this analysis, the spectral region at frequencies higher than ∼2570 cm−1 was analyzed as it contains the greatest amount of information about interfacial water.
Figure 2.
Infrared absorption spectra of the OD stretch of dilute HOD in H2O in bulk water and in AOT reverse micelles. The spectrum shifts to higher frequencies as the reverse micelle size decreases.
Figure 3.
Two component fit to the spectrum of the w0=10 reverse micelle. The core spectrum is the spectrum of bulk water and the interfacial spectrum is the spectrum of the w0=2 reverse micelle.
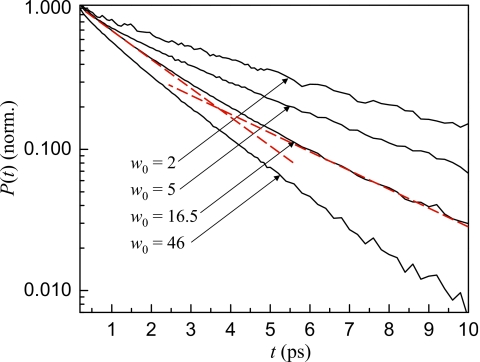
The two environments present in the reverse micelles are also evident in the vibrational population relaxation. As a larger fraction of the water molecules interact with the interface, the vibrational relaxation becomes slower, as shown in the semilog plot of Fig. 4. A semilog plot is used to illustrate that the vibrational relaxation is not single exponential as shown by the deviations from the dashed straight lines plotted along with the w0=16.5 curve. All the decays can be described quite well as biexponentials, indicating that HOD molecules experience at least two distinct environments. This result is consistent with the decomposition of the IR spectra given above. All vibrational relaxation decays presented in this report have been corrected for a small, well documented thermal offset.47, 48
Figure 4.
Semilog plot of the vibrational population relaxation of the OD stretch at 2548 cm−1 for a range of reverse micelle sizes. As the reverse micelle size decreases, the vibrational relaxation becomes slower. All decays are biexponential, as shown by the deviation from the straight dashed lines for the w0=16.5 data.
To extract information about the dynamics of interfacial water in the large reverse micelles, the vibrational population relaxation and anisotropy decays were simultaneously fit for a range of wavelengths at OD stretching frequencies higher than 2570 cm−1. When more than one ensemble contributes to the population relaxation at a particular frequency, the combined signal is the weighted sum of the two population relaxation decays,
| (5) |
where P(t) is the population relaxation and a is the fraction of the signal due to interfacial water. The anisotropy decay has a more complicated dependence on the population relaxation and orientational correlation function when more than one component contributes to the signal,
| (6) |
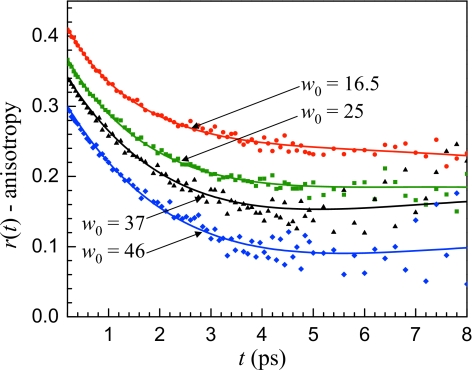
In Eqs. 5, 6, the vibrational population relaxation time (Tcore=1.8 ps) and orientational correlation time (τcore=2.6 ps) of bulk water were used for Pcore(t) and . Simultaneous fitting of the population relaxation and anisotropy decays at multiple wavelengths for each reverse micelle yield a characteristic vibrational lifetime Tint=4.3±0.2 ps and an orientational correlation time τint=18±2 ps for interfacial water.27 The success of the two component model in reproducing the anisotropy decays of the large reverse micelles is shown in Fig. 5 at a single frequency for w0=16.5, 25, 37, and 46. The curves in Fig. 5 have been offset from one another by 0.04 for clarity. An important characteristic of the data that is captured by the model is the apparent plateau that occurs at ∼4 ps and the small upturn in the anisotropy decay at later times. This behavior is a result of the functional form of Eq. 6 and a detailed discussion of the various factors that affect the shape of the anisotropy decay curves when multiple components are present has been given previously.27
Figure 5.
Anisotropy decays at 2578 cm−1 for the large reverse micelles. The solid lines are the results of simultaneous fits of the vibrational population relaxation and anisotropy decays for a range of frequencies for each reverse micelle based on a two component model consisting of a bulk water core and interfacial water.
All of the reverse micelles shown in Fig. 5 have a significant fraction of water that does not interact directly with the interface. Based on geometric considerations, only ∼8% of the water is in contact with the interface in the w0=46 reverse micelle and ∼25% in w0=16.5. With more than 75% of the water away from the interface it is reasonable to assume that some of the water has bulklike properties and this assumption is confirmed by the success of the fitting and the fact that the interfacial water behaves in the same manner for all the large reverse micelles. Within experimental error, the only quantity that varies in the fits in Fig. 5 is a, the fraction of the signal due to interfacial water.
Dynamics of water in small reverse micelles: Effects of confinement
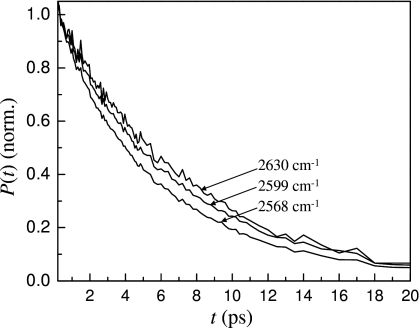
While it is reasonable to assume that bulklike water exists in reverse micelles with w0≥16.5, it is equally reasonable to assume that no bulk water exists at the other extreme, the smallest reverse micelle. In the w0=2 reverse micelle, there are only two water molecules per AOT molecule. Using differential scanning calorimetry, NMR and electron spin resonance (ESR), Hauser et al.49 suggest that between four and six water molecules are required to hydrate the sulfonate head group of AOT. Therefore, it is safe to assume that all of the water in w0=2 is interacting with the interface. In addition, Faeder and Ladanyi15 performed MD simulations which showed that in the smallest reverse micelles, the interfacial region is a structured arrangement of sodium counterions, water molecules, and sulfonate head groups that only break up with increased hydration. Although there may not be a bulk waterlike core, HOD molecules in small reverse micelles have their ODs experiencing a variety of environments. Figure 6 shows the vibrational relaxation at various OD stretching frequencies in the w0=2 reverse micelle. It is clear from the frequency dependence of the vibrational lifetime that even for w0=2, water experiences variations in its environment.
Figure 6.
Vibrational population relaxation of the OD stretch at several frequencies for the w0=2 reverse micelle. There is a frequency dependence to the vibrational lifetime demonstrating that the HOD molecules experience slightly different environments in spite of the fact that nearly all of them are interacting directly with the interface.
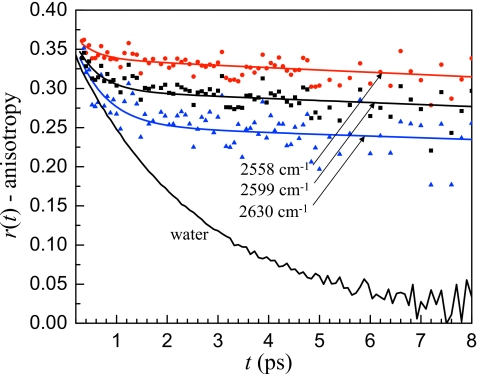
While small variations in the local environment of a water molecule may affect the vibrational lifetime, the long time orientational dynamics are related to the complete structural rearrangement of the hydrogen bonding network due to hydrogen bond switching events. Anisotropy decays at three frequencies in the w0=2 reverse micelle are shown in Fig. 7 with the anisotropy decay of bulk water for comparison. After a fast initial decay, the anisotropy decay in the reverse micelle has a very slow long time decay. The long time decays at the three wavelengths are identical within experimental error. This behavior is consistent with the extremely low water content, only ∼50 water molecules per reverse micelle for w0=2. Essentially, hydrogen bond rearrangement is dramatically slowed because of the energetic penalty required to disrupt the structure of sulfonate groups, water molecules, and sodium ions at the interface.
Figure 7.
Anisotropy decays for bulk water and three frequencies for the w0=2 reverse micelle. After an initial fast decay that has a frequency dependent amplitude, the long time anisotropy decay in the w0=2 reverse micelle is frequency independent, demonstrating that the long time orientational dynamics of all the water in the w0=2 reverse micelle are the same.
The long time orientational dynamics are independent of frequency because hydrogen bond switching is a concerted process that depends on new hydrogen bond acceptors moving into the first solvation shell of the reorienting water, not the strength of a particular hydrogen bond.37, 38 In a w0=2 reverse micelle the hydrogen bonding network is completely coupled because so few water molecules are present and the long time orientational dynamics are well described by a single ensemble. The long time anisotropy decays for all frequencies in the w0=2 reverse micelle can be fit with the same time constant of 110±40 ps. The large error bars indicate the uncertainty in determining such a long time constant from a limited time range (12 ps) of data. It is interesting to note that the reorientation of water in the w0=2 reverse micelle is still an order of magnitude faster than the tumbling time of the reverse micelle itself,50 indicating that water is still able to reorient albeit slowly.
Although the long time component of the orientational relaxation is independent of frequency, the fast time scale decay is dependent on the OD stretching frequency. The fast anisotropy decay is not due to a fraction of the sample completely reorienting on a time scale faster than bulk water. Rather it is caused by local orientational motions of water molecules within a stable hydrogen bonding configuration. This type of restricted, incomplete orientational relaxation is referred to as wobbling in a cone.28 Hydrogen bond strength is often correlated with the stretching frequency of the OH or OD bond with weaker hydrogen bonds leading to higher OD stretching frequencies. Weaker hydrogen bonds will result in a sampling of a wider range of angles, that is, a larger cone angle. The trend in the amplitude of the fast wobbling motion observed in the w0=2 reverse micelle is in line with previous experimental51 and MD simulation52 results for bulk water that showed greater inertial orientational motion for molecules with higher OD or OH stretching frequencies. The explanation for this trend is that when hydrogen bonding interactions are weaker, the angular energy landscape restricting the orientation of the OD or OH to point toward its hydrogen bond acceptor is flatter, allowing a greater angular deviation. In bulk water, the hydrogen bond switching rate is fast enough that after the fast inertial reorientation that causes a drop in the anisotropy during the first ∼200 fs, no additional fast reorientation is resolvable. However, in the w0=2 reverse micelle, the separation of time scales is so great that the wobbling is evident. This wobbling in a cone becomes especially important for describing the dynamics when there is a large separation of time scales between the wobbling and complete hydrogen bond rearrangement that results in orientational randomization. At higher OD stretching frequencies, the hydrogen bonding interactions are weaker and the water molecules are able to reorient more freely within an intact hydrogen bond, leading to the larger amplitude drop in the anisotropy seen in Fig. 7 in going from 2558 to 2630 cm−1.
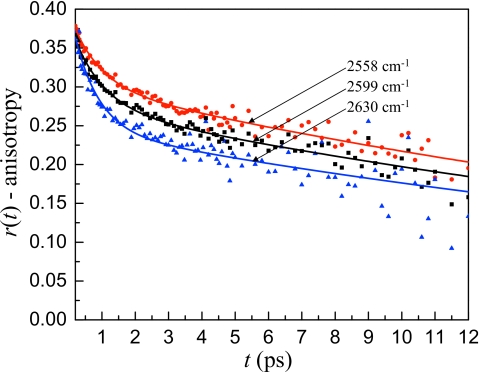
Increasing the reverse micelle size to w0=5 results in an interesting change in the anisotropy decay. While the sulfonate head groups are still not completely hydrated, the long time anisotropy decay in the w0=5 reverse micelle is considerably faster than it was for w0=2. The anisotropy decays at three frequencies for the w0=5 reverse micelle are shown in Fig. 8. Similar to the w0=2 data, there is a fast frequency dependent decay during the first ∼2 ps followed by a much slower decay. The long time decay is frequency independent over a range of ∼70 cm−1. The lack of a frequency dependence demonstrates that the hydrogen bonding network in w0=5 is strongly coupled so that the dynamics of water cannot be separated into a bulklike core and an interfacial shell just as in w0=2. In the w0=5 sample the long time decay has a time constant of 30±3 ps, over three times faster than w0=2. Clearly, the interface is beginning to lose some of its rigidity. However, with so little water present in the system, the collective nature of hydrogen bond reorganization leads to a single long time scale orientational relaxation time.
Figure 8.
Anisotropy decays at three frequencies for the w0=5 reverse micelle. After an initial fast decay that has a frequency dependent amplitude, the long time anisotropy decay in the w0=5 reverse micelle is frequency independent, demonstrating that the long time orientational dynamics of all water in the w0=5 reverse micelle are the same.
MD simulations have suggested a greater variation in the dynamics of water in small reverse micelles although the water away from the interface never reaches bulk characteristics.15 The data presented here show that the dynamics are homogeneous over 70 cm−1 at frequencies higher than 2558 cm−1. This lack of a frequency dependence is in contrast to the large reverse micelles (w0≥16.5) discussed above, which display two component behavior with the components’ amplitudes changing over the same wavelength range.27 The data analysis is complicated at lower frequencies by the overlap of the positive going 0→1 and negative going 1→2 transitions in the pump-probe experiments. While it is possible that the dynamics of the confined water are somewhat different at lower OD stretching frequencies the data indicate that a bulklike core does not exist in the w0=5 reverse micelle. This will be discussed in more detail in Sec. 3C in comparison with the w0=10 reverse micelle.
The transition between two ensemble dynamics and collective dynamics
Between the large reverse micelles w0≥16.5 and the small reverse micelles w0≤5 lies a transitional region centered at about w0=10. The w0=10 reverse micelle is reasonably large based on geometric considerations, 64% of its water molecules are not directly interacting with the interface, and there is a clear variation in the local environment as evidenced by the substantial variation in the population relaxation with wavelength. However water reorientation depends on the concerted motions of many water molecules. Although the sulfonate groups in the w0=10 are fully hydrated, the question is whether there are enough water molecules to form a bulklike core.
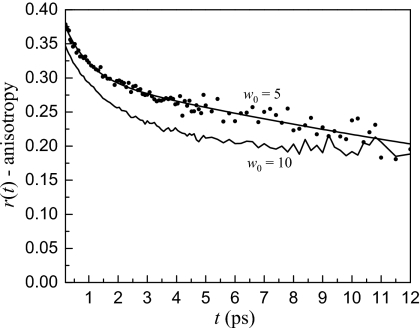
To address this question we approach the w0=10 data from both sides to determine the best way to explain the data. Figure 9 shows a comparison of the anisotropy decay of the w0=5 and w0=10 reverse micelles at 2558 cm−1. While the w0=10 has a larger amplitude initial decay, it appears to plateau at longer times while the w0=5 continues to decay. There is no reason why the larger reverse micelle with a smaller fraction of water in contact with the interface should have slower long time reorientation. The explanation is that there is more than one rotational ensemble present in the w0=10 reverse micelle with distinct vibrational lifetimes and orientational correlation times. The w0=10 results also show that while the w0=5 may have some variation in the water dynamics, a clear separation of time scales does not exist as it does in the w0=10 and larger reverse micelles.
Figure 9.
Anisotropy decay at 2558 cm−1 for the w0=5 and w0=10 reverse micelles. The w0=10 has a fast decay to a plateau similar to the larger reverse micelles (see Fig. 5) while the w0=5 has a fast decay that leads into a slower long time decay. This indicates that the dynamics of water in the w0=10 reverse micelle are not collective like the w0=5 dynamics but may be described using a two component model like the larger reverse micelles.
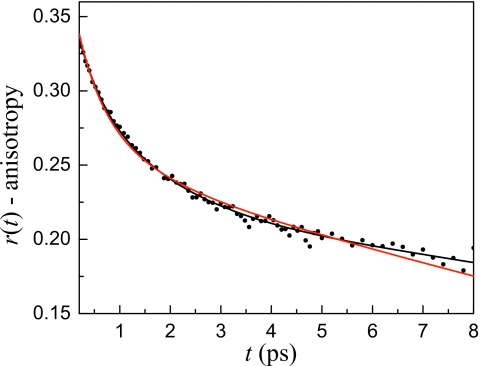
The plateau behavior at longer times in the w0=10 is similar to that observed for w0≥16.5 (see Fig. 5). Therefore, a reasonable starting place to fit the w0=10 data is to use the model that accurately describes water dynamics in the larger reverse micelles, that is, assume the w0=10 water pool consists of a bulklike core and interfacial water that has the same characteristics as interfacial water in the larger reverse micelles. Figure 10 displays the w0=10 anisotropy data and fits. The red curve is the result of simultaneously fitting the w0=10 anisotropy and lifetime data to a two component model with all time constants fixed. The core lifetime and orientational time were fixed at the values for bulk water, Tcore=1.8 and τcore=2.6 ps, respectively, and the interfacial lifetime and orientational time were fixed at the values determined for the large reverse micelles, Tint=4.3 and τint=18 ps, respectively. The only adjustable parameter was the fraction of the signal due to interfacial water a. It is clear that the fit does not completely capture the shape of the anisotropy decay using these time constants and the fit to the vibrational population decays (not shown) was also imperfect.
Figure 10.
Anisotropy decay at 2599 cm−1 for the w0=10 reverse micelle. The red solid line is the result of a simultaneous fit of the anisotropy and lifetime decays for a range of frequencies assuming the same time constants as the large reverse micelles. The fit misses the data at both short and long times. The black solid line is the result of a simultaneous fit of the anisotropy and lifetime decays for a range of frequencies allowing the lifetimes and orientational times to vary but restricting them to be slower than bulk water and the interfacial water found in the large reverse micelles.
If the dynamics in the w0=10 reverse micelle are neither collective nor separable into the same two components as the large reverse micelles, the next logical step is to assume that the confined water is intermediate between the completely coupled situation in the small reverse micelles and the strict two component model for the large reverse micelles. This means that the slowing of the interfacial water also influences the water dynamics away from the interface, but in contrast to the very small reverse micelles, the dynamics of all of the water molecules do not behave as a single ensemble. In addition, the vibrational lifetime of the water away from the interface may not be the same as bulk water due to perturbations in the hydrogen bonding network. The vibrational lifetime and orientational correlation time of both the core and interfacial water were allowed to vary but were restricted to be longer than the bulk water and large reverse micelle interfacial values, respectively. Clearly there are a lot of adjustable parameters. However, the lifetimes are fit independently from the orientational relaxation times, and the requirement that a range of wavelengths must fit with the same parameters except for the fraction of interfacial water gives us some confidence in the results. The black line in Fig. 10 is the result for one wavelength of a two component fit to the w0=10 anisotropy decays and vibrational population relaxation for a range of frequencies. The resulting fit is quite good yielding a core vibrational lifetime of Tcore=2.2 ps, a core orientational correlation time of τcore=4.0 ps, an interfacial vibrational lifetime of Tint=5.3 ps, and an interfacial orientational correlation time of τint=26 ps. Clearly, the water dynamics are slower in both regions but there are still two distinct types of water molecules in the w0=10 reverse micelle.
There are two important factors that are most likely to contribute to the transition from two component dynamics to collective dynamics. The first is related to the mechanism of water reorientation. Laage and Hynes37, 38 showed that water reorientation occurs through a transition state that involves a bifurcated hydrogen bond that the rotating water molecule forms between the old and new hydrogen bond acceptors. The new acceptor is originally in the second hydration shell of the rotating water molecule but through concerted motions it moves into the first hydration shell, creating an overcoordinated environment for the rotating water molecule and reducing the energetic barrier for reorientation. This model shows that water reorientation is not a localized process; the reorientation of a single water molecule requires concerted rearrangement of both its first and second hydration shells involving ∼16 water molecules.53 If one or more of these 16 water molecules is itself in an environment that is not the same as bulk water, causing it to have dynamics distinct from bulk, it will affect the dynamics of its neighbors. When there are many unperturbed water molecules, such as in large reverse micelles, the effect of the perturbation dies off relatively quickly. However, in small reverse micelles so many of the water molecules are perturbed that even water molecules not directly interacting with the interface have slower dynamics.
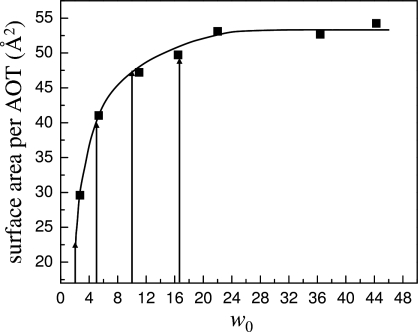
The second important factor is the changing structure of the reverse micelle interface as the reverse micelle size decreases. In large reverse micelles, the curvature of the interface is relatively gentle, presenting a nearly planar surface to the water pool. Changes in the nature of the interface are relatively gradual between w0=46 and 16.5, but below w0=16.5 important structural changes occur in the interface that contribute to the transition from two component to collective dynamics. Both MD simulations15 and IR spectroscopy of the head group moieties of AOT54, 55, 56 show that there is increased association between the sulfonate head groups and sodium counterions at lower hydration levels. This leads to a rigid structure of ionic interactions with water molecules trapped between sodium ions and sulfonate head groups. At w0=10 there is a small amount of ion pairing but the effects become increasingly important below w0=6.54 In addition, the surface area per AOT decreases dramatically below w0=10. Figure 11 is a reproduction of the data from Ref. 3. The solid line is a guide to the eye. The arrows point to the surface area per AOT for some of the reverse micelles studied here, w0=2, 5, 10, and 16.5. Very small reverse micelles have low surface area per AOT and significant surface curvature so that water molecules may interact with multiple sulfonate groups simultaneously, increasing the degree of perturbation. From Fig. 11 it is clear that this change in surface area occurs fairly rapidly as the reverse micelle size increases, and by w0=16.5 it has almost reached its limiting value. The similarity in the surface area per head group may be the explanation for all the reverse micelles with w0≥16.5 having the same interfacial dynamics. Essentially the nature of the interface is independent of reverse micelle size for the large reverse micelles.
Figure 11.
Surface area per AOT reproduced from Ref. 3. The surface area increases rapidly up to w0≈10. The change in area shows that dramatic changes occur in the reverse micelle interface with size for small reverse micelles. The surface area per AOT is essentially constant above w0≈16.5, showing the similarity of the interface for all of the large reverse micelles.
CONCLUDING REMARKS
The dynamics of water confined in reverse micelles ranging from very small (radius<1 nm) to quite large (radius∼10 nm) were investigated with ultrafast IR polarization selective pump-probe spectroscopy. In large reverse micelles, the dynamics of water are separable into a bulk waterlike core and an interfacial shell. The core, which is well separated from the interface, has orientational relaxation and population relaxation of the OD hydroxyl stretch that are indistinguishable from bulk water. The dynamics of water molecules at the interface are independent of the reverse micelle size for w0≥16.5. As the reverse micelle size decreases, structural changes in the interface lead to a decrease in surface area per AOT head group and increased association between the sodium counterion and the sulfonate head group. In the smallest reverse micelles, w0=2 and w0=5, nearly all the water is directly interacting with the interface. The dynamics cannot be separated into multiple components because water reorientation is a collective process involving both the first and second hydration shells of the reorienting water molecule. The orientational relaxation is essentially the same for all water molecules in the very small water nanopools. At intermediate reverse micelle sizes, w0=10, the dynamics are separable into two components. However, the size of the water nanopool is so small that the perturbation caused by the interface does not die out sufficiently rapidly to produce a bulklike core. The core dynamics are slower than bulk water, unlike the larger reverse micelles. This study shows that the effect of an interface is relatively short range, but the collective nature of water reorientation begins to play an important role when the number of confined water molecules is small.
ACKNOWLEDGMENTS
This work was supported by the Department of Energy (Grant No. DE-FG03-84ER13251), the National Institutes of Health (Grant No. 2-R01-GM061137-09), and the National Science Foundation (Grant No. DMR 0652232). D.E.M. thanks the National Science Foundation for a Graduate Research Fellowship and E.E.F. thanks Stanford for a Stanford Graduate Fellowship.
References
- Zulauf M. and Eicke H. -F., J. Phys. Chem. 83, 480 (1979). 10.1021/j100467a011 [DOI] [Google Scholar]
- Kinugasa T., Kondo A., Nishimura S., Miyauchi Y., Nishii Y., Watanabe K., and Takeuchi H., Colloids Surf., A 204, 193 (2002). 10.1016/S0927-7757(01)01132-3 [DOI] [Google Scholar]
- Eicke H. -F. and Rehak J., Helv. Chim. Acta 59, 2883 (1976). 10.1002/hlca.19760590825 [DOI] [Google Scholar]
- Grigolini P. and Maestro M., Chem. Phys. Lett. 127, 248 (1986). 10.1016/0009-2614(86)80267-6 [DOI] [Google Scholar]
- Quist P. -O. and Halle B., J. Chem. Soc., Faraday Trans. 1 84, 1033 (1988). 10.1039/f19888401033 [DOI] [Google Scholar]
- Pant D., Riter R. E., and Levinger N. E., J. Chem. Phys. 109, 9995 (1998). 10.1063/1.477666 [DOI] [Google Scholar]
- Riter R. E., Willard D. M., and Levinger N. E., J. Phys. Chem. B 102, 2705 (1998). 10.1021/jp973330n [DOI] [Google Scholar]
- Douhal A., Angulo G., Gil M., Organero J. A., Sanz M., and Tormo L., J. Phys. Chem. B 111, 5487 (2007). 10.1021/jp068764+ [DOI] [PubMed] [Google Scholar]
- Ueda M. and Schelly Z. A., Langmuir 5, 1005 (1989). 10.1021/la00088a021 [DOI] [Google Scholar]
- Zinsli P. E., J. Phys. Chem. 83, 3223 (1979). 10.1021/j100488a008 [DOI] [Google Scholar]
- Bhattacharyya K., Acc. Chem. Res. 36, 95 (2003). 10.1021/ar020067m [DOI] [PubMed] [Google Scholar]
- Harpham M. R., Ladanyi B. M., Levinger N. E., and Herwig K. W., J. Chem. Phys. 121, 7855 (2004). 10.1063/1.1792592 [DOI] [PubMed] [Google Scholar]
- Nandi N., Bhattacharyya K., and Bagchi B., Chem. Rev. (Washington, D.C.) 100, 2013 (2000). 10.1021/cr980127v [DOI] [PubMed] [Google Scholar]
- Abel S., Sterpone F., Bandyopadhyay S., and Marchi M., J. Phys. Chem. B 108, 19458 (2004). 10.1021/jp047138e [DOI] [Google Scholar]
- Faeder J. and Ladanyi B. M., J. Phys. Chem. B 104, 1033 (2000). 10.1021/jp993076u [DOI] [Google Scholar]
- Moilanen D. E., Levinger N., Spry D. B., and Fayer M. D., J. Am. Chem. Soc. 129, 14311 (2007). 10.1021/ja073977d [DOI] [PMC free article] [PubMed] [Google Scholar]
- Piletic I., Moilanen D. E., Spry D. B., Levinger N. E., and Fayer M. D., J. Phys. Chem. A 110, 4985 (2006). 10.1021/jp061065c [DOI] [PubMed] [Google Scholar]
- Piletic I., Tan H. -S., Moilanen D. E., Spry D. B., and Fayer M. D., in Femtochemistry Vii: Fundamental Ultrafast Processes in Chemistry, Physics, and Biology, edited by Castleman A. W. and Kimble M. L. (Elsevier, New York, 2006), pp. 195–203. [Google Scholar]
- Piletic I. R., Tan H. -S., and Fayer M. D., J. Phys. Chem. B 109, 21273 (2005). 10.1021/jp051837p [DOI] [PubMed] [Google Scholar]
- Tan H. -S., Piletic I. R., and Fayer M. D., J. Chem. Phys. 122, 174501 (2005). 10.1063/1.1883605 [DOI] [PubMed] [Google Scholar]
- Tan H. -S., Piletic I. R., Riter R. E., Levinger N. E., and Fayer M. D., Phys. Rev. Lett. 94, 057405 (2005). 10.1103/PhysRevLett.94.057405 [DOI] [PubMed] [Google Scholar]
- Tan H. -S., Piletic I. R., Riter R. E., Levinger N. E., and Fayer M. D., Phys. Rev. Lett. 94, 057404 (2004). [DOI] [PubMed] [Google Scholar]
- Dokter A. M., Woutersen S., and Bakker H. J., Phys. Rev. Lett. 94, 178301 (2005). 10.1103/PhysRevLett.94.178301 [DOI] [PubMed] [Google Scholar]
- Dokter A. M., Woutersen S., and Bakker H. J., Proc. Natl. Acad. Sci. U.S.A. 103, 15355 (2006). 10.1073/pnas.0603239103 [DOI] [PMC free article] [PubMed] [Google Scholar]
- Cringus D., Bakulin A., Lindner J., Vohringer P., Pshenichnikov M. S., and Wiersma D. A., J. Phys. Chem. B 111, 14193 (2007). 10.1021/jp0723158 [DOI] [PubMed] [Google Scholar]
- Cringus D., Lindner J., Milder M. T. W., Pshenichnikov M. S., Vohringer P., and Wiersma D. A., Chem. Phys. Lett. 408, 162 (2005). 10.1016/j.cplett.2005.04.020 [DOI] [Google Scholar]
- Moilanen D. E., Fenn E. E., Wong D., and Fayer M. D., J. Phys. Chem. B 113, 8560 (2009). 10.1021/jp902004r [DOI] [PMC free article] [PubMed] [Google Scholar]
- Lipari G. and Szabo A., J. Am. Chem. Soc. 104, 4546 (1982). 10.1021/ja00381a009 [DOI] [Google Scholar]
- Moilanen D. E., Fenn E. E., Wong D., and Fayer M. D., J. Am. Chem. Soc. 131, 8318 (2009). 10.1021/ja901950b [DOI] [PubMed] [Google Scholar]
- Halle B., Philos. Trans. R. Soc. London, Ser. B 359, 1207 (2004). 10.1098/rstb.2004.1499 [DOI] [PMC free article] [PubMed] [Google Scholar]
- Halle B. and Davidovic M., Proc. Natl. Acad. Sci. U.S.A. 100, 12135 (2003). 10.1073/pnas.2033320100 [DOI] [PMC free article] [PubMed] [Google Scholar]
- Modig K., Liepinsh E., Otting G., and Halle B., J. Am. Chem. Soc. 126, 102 (2004). 10.1021/ja038325d [DOI] [PubMed] [Google Scholar]
- Bagchi B., Chem. Rev. (Washington, D.C.) 105, 3197 (2005). 10.1021/cr020661+ [DOI] [PubMed] [Google Scholar]
- Jana B., Pal S., and Bagchi B., J. Phys. Chem. B 112, 9112 (2008). 10.1021/jp800998w [DOI] [PubMed] [Google Scholar]
- Bhide S. Y. and Berkowitz M. L., J. Chem. Phys. 125, 094713 (2006). 10.1063/1.2337623 [DOI] [PubMed] [Google Scholar]
- Lopez C., Nielsen S. O., Klein M. L., and Moore P. B., J. Phys. Chem. B 108, 6603 (2004). 10.1021/jp037618q [DOI] [Google Scholar]
- Laage D. and Hynes J. T., Science 311, 832 (2006). 10.1126/science.1122154 [DOI] [PubMed] [Google Scholar]
- Laage D. and Hynes J. T., J. Phys. Chem. B 112, 14230 (2008). 10.1021/jp805217u [DOI] [PubMed] [Google Scholar]
- Woutersen S. and Bakker H. J., Nature (London) 402, 507 (1999). 10.1038/990058 [DOI] [Google Scholar]
- Gaffney K. J., Piletic I. R., and Fayer M. D., J. Chem. Phys. 118, 2270 (2003). 10.1063/1.1534580 [DOI] [Google Scholar]
- Asbury J. B., Steinel T., Kwak K., Corcelli S. A., Lawrence C. P., Skinner J. L., and Fayer M. D., J. Chem. Phys. 121, 12431 (2004). 10.1063/1.1818107 [DOI] [PubMed] [Google Scholar]
- Tan H. -S., Piletic I. R., and Fayer M. D., J. Opt. Soc. Am. B 22, 2009 (2005). 10.1364/JOSAB.22.002009 [DOI] [Google Scholar]
- Tokmakoff A., J. Chem. Phys. 105, 1 (1996). 10.1063/1.471856 [DOI] [Google Scholar]
- Smith J. D., Cappa C. D., Wilson K. R., Cohen R. C., Geissler P. L., and Saykally R. J., Proc. Natl. Acad. Sci. U.S.A. 102, 14171 (2005). 10.1073/pnas.0506899102 [DOI] [PMC free article] [PubMed] [Google Scholar]
- Onori G. and Santucci A., J. Phys. Chem. 97, 5430 (1993). 10.1021/j100122a040 [DOI] [Google Scholar]
- Nucci N. V. and Vanderkooi J. M., J. Phys. Chem. B 109, 18301 (2005). 10.1021/jp051068+ [DOI] [PubMed] [Google Scholar]
- Steinel T., Asbury J. B., Zheng J. R., and Fayer M. D., J. Phys. Chem. A 108, 10957 (2004). 10.1021/jp046711r [DOI] [PMC free article] [PubMed] [Google Scholar]
- Bakker H. J., Woutersen S., and Nienhuys H. K., Chem. Phys. 258, 233 (2000). 10.1016/S0301-0104(00)00134-8 [DOI] [Google Scholar]
- Hauser H., Haering G., Pande A., and Luisi P. L., J. Phys. Chem. 93, 7869 (1989). 10.1021/j100360a029 [DOI] [Google Scholar]
- Spry D. B., Goun A., Glusac K., Moilanen D. E., and Fayer M. D., J. Am. Chem. Soc. 129, 8122 (2007). 10.1021/ja071939o [DOI] [PubMed] [Google Scholar]
- Moilanen D. E., Fenn E. E., Lin Y. -S., Skinner J. L., Bagchi B., and Fayer M. D., Proc. Natl. Acad. Sci. U.S.A. 105, 5295 (2008). 10.1073/pnas.0801554105 [DOI] [PMC free article] [PubMed] [Google Scholar]
- Laage D. and Hynes J. T., Chem. Phys. Lett. 433, 80 (2006). 10.1016/j.cplett.2006.11.035 [DOI] [Google Scholar]
- Yan Z., Buldyrev S. V., Kumar P., Giovambattista N., Debenedetti P. G., and Stanley H. E., Phys. Rev. E 76, 051201 (2007). 10.1103/PhysRevE.76.051201 [DOI] [PubMed] [Google Scholar]
- Christopher D. J., Yarwood J., Belton P. S., and Hills B. P., J. Colloid Interface Sci. 152, 465 (1992). 10.1016/0021-9797(92)90047-P [DOI] [Google Scholar]
- Moran P. D., Bowmaker G. A., and Cooney R. P., Langmuir 11, 738 (1995). 10.1021/la00003a012 [DOI] [Google Scholar]
- Moran P. D., Bowmaker G. A., Cooney R. P., Bartlett J. R., and Woolfrey J. L., J. Mater. Chem. 5, 295 (1995). 10.1039/jm9950500295 [DOI] [Google Scholar]


