

Preface
Recent genetics and genomics studies of prostate cancer help clarify the genetic basis of this common but complex disease. Genome-wide studies have detected numerous variants associated with disease as well as common gene fusions and expression ‘signatures’ in prostate tumors. Based on these results, some advocate gene-based individualized screening for prostate cancer, although such testing may only be worthwhile to distinguish disease aggressiveness. Lessons learned here provide strategies for further deciphering the genetic causes of prostate cancer and other diseases.
Introduction
Finding the genetic causes of prostate cancer—one of the most heritable cancers in men—has proved difficult until very recently1. In the past few years, multiple genome wide association studies (GWAS) have detected over a dozen germline single nucleotide polymorphism (SNPs) that are each associated with a modest increase in risk of prostate cancer2-10. In combination these SNPs may result in substantially higher risk among the limited proportion of men who carry large numbers of variants.
In parallel with this wave of GWAS, expression array studies have identified numerous somatic mutations in prostate tumors, including chromosomal rearrangements and recurrent gene fusions. The most common gene fusion in prostate cancer is TMPRSS2-ERG, which has been observed in about half of tumors studied11-13. This finding and other studies have distinguished combinations of gene expression patterns that may predict prostate cancer aggressiveness.
Here we consider how these GWAS and expression array results refine our understanding of prostate cancer genetics and the implications of these findings on screening and treatment for this disease. In addition, we discuss how these results can be further clarified by future research, be translated to clinical practice, and provide general lessons valuable for the study of any phenotype.
The Search for Germline Risk Alleles
In the developed world, prostate cancer is the most common non-skin cancer among men. Widely agreed upon risk factors for prostate cancer include age, ethnicity, and a family history of this disease1. In an attempt to explain the hereditary basis of prostate cancer, extensive candidate gene studies and linkage analyses have been undertaken—albeit with predominantly equivocal results. While focused candidate gene studies have detected many associations with prostate cancer, most of these have been poorly replicated1.
‘Agnostic’ genome-wide approaches such as linkage analyses and GWAS allow one to exhaustively search for prostate cancer loci without having to specify particular candidate genes. Linkage analysis is best suited to studying rare variants with high penetrance. Much of the genetic basis of prostate cancer, however, is believed to arise from multiple common low risk genes. This may explain why linkage analyses of prostate cancer have detected few highly replicated loci14.In contrast, GWAS can provide greater power to detect small to modest effects on disease risk.
GWAS Finally Yield Results
There has been a rapid increase in the number of published GWAS, including multiple prostate cancer studies that identified over a dozen highly replicated independent germline loci for disease2-10. Table 1 lists the SNP – prostate cancer associations with p-values < 5 × 10⁻⁸. where we used this cutpoint to focus on the most compelling results. Note that a number of different p-value cutpoints have been used to assess ‘statistical significance’ in GWAS (e.g., from p < 5 × 10⁻⁷ to p < 1 × 10⁻⁹). That said, one should be careful not to disregard results simply because they fall outside of a p-value cutpoint, as they could still be causal for disease17.
Table 1.
Summary of loci compellingly associated with prostate cancer.
| Locus | Allele Frequency (+) | Association | ||||||
|---|---|---|---|---|---|---|---|---|
| Chr Region | SNP | Allele (- / +) | Controls | Cases | Odds ratio | p value | Nearby Genes / Potential Function | References |
| 2p15 | rs721048 | G/A | 0.19 | 0.21 | 1.15 | 7.7×10⁻⁹ | EHBP1: endocytic trafficking | 8 |
| 3p12 | rs2660753 | C/T | 0.10 | 0.12 | 1.30 | 2.7×10⁻⁸ | Intergenic | 10 |
| 6q25 | rs9364554 | C/T | 0.29 | 0.33 | 1.21 | 5.5×10⁻¹⁰ | SLC22A3: elimination of drugs and toxins. | 10 |
| 7q21 | rs6465657 | T/C | 0.46 | 0.50 | 1.19 | 1.1×10⁻⁹ | LMTK2: endosomal membrane trafficking | 10 |
| 8q24 (region 2) | rs16901979 | C/A | 0.04 | 0.06 | 1.52 | 1.1×10⁻¹² | Intergenic | 3-5,10 |
| 8q24 (region 3) | rs6983267 | T/G | 0.50 | 0.56 | 1.25 | 9.4×10⁻¹³ | Intergenic | 4,5,10 |
| 8q24 (region 1) | rs1447295 | C/A | 0.10 | 0.14 | 1.42 | 6.4×10⁻¹⁸ | Intergenic (oncogene MYC 200kb downstream) | 3-5,10 |
| 10q11 | rs10993994 | C/T | 0.38 | 0.46 | 1.38 | 8.7×10⁻²⁹ | MSMB: tumor suppressor properties | 9,10 |
| 10q26 | rs4962416 | T/C | 0.27 | 0.32 | 1.18 | 2.7×10⁻⁸ | CTBP2: antiapoptotic activity | 9 |
| 11q13 | rs7931342 | T/G | 0.51 | 0.56 | 1.21 | 1.7×10⁻¹² | Intergenic | 9,10 |
| 17q12 | rs4430796 | G/A | 0.49 | 0.55 | 1.22 | 1.4×10⁻¹¹ | HNF1B: suppressor properties, epithelial differentiation | 6,9,10 |
| 17q24 | rs1859962 | T/G | 0.46 | 0.51 | 1.20 | 2.5×10⁻¹⁰ | Intergenic | 6,10 |
| 19q13 | rs2735839 | A/G | 0.83 | 0.87 | 1.37 | 1.5×10⁻¹⁸ | KLK2/KLK3: serine protease impacting PSA concentrations, androgenic | 5,10 |
| Xp11 | rs5945619 | T/C | 0.36 | 0.41 | 1.29 | 1.5×10⁻⁹ | NUDT10, NUDT11: apoptosis, DNA repair, stress response | 8,10 |
Results presented for SNPs exhibiting replication within or across studies and with association p-values < 5×10⁻⁸. Specific SNPs are those most commonly reported; many other SNPs in linkage disequilibrium with these are also associated with prostate cancer. The second allele (+) is associated with an increased risk of prostate cancer. Allele frequencies are for the risk allele (+) and essentially all results presented here are for European populations. Odds ratios correspond to the effect of carrying one additional copy of the risk allele (+). Allele frequencies, odds ratios, and p-values are from all results in the initial study (listed first in ‘references’ column), except p-values for the 7p15 and 10q26 SNPs are from analyses combining aggressive and non-aggressive prostate cancer cases9, and allele frequencies and odds ratios for the 8q24 loci are from a meta-analysis25. Note that The 3p12 SNP (rs2660753) was only marginally associated with prostate cancer in a recent replication study36. There is also a compelling SNP on 7p15 (rs10486567, JAZF1) that is associated with prostate cancer, though with a slightly larger p value (1.2×10⁻⁷)9 and a recently detected second independently associated SNP in HNF1B30.
EHBP1: EH domain binding protein 1; SLC22A3: solute carrier family 22, member 3; LMTK2: lemur tyrosine kinase 2; MSMB: microseminoprotein, beta-; CTBP2: C-terminal binding protein 2; HNF1B: hepatocyte nuclear factor 1 beta, MODY gene; KLK2/KLK3: kallikrein-related peptidase 2/3; NUDT10, NUDT11: nucleoside diphosphate linked moiety X-type motif 10 / 11.
One of the most striking findings is that at least three distinct loci within an approximate 1 Mb segment of chromosome 8q24 harbor germline variants associated with prostate cancer3-5. These variants were detected by a combination of linkage18, admixture19, and association studies3-5, 20-24, with the latter identifying specific risk alleles. A meta-analysis of the 8q24 findings suggests that the SNPs may result in a 25% to 50% increased risk of prostate cancer25. SNPs in the 8q24 region have also been associated with colorectal, breast, ovarian, and bladder cancers26-29. No known genes reside within the 8q24 region, although the oncogene MYC is approximately 200kb downstream. Studies to date, however, suggest that the 8q24 risk alleles do not affect MYC expression,3, 29 and the biological mechanisms underlying the 8q24 associations with cancer remains unclear.
In addition, two distinct prostate cancer loci on chromosome 17 were detected across multiple populations; the corresponding variants each increase risk by approximately 20% and are quite common (minor allele frequencies close to 50%)6, 9, 10, 30. Interestingly, the chromosome 17q12 prostate cancer risk variant (rs4430796, intron 4 of the gene HNF1B) also decreases the risk of type 2 diabetes (T2D) by about 10%6. Moreover, there is an inverse association between T2D and prostate cancer. The HNF1B finding may reflect pleitropic effects of the associated SNP, or a common mechanism underlying both prostate cancer and T2D, such as in a hormonal or metabolic pathway6. At present it is unclear how the associated SNP—or another SNP in linkage disequilibrium with rs4430796—might functionally impact these pathways.
Two loci were also identified on chromosome 10, one of which encompasses a compelling association between a SNP in the proximal promoter of the β-microseminoprotein gene (MSMB, rs10993994) and prostate cancer9, 10. MSMB encodes PSP94 (also known as MSP), a member of the immunoglobulin binding factor family that promotes apoptosis and decreases tumor vascularization31. PSP94 is synthesized by prostate epithelial cells, and is one of the most abundant proteins in the prostate as well as a primary constituent of semen9. The associated MSMB SNP (rs10993994) is just 2 bp upstream of the transcription start site and the risk allele appears to downregulate MSMB expression by approximately 70%.32 This agrees with the finding that decreased MSMB expression may increase prostate cancer development and progression31.
Expression Array Findings for Prostate Cancer
In addition to germline variants detected by GWAS, somatic mutations can be uncovered by expression array analyses of prostate tumors. One of the most exciting results here is that gene fusions are common in tumors11. Briefly, the ‘cancer outlier profile analysis’ (COPA) bioinformatics approach was used to search for genes overexpressed in a subset of prostate tumors; this method found that the 5′ untranslated region of the androgen regulated transmembrane protease serine 2 (TMPRSS2 ) fused to erythroblast transformation specific (Ets) family genes, resulting in androgenic induction of oncogenic transcription factor overexpression11-13.
A number of somatic rearrangements have been observed, the most common being TMPRSS2-ERG (ETS-related gene). ERG is a transcriptional regulator, and in vitro studies suggest that ERG overexpression can result in invasive prostate cancer cells13. TMPRSS2 and ERG are approximately 3 Mb apart on chromosome 21q22, and the fusion is typically between TMPRSS2 exon 1 or 2 and ERG exon 2, 3, 4, or 5; these fusions may be due to either chromosomal translocations or intrachromosomal deletions13.
A recent review 13 shows a remarkable trend in the frequency of TMPRSS2-ERG fusions across different samples: 0/78 for normal tissue samples; 2/84 (2.4%) for benign prostatic hyperplasia samples; 9/45 (20%) for high-grade prostatic intraepithelial neoplasia samples; and 692/1,374 (50%) for clinically localized prostate cancer (i.e., tumors confined to the prostate). Interestingly, the TMPRSS2-ERG fusion may activate the MYC oncogene, which is nearby the 8q24 region containing multiple GWAS SNPs33, and may help improve prediction of disease risk (e.g., beyond prostate specific antigen, PSA)34.
TMPRSS2 also fuses to a number of other Ets family genes in prostate tumors, including ETV1 (ETS variant gene 1), ETV4, and ETV5. Additional upstream genes fuse to these Ets family genes as well (e.g., SLC45A3). The ETV fusions, however, appear to account for less than 10% of all tumor fusions13; for example, the frequency of ETV1 fusions in a recent study was 5.4%35.
Predicting Disease Risk with GWAS SNPs
The small magnitude of effect for each associated GWAS SNP (e.g., most odds ratios < 1.30) suggests that taken together they may only account for about 15% of the familial risk of prostate cancer10, 36. Since the corresponding risk-allele frequencies are fairly high, estimates of population attributable risk are relatively large (e.g., up to 40%). Nonetheless, it is unlikely that the associated SNPs actually account for such a large percentage of prostate cancer in the general population, especially since they explain little of the heritability.
Each SNP is independently associated with prostate cancer—that is they do not interact multiplicatively to increase risk beyond the main effect for the individual SNPs. Nevertheless, combinations of these SNPs lead to appreciably increased risk of disease. When looking at the distribution of multiple associated SNPs among prostate cancer cases and controls, men in the top decile of risk alleles carried have an approximate 2- to 4-fold increase in risk in comparison with men in the lowest decile9, 36, 37.
In light of the increased risk for men who carry multiple risk alleles, some advocate marketing a multiple-SNP screening test for prostate cancer37. The increased relative risk, however, does not mean that such a test can sufficiently distinguish between men with low and high risk of disease. In fact, these markers only provide a slight increase in the area under the receiver operating characteristic curve for classifying cases and controls (0.61 to 0.63)37. A screening test based on the SNPs detected to date will likely have low positive (and negative) predictive value for prostate cancer and have limited usefulness in a diagnostic setting38. Figure 1 illustrates why using such risk SNPs will poorly predict disease. Adding more SNPs with modest disease associations will do little to improve this situation. Moreover, few men carry large numbers of risk variants, so screening for these in the general population would not be cost-effective.
Figure 1.
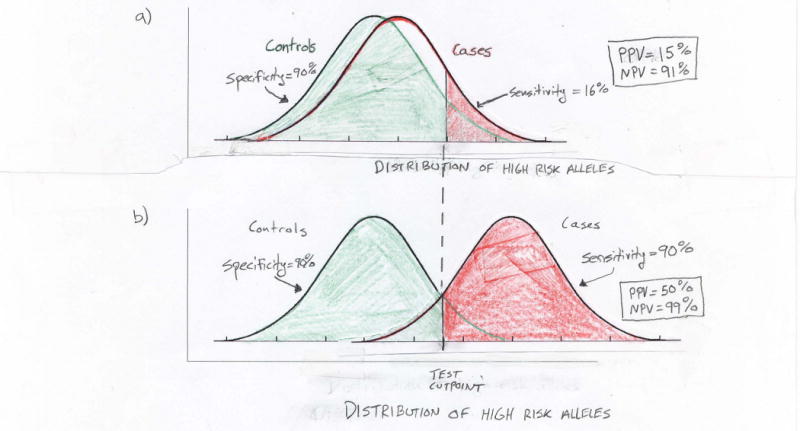
Limitations of using multiple associated variants to predict an individual's risk of prostate cancer. Plots show hypothetical normal distributions of high risk alleles among cases and controls. a) Recent work suggests that men in the 90th percentile of risk allele counts have a two- to four-fold increase in prostate cancer risk in comparison to men in the 10th percentile. Even at the higher bound of this range (i.e., odds ratio equal to four), the case and control distributions of high risk alleles largely overlap. With such overlap a genetic screening test will perform poorly. For example, while a test based on being in the top decile of risk alleles (above cutpoint in figure) has 90% specificity (i.e., proportion of true negatives determined by the test) and negative predictive value (NPV) = 91%, it has only 16% sensitivity (i.e., the proportion of true positives determined by the test) and positive predictive value (PPV) = 15%. Here the cutpoint is based on the control distribution and the disease prevalence is assumed to equal 10%. b) Using this same genetic test to achieve sufficient separation between the case and control distributions of risk alleles for 90% sensitivity and specificity will require odds ratios substantially larger than those anticipated from GWAS, even if many SNPs are combined into a single predictor of prostate cancer.
Another important consideration is what can be offered to men who ‘test positive’ and carry multiple risk SNPs. Simply screening these men more often may further increase the large number of men diagnosed with early stage prostate cancer; these men in turn may have more extensive treatment than necessary if they have relatively latent disease.39 And men in particular high-risk subpopulations (e.g., positive family history of prostate cancer, or of African-American ethnicity) who might benefit most from the genetic test are already recommended for additional screening.
Markers of Prostate Cancer Aggressiveness
In contrast with using genetic markers to screen non-diseased men, there is clear clinical utility in identifying markers that can distinguish which prostate tumors will progress rapidly and be life-threatening versus those that are relatively latent and may not substantively impact a man's health. This is especially important in light of the considerable comorbidity and detrimental effects on quality of life arising from the standard treatment options for prostate cancer (surgery or radiotherapy). While there are a number of existing measures that help determine which men may have more aggressive disease (e.g., tumor stage and grade) there remains room for improvement. Moreover, among men diagnosed with prostate cancer, there is a sufficiently high risk of progression such that markers for prostate cancer aggressiveness could have reasonable predictive value. For example, if 50% of men progress over time, the positive predictive value would be over 60% (assuming the makers result in a four-fold increase in risk of progression).
Some of the germline SNPs detected by GWAS have been associated with intermediate or high risk prostate cancer, although most of these associations were essentially indistinguishable from that observed for less aggressive disease5, 7, 8, 25. Moreover, the multiple-SNP model for prediction of disease risk was not associated with disease aggressiveness37. This suggests that the germline SNPs detected to date by GWAS are not risk factors for more aggressive prostate cancer, but instead may primarily initiate disease (Figure 2). Detecting aggressiveness-associated variants will require large GWAS among affected men that search for associations with disease progression (e.g., disease recurrence following treatment) and/or mortality due to prostate cancer.
Figure 2.
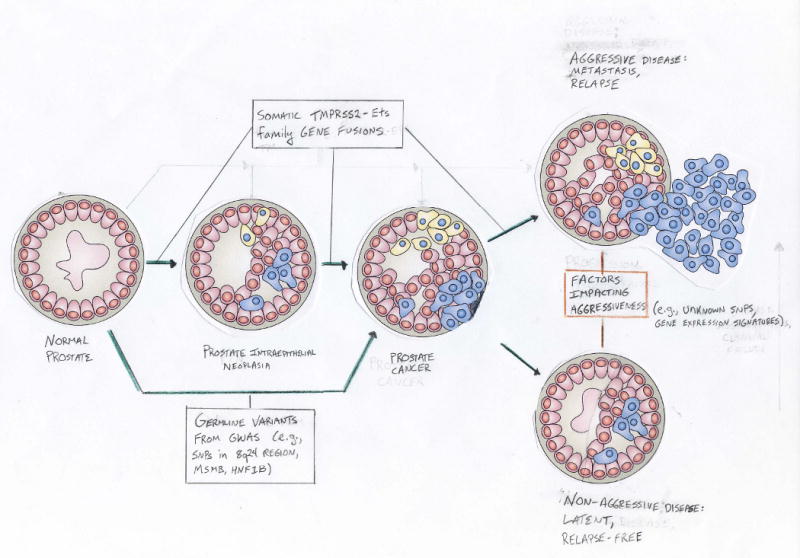
Etiologic evolution of prostate cancer and key steps affected by germline variants and somatic fusions. GWAS undertaken to date have searched for SNPs impacting the progression from normal prostate (controls) to prostate cancer (cases). Numerous highly replicated SNPs for prostate cancer have been detected (e.g., on chromosome 8q24). The potential for these SNPs to differentiate between more and less aggressive disease at diagnosis remains unclear. Somatic TMPRSS2-Ets gene family fusions have been observed at increasing frequency across the different steps in prostate cancer development. The common TMPRSS2-ERG fusion has similar frequencies among localized and metastatic tumors, although the latter primarily exhibit interstitial deletions. This fusion has been incorporated into gene expression ‘signatures’ of prostate cancer aggressiveness. Additional studies are needed to more fully distinguish which germline and somatic factors impact the progression of prostate cancer once diagnosed; such information could help determine the most appropriate treatment among diseased men.
With regard to somatic mutations, numerous studies have found that the TMPRSS2-ERG fusion is correlated with more aggressive disease and worse prognosis13. While the frequency of TMPRSS2-ERG fusions decreases slightly for metastatic tumors (23/70, 33%), this may simply reflect the small number of tumors reported on to date.13 More recent work suggests that the frequency of fusions are similar in clinically localized and metastatic tumors, but certain sub-types of fusion may be more prevalent in advanced disease40. In fact, Kumar-Sinha et al.13 found that all metastatic tumors with TMPRSS2-ERG fusions were due to an interstitial deletion.
Extensive studies of genes over- and under-expressed in prostate tumors have recently identified ‘molecular signatures’ for aggressiveness—some of which include the TMPRSS2-ERG fusion41-43. Such signatures may contain different sets of genes; while this may seem counterintuitive, the finding parallels the situation for breast cancer where different expression array based signatures are highly predictive of prognosis44. Ultimately, these gene fusion results and expression array signatures may also help distinguish which prostate tumors are more or less likely to progress rapidly, providing valuable information to help guide treatment decisions.
Next steps in prostate cancer genomics
While the recent GWAS and expression array studies have made successful steps toward deciphering the genomic basis of prostate cancer, more work is needed to fully understand and apply these findings. Identifying the biological mechanisms underlying the apparent risk variants is essential to advancing our understanding of prostate carcinogenesis. While some of the variants have compelling mechanisms, the role of many others remains unclear. In fact, these latter variants may simply be markers for the actual causal factors. The large number of replicated SNPs from GWAS is impressive, but many more SNPs will undoubtedly be detected as sample sizes increase and additional populations are studied. To date almost all of the genome-wide studies have been undertaken among European Americans. Further studies of minority groups— especially among African-Americans—are critical for deciphering whether the same or different germline SNPs or somatic mutations are important for prostate cancer development and progression among this high risk population. For example, the 8q24 region appears to harbor some risk variants with different locations and effect sizes (ORs) among African-American men4. Plans are currently underway for GWAS of prostate cancer among African-Americans in the Multiethnic Cohort and Kaiser Permanente Northern California populations.
The current GWAS and expression array studies have been undertaken in relative isolation. This is not surprising since these studies are individually focused on germline and somatic mutations, respectively. Nevertheless, leveraging both of these approaches in a single study would provide a great opportunity for distinguishing the interrelated nature of these sources of variation. For example, expression array results could be used to distinguish tumor sub-types (e.g., those with specific gene fusions), and then GWAS results could be used to evaluate germline risks of such sub-types. Undertaking studies to determine the potential functional role of associated variants and mutations will also be extremely valuable.
Well-designed studies of disease recurrence following treatment and mortality due to prostate cancer are also needed in light of the large phenotypic heterogeneity of this disease. Ideally such studies would evaluate germline SNPs and expression arrays on pre- and post-diagnosis biospecimens, and include both treated and non-treated men (i.e., a watchful waiting arm). Ultimately, SNPs, tumor expression and somatic mutation data could be jointly investigated for their relationship with prognosis and treatment outcomes.
Evaluating such joint data will likely require novel statistical methods and large sample sizes. Moreover, one may speculate that the large number of variants detected by GWAS and expression array studies might only act within a limited number of pathways. While many of the GWAS results to date for prostate cancer are in genes with suppressor properties, they do not point to particular pathway (Table 1). Nevertheless, ultimately determining such pathways in prostate cancer may provide an avenue for classifying and treating tumors, especially with regard to disease aggressiveness, and distinguishing which mutations are drivers versus passengers in the process of prostate carcinogenesis. Ancillary support for this possibility comes from the recent findings that pancreatic and brain tumors contain hundreds of somatic mutations, but many of these were in specific pathways (e.g., cell signaling)45, 46.
Lessons Learned
The prostate cancer GWAS and expression array findings result in some general lessons worth considering regardless of the phenotype one is studying. First, they underscore the value of ‘agnostic’ approaches to searching for disease genes. Few of the new findings would have been obtained with focused studies. In a similar vein, these studies also emphasize the importance of undertaking complementary replication and validation studies across multiple populations.
Another valuable lesson is that the initial-stages of GWAS may not necessarily pinpoint SNPs that end up being highly replicated by later stages. For example, the strongly associated SNP in MSMB (rs10993994) had only the 24,223rd smallest p-value in the Cancer Genetic Markers of Susceptibility (CGEMS) study's initial GWAS of prostate cancer9. This illustrates the importance of large sample sizes, including as many SNPs as feasible in follow-up studies, and of conducting additional GWAS in diverse populations with well characterized phenotypes. Moreover, the ranking of SNPs for follow-up should explicitly incorporate additional information beyond conventional p-values (e.g., SNP functionality, conservation)47.
Data and full results from studies should be made available for others to rapidly evaluate, replicate, and combine findings. The CGEMS study has made its results publicly available (http://cgems.cancer.gov), and the data from publicly funded GWAS should be made available to qualified investigators. Researchers should be also applauded for rapidly publishing all of their results together10, as this allows others to not only replicate findings, but also examine phenotypic clustering with particular genetic variants, such as observed for prostate cancer and diabetes6.
The value of genetic screening here hinges on both the predictive value of a test and whether a positive result leads to a worthwhile intervention. Developing a test that can adequately distinguish who is at high versus low risk of a phenotype based on genome-wide results appears challenging. The most promising situation may arise for common phenotypes when the predictive value of a test is sufficiently high. And of course without an advisable intervention there is little justification for genetic testing in the first place.
Finally, while genome-wide findings should ultimately improve our understanding of the disease process and risks, the resulting estimates of effect may be relatively modest, even for combinations of variants. If so, such findings will explain a limited proportion of disease heritability, regardless of whether the phenotype of interest has high heritability. Nevertheless, this situation may simply reflect the complex multifactoral nature of common diseases such as prostate cancer.
Acknowledgments
Thanks to Eric Jorgenson, Iona Cheng, the referees and editors for helpful comments on this article. This work was supported by National Institutes of Health grants CA88164 and CA127298.
Glossary Terms
- Genome wide association studies (GWAS)
Investigation of the association between common genetic variation and disease. Require a dense set of markers (e.g., SNPs) that capture a substantial proportion of common variation across the genome and large numbers of ‘affected’ cases and ‘unaffected’ controls
- Expression array studies
Examination of the expression of all known genes; Commonly used to determine profiles or ‘signatures’ of over- and under-expressed genes in diseased versus normal samples.
- Linkage analyses
Method for localizing chromosomal regions that harbor causal variants by studying the co-segregation of genetic makers and disease within families. When a marker is commonly observed with the disease, the causal variant may be in the general proximity of the marker
- Admixture studies
Approach to localizing genetic regions that may contain causal variants by correlating the level of individuals' admixture with disease. Requires fewer markers than association studies, but necessitates a recently admixed population and variation in disease rates across ancestral populations
- Cancer outlier profile analysis (COPA)
Method for detecting gene expression pattern outliers within subsets of samples; used to distinguish potential oncogenic chromosomal changes.
- Population attributable risk (PAR)
The disease incidence in a population that is attributable to a particular risk factor. GWAS commonly report the PAR percentage to estimate what proportion of the disease is explained by associated variants
- Area under the receiver operating characteristic (ROC) curve (AUC)
The ROC curve for a predictor (e.g., genetic test) plots the proportion of cases correctly identified by the test versus the proportion of controls incorrectly classified as cases (false positive rate). AUC indicates the probability that a factor (e.g., genotypes) will predict a higher risk of disease in a randomly selected case than a control
- Positive predictive value (PPV)
Measures how well a screening or diagnostic test distinguishes true positives: the probability that an individual who tests positive is truly positive (e.g., affected)
- Negative predictive value (NPV)
The probability that an individual with a negative screening test is truly negative (e.g., unaffected)
About the author
John Witte received his Ph.D. in 1994 from the University of California, Los Angeles, and did a post-doc in Biostatistics at the University of Southern California. From 1995 to 2003 he worked at Case Western Reserve University on genetic epidemiology methods and launched multiple studies of prostate cancer genetics. In 2003 he moved to the University of California, San Francisco, where he is currently Professor of Epidemiology & Biostatistics and Urology, Associate Director of the Institute for Human Genetics, Head of the Division of Cancer Epidemiology, and co-Leader of the Cancer Genetics Program. His laboratory is focused on applied and methodological genetic epidemiology, with the overall aim of deciphering the mechanisms underlying complex diseases such as cancer.
Footnotes
Further information: Cancer Genetic Markers of Susceptibility Study: http://cgems.cancer.gov
Catalogue of Published Genome-Wide Association Studies: http://www.genome.gov/26525384
International HapMap Project: http://www.hapmap.org
Witte lab: http://www.epibiostat.ucsf.edu/witte_lab
References
- 1.Schaid DJ. The complex genetic epidemiology of prostate cancer. Hum Mol Genet. 2004;13(S1):103–21. doi: 10.1093/hmg/ddh072. [DOI] [PubMed] [Google Scholar]
- 2.Witte JS. Multiple prostate cancer risk variants on 8q24. Nat Genet. 2007;39:579–80. doi: 10.1038/ng0507-579. [DOI] [PubMed] [Google Scholar]
- 3.Gudmundsson J, et al. Genome-wide association study identifies a second prostate cancer susceptibility variant at 8q24. Nat Genet. 2007;39:631–7. doi: 10.1038/ng1999. [DOI] [PubMed] [Google Scholar]
- 4.Haiman CA, et al. Multiple regions within 8q24 independently affect risk for prostate cancer. Nat Genet. 2007;39:638–44. doi: 10.1038/ng2015. [DOI] [PMC free article] [PubMed] [Google Scholar]
- 5.Yeager M, et al. Genome-wide association study of prostate cancer identifies a second risk locus at 8q24. Nat Genet. 2007;39:870–4. doi: 10.1038/ng2022. [DOI] [PubMed] [Google Scholar]
- 6.Gudmundsson J, et al. Two variants on chromosome 17 confer prostate cancer risk, and the one in TCF2 protects against type 2 diabetes. Nat Genet. 2007;39:977–83. doi: 10.1038/ng2062. [DOI] [PubMed] [Google Scholar]
- 7.Duggan D, et al. Two genome-wide association studies of aggressive prostate cancer implicate putative prostate tumor suppressor gene DAB2IP. J Natl Cancer Inst. 2007;99:1836–44. doi: 10.1093/jnci/djm250. [DOI] [PubMed] [Google Scholar]
- 8.Gudmundsson J, et al. Common sequence variants on 2p15 and Xp11.22 confer susceptibility to prostate cancer. Nat Genet. 2008;40:281–3. doi: 10.1038/ng.89. [DOI] [PMC free article] [PubMed] [Google Scholar]
- 9.Thomas G, et al. Multiple loci identified in a genome-wide association study of prostate cancer. Nat Genet. 2008;40:310–5. doi: 10.1038/ng.91. [DOI] [PubMed] [Google Scholar]
- 10.Eeles RA, et al. Multiple newly identified loci associated with prostate cancer susceptibility. Nat Genet. 2008;40:316–21. doi: 10.1038/ng.90. [DOI] [PubMed] [Google Scholar]
- 11.Tomlins SA, et al. Recurrent fusion of TMPRSS2 and ETS transcription factor genes in prostate cancer. Science. 2005;310:644–8. doi: 10.1126/science.1117679. [DOI] [PubMed] [Google Scholar]
- 12.Tomlins SA, et al. Distinct classes of chromosomal rearrangements create oncogenic ETS gene fusions in prostate cancer. Nature. 2007;448:595–9. doi: 10.1038/nature06024. [DOI] [PubMed] [Google Scholar]
- 13.Kumar-Sinha C, Tomlins SA, Chinnaiyan AM. Recurrent gene fusions in prostate cancer. Nat Rev Cancer. 2008;8:497–511. doi: 10.1038/nrc2402. [DOI] [PMC free article] [PubMed] [Google Scholar]
- 14.Easton DF, Schaid DJ, Whittemore AS, Isaacs WJ. Where are the prostate cancer genes?--A summary of eight genome wide searches. Prostate. 2003;57:261–9. doi: 10.1002/pros.10300. [DOI] [PubMed] [Google Scholar]
- 15.Risch N, Merikangas K. The future of genetic studies of complex human diseases. Science. 1996;273:1516–7. doi: 10.1126/science.273.5281.1516. [DOI] [PubMed] [Google Scholar]
- 16.Jorgenson E, Witte JS. Genome-wide association studies of cancer. Future Oncol. 2007;3:419–27. doi: 10.2217/14796694.3.4.419. [DOI] [PubMed] [Google Scholar]
- 17.Witte JS, Elston RC, Schork NJ. Genetic dissection of complex traits. Nat Genet. 1996;12:355–6. doi: 10.1038/ng0496-355. [DOI] [PubMed] [Google Scholar]
- 18.Amundadottir LT, et al. A common variant associated with prostate cancer in European and African populations. Nat Genet. 2006;38:652–8. doi: 10.1038/ng1808. [DOI] [PubMed] [Google Scholar]
- 19.Freedman ML, et al. Admixture mapping identifies 8q24 as a prostate cancer risk locus in African-American men. Proc Natl Acad Sci U S A. 2006;103:14068–73. doi: 10.1073/pnas.0605832103. [DOI] [PMC free article] [PubMed] [Google Scholar]
- 20.Severi G, et al. The common variant rs1447295 on chromosome 8q24 and prostate cancer risk: results from an Australian population-based case-control study. Cancer Epidemiol Biomarkers Prev. 2007;16:610–2. doi: 10.1158/1055-9965.EPI-06-0872. [DOI] [PubMed] [Google Scholar]
- 21.Schumacher FR, et al. A common 8q24 variant in prostate and breast cancer from a large nested case-control study. Cancer Res. 2007;67:2951–6. doi: 10.1158/0008-5472.CAN-06-3591. [DOI] [PubMed] [Google Scholar]
- 22.Wang L, et al. Two common chromosome 8q24 variants are associated with increased risk for prostate cancer. Cancer Res. 2007;67:2944–50. doi: 10.1158/0008-5472.CAN-06-3186. [DOI] [PubMed] [Google Scholar]
- 23.Suuriniemi M, et al. Confirmation of a positive association between prostate cancer risk and a locus at chromosome 8q24. Cancer Epidemiol Biomarkers Prev. 2007;16:809–14. doi: 10.1158/1055-9965.EPI-06-1049. [DOI] [PubMed] [Google Scholar]
- 24.Zheng SL, et al. Association between two unlinked loci at 8q24 and prostate cancer risk among European Americans. J Natl Cancer Inst. 2007;99:1525–33. doi: 10.1093/jnci/djm169. [DOI] [PubMed] [Google Scholar]
- 25.Cheng I, et al. 8q24 and prostate cancer: association with advanced disease and meta-analysis. Eur J Hum Genet. 2008;16:496–505. doi: 10.1038/sj.ejhg.5201959. [DOI] [PMC free article] [PubMed] [Google Scholar]
- 26.Haiman CA, et al. A common genetic risk factor for colorectal and prostate cancer. Nat Genet. 2007;39:954–6. doi: 10.1038/ng2098. [DOI] [PMC free article] [PubMed] [Google Scholar]
- 27.Zanke BW, et al. Genome-wide association scan identifies a colorectal cancer susceptibility locus on chromosome 8q24. Nat Genet. 2007;39:989–94. doi: 10.1038/ng2089. [DOI] [PubMed] [Google Scholar]
- 28.Ghoussaini M, et al. Multiple loci with different cancer specificities within the 8q24 gene desert. J Natl Cancer Inst. 2008;100:962–6. doi: 10.1093/jnci/djn190. [DOI] [PMC free article] [PubMed] [Google Scholar]
- 29.Kiemeney LA, et al. Sequence variant on 8q24 confers susceptibility to urinary bladder cancer. Nat Genet. 2008 doi: 10.1038/ng.229. [DOI] [PMC free article] [PubMed] [Google Scholar]
- 30.Sun J, et al. Association between sequence variants at 17q12 and 17q24.3 and prostate cancer risk in European and African Americans. Prostate. 2008;68:691–7. doi: 10.1002/pros.20754. [DOI] [PMC free article] [PubMed] [Google Scholar]
- 31.Beke L, Nuytten M, Van Eynde A, Beullens M, Bollen M. The gene encoding the prostatic tumor suppressor PSP94 is a target for repression by the Polycomb group protein EZH2. Oncogene. 2007;26:4590–5. doi: 10.1038/sj.onc.1210248. [DOI] [PubMed] [Google Scholar]
- 32.Buckland PR, et al. Strong bias in the location of functional promoter polymorphisms. Hum Mutat. 2005;26:214–23. doi: 10.1002/humu.20207. [DOI] [PubMed] [Google Scholar]
- 33.Sun C, et al. TMPRSS2-ERG fusion, a common genomic alteration in prostate cancer activates C-MYC and abrogates prostate epithelial differentiation. Oncogene. 2008;27:5348–53. doi: 10.1038/onc.2008.183. [DOI] [PMC free article] [PubMed] [Google Scholar]
- 34.Laxman B, et al. A first-generation multiplex biomarker analysis of urine for the early detection of prostate cancer. Cancer Res. 2008;68:645–9. doi: 10.1158/0008-5472.CAN-07-3224. [DOI] [PMC free article] [PubMed] [Google Scholar]
- 35.Attard G, et al. Heterogeneity and clinical significance of ETV1 translocations in human prostate cancer. Br J Cancer. 2008;99:314–20. doi: 10.1038/sj.bjc.6604472. [DOI] [PMC free article] [PubMed] [Google Scholar]
- 36.Kote-Jarai Z, et al. Multiple novel prostate cancer predisposition loci confirmed by an international study: the PRACTICAL Consortium. Cancer Epidemiol Biomarkers Prev. 2008;17:2052–61. doi: 10.1158/1055-9965.EPI-08-0317. [DOI] [PMC free article] [PubMed] [Google Scholar]
- 37.Zheng SL, et al. Cumulative association of five genetic variants with prostate cancer. N Engl J Med. 2008;358:910–9. doi: 10.1056/NEJMoa075819. [DOI] [PubMed] [Google Scholar]
- 38.Ware JH. The limitations of risk factors as prognostic tools. N Engl J Med. 2006;355:2615–7. doi: 10.1056/NEJMp068249. [DOI] [PubMed] [Google Scholar]
- 39.Lilja H, Ulmert D, Vickers AJ. Prostate-specific antigen and prostate cancer: prediction, detection and monitoring. Nat Rev Cancer. 2008;8:268–78. doi: 10.1038/nrc2351. [DOI] [PubMed] [Google Scholar]
- 40.Mehra R, et al. Characterization of TMPRSS2-ETS gene aberrations in androgen-independent metastatic prostate cancer. Cancer Res. 2008;68:3584–90. doi: 10.1158/0008-5472.CAN-07-6154. [DOI] [PMC free article] [PubMed] [Google Scholar]
- 41.Setlur SR, et al. Estrogen-dependent signaling in a molecularly distinct subclass of aggressive prostate cancer. J Natl Cancer Inst. 2008;100:815–25. doi: 10.1093/jnci/djn150. [DOI] [PMC free article] [PubMed] [Google Scholar]
- 42.Mucci LA, et al. Testing a multigene signature of prostate cancer death in the Swedish Watchful Waiting Cohort. Cancer Epidemiol Biomarkers Prev. 2008;17:1682–8. doi: 10.1158/1055-9965.EPI-08-0044. [DOI] [PMC free article] [PubMed] [Google Scholar]
- 43.Cheville JC, et al. Gene panel model predictive of outcome in men at high-risk of systemic progression and death from prostate cancer after radical retropubic prostatectomy. J Clin Oncol. 2008;26:3930–6. doi: 10.1200/JCO.2007.15.6752. [DOI] [PMC free article] [PubMed] [Google Scholar]
- 44.Fan C, et al. Concordance among gene-expression-based predictors for breast cancer. N Engl J Med. 2006;355:560–9. doi: 10.1056/NEJMoa052933. [DOI] [PubMed] [Google Scholar]
- 45.Jones S, et al. Core signaling pathways in human pancreatic cancers revealed by global genomic analyses. Science. 2008;321:1801–6. doi: 10.1126/science.1164368. [DOI] [PMC free article] [PubMed] [Google Scholar]
- 46.Parsons DW, et al. An integrated genomic analysis of human glioblastoma multiforme. Science. 2008;321:1807–12. doi: 10.1126/science.1164382. [DOI] [PMC free article] [PubMed] [Google Scholar]
- 47.Chen GK, Witte JS. Enriching the analysis of genomewide association studies with hierarchical modeling. Am J Hum Genet. 2007;81:397–404. doi: 10.1086/519794. [DOI] [PMC free article] [PubMed] [Google Scholar]