Abstract
Borate is an antibacterial preservative widely used in clinical and large scale epidemiological studies involving urine sample analysis. Since it readily forms covalent adducts and reversible complexes with hydroxyl and carboxylate groups, the effects of borate preservation in 1H NMR spectroscopy-based metabolic profiling of human urine samples have been assessed. Effects of various concentrations of borate (range 0–30 mM) on 1H NMR spectra of urine were observed at sequential time points over a 12 month period. Consistent with known borate chemistry, the principal alterations in the 1H resonance metabolite patterns were observed for compounds such as mannitol, citrate and α-hydroxyisobutyrate and confirmed by ESI-MS analysis. These included line-broadening, T1 and T2 relaxation and chemical shift changes consistent with complex formation and chemical exchange processes. To further investigate complexation behavior in the urinary metabolite profiles, a new tool for visualization of multi-component relaxation variations in which the spectra were color-coded according to the T1 and T2 proton relaxation times respectively (T1 or T2 Ordered Projection SpectroscopY, TOPSY) was also developed and applied. Addition of borate caused a general decrease in 1H T1 values consistent with non-specific effects such as solution viscosity changes. Minor changes in proton T2 relaxation rates were observed for the most strongly complexing metabolites. From a molecular phenotyping and epidemiologic viewpoint, typical interpersonal biological variation was shown to be vastly greater than any variation introduced by the borate complexation which had a negligible effect on the metabolic mapping and classification of samples. Whilst caution is indicated in the assignment of biomarker signals where metabolites have diol groupings or where there are adjacent hydroxyl and carboxylate functions, it is concluded that borate preservation is “fit-forpurpose” for 1H NMR-based epidemiological studies since the essential biochemical classification features of the samples are robustly maintained.
Keywords: Metabolic profiling, molecular epidemiology, metabonomics, borate, fit for purpose, transverse relaxation, longitudinal relaxation, projection spectroscopy, TOPSY, urine, complexation
Metabolic profiling of biofluids is now widely accepted as a tool for identifying biomarkers in disease diagnosis and toxicology,1–4 and the application of spectroscopic methods, based on either NMR spectroscopy or mass spectrometry, are now well validated for metabolic profiling of animal studies and for small scale human clinical studies.5–7
Understanding the variation in metabolic phenotypes of is of importance in molecular epidemiology studies on diverse human populations.8–10 The development of the concept of the Metabolome-Wide Association Studies (MWAS) involving the broad, non-selective analysis and statistical characterization of metabolic phenotypes in relation to disease outcomes and risk factors in epidemiologic studies provides a framework for generating testable physiological hypotheses.11,12 However, the analytical and modelling challenges involved in metabolic phenotyping of samples from large-scale human population studies are greater than those typically found in standard clinical or toxicological studies. There is also huge potential for the retrospective analysis of stored samples collected in historically important epidemiological studies by 1H NMR spectroscopy and other analytical methods such as mass spectrometry, thus providing a rich source for metabolic exploration of human phenotypic variation and changes through time.25
To extract the maximum amount of biological information from NMR spectroscopic datasets and to avoid classification errors, it is essential to understand, minimize and control sources of both analytical and biochemical variation. This is increasingly important as advances in analytical sensitivity through the use of cryogenic probes13 and high-throughput by means of flow injection14 are contributing to the feasible use of NMR spectroscopy in large-scale studies, as are new methods in data processing and multivariate statistical analysis.15–17
Several studies have investigated the sources and degree of biological and analytical variation in NMR based metabonomic studies, including sample storage temperature/time,18–20 diurnal variation21 dietary intake22,23 and gender differences.24 Additionally, biological stability and analytical reproducibility are key issues for population screening studies where samples are collected, stored and analyzed over many months or even years. Recent studies have assessed the stability of human urine and plasma samples using both 1H NMR spectroscopy 26 and GC-MS27 derived metabolite profiles which appear to be largely stable up to 36 h without freezing. However, it is normal to add antibacterial to field collected samples that are not frozen immediately. Both borate and azide have been widely used as a preservatives for urine as they are highly effective as antimicrobial agents and easy to use in the field for epidemiological studies.28–30 Of these two commonly-used preservatives, borate is preferred since it is much less toxic and reactive than azide which has also been reported to accelerate the hydrolysis of esterified metabolites.31 However, borate is reactive towards diols (particularly vicinal) and compounds with adjacent hydroxyl and carboxylate functional groups such as are found in many common metabolites including carbohydrates, polyols, alditols and hydroxylated fatty acids. Indeed, the capacity for borate to bind to vicinal diols has been widely exploited analytically in the production of phenyl-boronate sorbents and phases that can be used to extract and isolate suitable diols including sugars and drug glucuronides.32
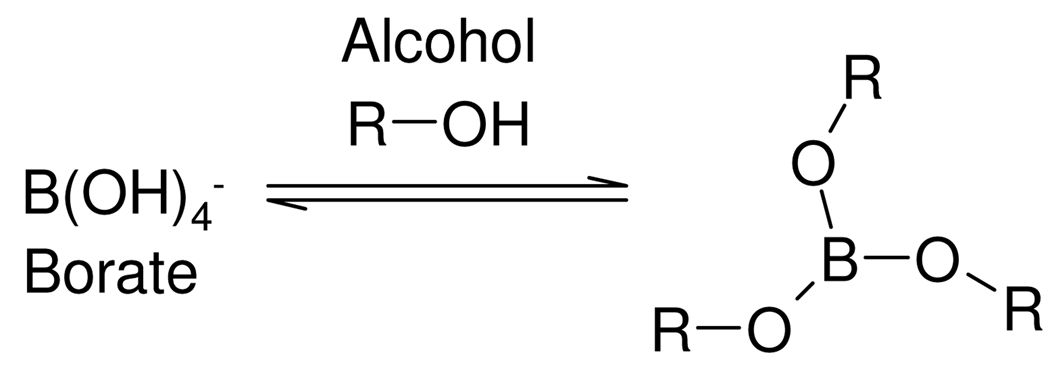
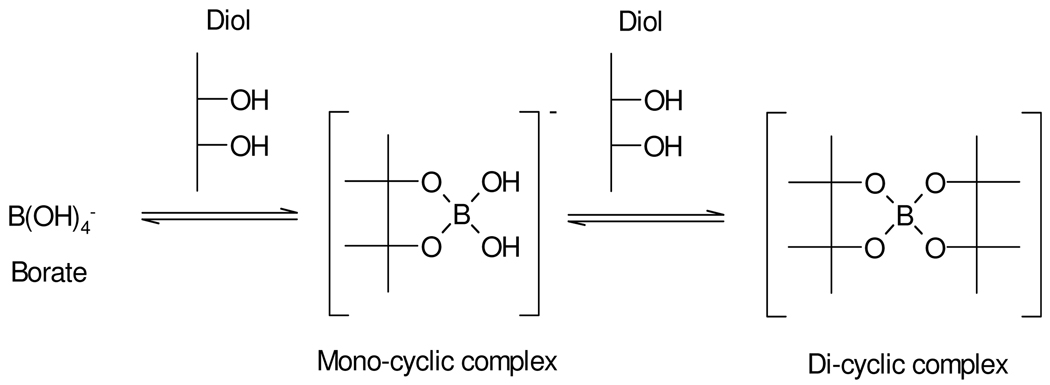
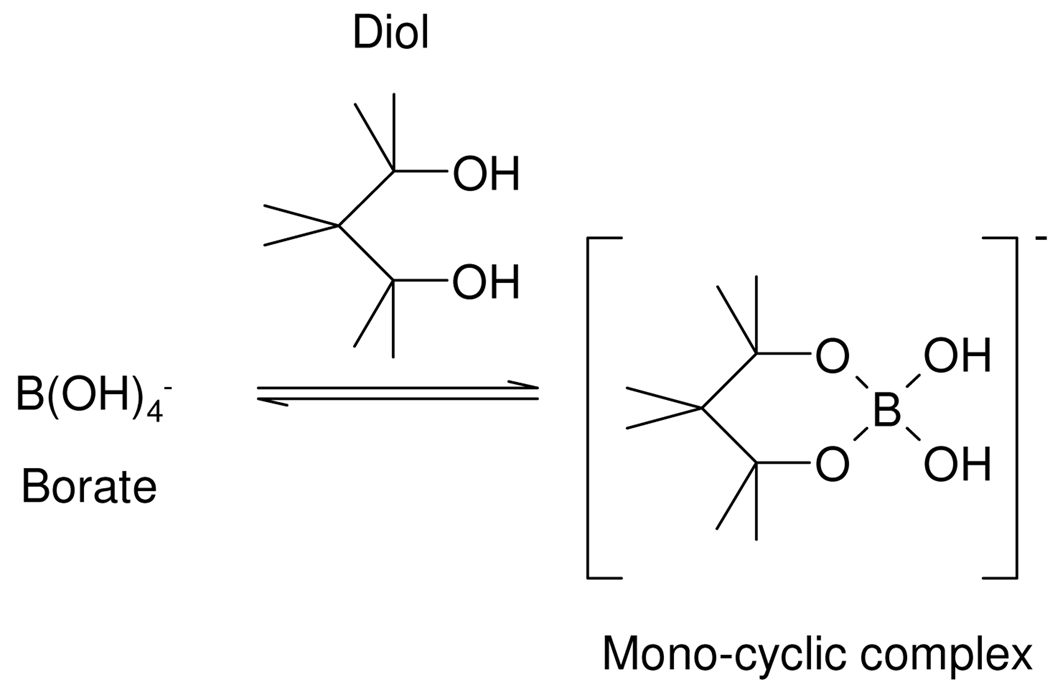
Borate in aqueous solution acts as a Lewis acid since it exists mainly as the fully hydrated B(OH)4− ion, (B(OH)3 + H2O ↔ B(OH)4− + H+). Borate can form complexes with alcohols (ROH) to yield neutral esters such as B(OR)3 as shown in Scheme 1.33,34 The ion [B(OH)4]−(aq) also readily forms anionic 1:1 and 1:2 complexes with carbohydrates and most polyols possessing 1,2 substitution35,36 and 1,3 substitution,35,37 and molecules containing dicarboxylic acids and diketones may also form complexes.36,38 These complexation reactions are readily reversible and a number of measurements of equilibrium constants have been published, including through the use of 11B NMR spectroscopy.39 The equilibrium constants and stoichiometry of the complexed species are also highly pH dependent and mass spectrometry has also been used to successfully characterize borate/diol complexes.35 While data exist on complexes of borate in various solvents,40,41 multiple borate complexes with a range of metabolites have not been well characterized, especially in terms of the kinetics and molecular dynamics of ligand exchange although this is not a primary purpose of our study. In this study, we have investigated the consequences of borate addition on the 1H NMR spectral profiles of urinary metabolites, in terms of effects on proton chemical shifts and T1 and T2 relaxation times across a range of borate concentrations and specimen storage times. This involved the use of both model solutions and complete urine samples. Direct infusion electrospray mass spectrometry (ESI-MS) was also used to confirm the formation and stoichiometry of borate complexes using standard solutions. The main aim was to evaluate possible influences of borate complexation on sample classification error in metabonomic studies, on potential consequent biomarker mis-assignment and hence to asses the extent to which borate preservation of epidemiological urine samples is “fit-for-purpose” for large scale human metabonomics and molecular phenotyping investigations.
Scheme 1.
Borate-alcohol complex
METHODS
Materials
All chemicals were obtained from Sigma (St. Louis, MO, USA) except D2O (99.9%) which was from Goss Scientific Instruments Ltd (Essex, UK).
Collection and Preparation of Quality Control Samples
Ten aliquots were prepared from a 24 hour human urine from a Caucasian male containing variable amounts of borate (0, 3.07, 6.15, 9.22, 12.29, 16.90, 21.51, 24.58, 27.66 and 30.73 mM) to mimic possible variation of boric acid concentration in specimens from epidemiological studies. The highest concentration was determined by the lowest urinary excretion volume (24 h) in both INTERMAP and INTERSALT studies, and the highest number of containers used. Prior to analysis, 300 µL of urine were mixed with 200 µL of buffer (0.2 M Na2HPO4, 1 mM 3-(trimethylsilyl)-2,2,3,3-d4-propionic acid (TSP), 10% (v/v) D2O, pH 7.4) and transferred into 5 mm NMR tubes. Samples were thawed and analyzed after 0, 1, 2, 7, 14, 28, 91, 182 and 364 days of storage at −40 °C.
1H NMR spectroscopy
Standard 1D 1H NMR spectra were acquired at 300K on either a Bruker DRX400 spectrometer equipped with a 5 mm SEI probe operating at 400.13 MHz, a Bruker Avance-II spectrometer equipped with a 5 mm TXI probe operating at 600.22 MHz or a Bruker Avance-III spectrometer equipped with a 5 mm SEI probe operating at 800.32 MHz. Each spectrum was acquired using a standard water peak presaturation pulse sequence of the form d1-90x-t1-90-tm-90x-acquire FID, where t1 is 3 µs, with selective irradiation of the water resonance during the recycle delay (d1) and mixing time (tm). A total of 64 scans was acquired at a spectral width of 12 kHz (20 ppm). The mixing time was 100 ms, with an acquisition time of 2.6 s and a recycle delay of 2 s. Prior to Fourier transformation the free induction decays were multiplied by an exponential function corresponding to a line broadening factor of 1 Hz, and zero-filled to 128k data points. Spectra were referenced to the chemical shift of TSP (taken to be δ0.00). Standard 1-dimensional NMR spectra were also measured on model solutions, prepared as 1:1 metabolite: borate ratio (10 mM each), at 1H observation frequencies of 400 MHz, 600 MHz and 800 MHz. These three observation frequencies were used in order to maximise the opportunity to observe the chemical shift changes and chemical exchange effects of any borate complexation. In addition, 600 MHz 1H NMR spectra have been measured on a sub-set (n = 200,) human urine samples collected from the Chicago arm of the study as part of the INTERSALT epidemiologic study, using the same pulse sequence and parameters as given above.25
Data processing and statistical analysis
Prior to principal components analysis (PCA), spectra were segmented into 0.04 ppm regions and the total peak integral calculated within each segment (with the segments containing the δ 4.5–5.0 region removed to eliminate artefacts associated with varying water suppression), and normalized to total intensity. PCA models were constructed using SIMCA-P+ Version 10.5 (Umetrics, Sweden). This simplified approach using segmented integral data was used because the aim of the analysis was to assess the effect of borate on PCA mapping positions and not to evaluate the spectra in terms of potential biochemical biomarkers.
Measurement of T1 and T2 relaxation times
The quality control sample was used to measure apparent T1 values for all resonances simultaneously using the standard inversion recovery pulse sequence of the form d1-180x-τ-90x-acquire FID where d1 is a delay for relaxation (set to 10 times longest estimated T1), and τ is a variable T1 relaxation delay, taking values between 0.001 s and 60 s. After a series of spectra were acquired with increasing values of τ, the apparent T1 was estimated by non-linear regression of the intensity of each data point to the equation, Mz(τ) = Mz(∞)(1–2exp(−τ/T1) + c, where Mz denotes the intensity value and c is a constant. T2 values were measured using the pulse sequence d1-(τ/2-180x-τ/2)n-acquire FID, where τ was fixed at 400 µs, and n took values of 20 to 1920 in steps of 100, followed by non-linear regression to the equation Mz(t) = Mz(0)exp(−τ/T2).
Method for constructing TOPSY plots
Here, a new visualization tool called T1 (or T2)-ordered projection spectroscopy (TOPSY) is introduced to aid interpretation of relaxation time changes across multiple compounds in complex spectra. TOPSY is the projection of relaxation time parameters, calculated at each data point in an NMR spectrum and visualized according to a color scale, on to the 1D spectrum. Following acquisition of the series of NMR spectra, the step-wise process for constructing TOPSY plots using Matlab (Mathworks, Natick, MA) was as follows:
Plot the aligned NMR data matrix, X, and normalize such that all spectra have the same average value for noise.
Select a column vector vpeak in X known to correspond to a metabolite resonance intensity in the spectra that changes in intensity as a function of the time parameter in the pulse program.
Compute the correlation matrix, Cpeak, between X and vpeak using the equation Cpeak = (n−1)−1vpeakTX, and remove all columns in X in which the square of the correlation coefficient is below a given threshold. This speeds up the calculation by removing the parts of the spectral noise.
For longitudinal and transverse relaxation respectively, fit each remaining column vector in X to the appropriate equations above and solve for T1 and T2. This generates a list of T1s or T2s (vector r) for each ppm value corresponding to a spectral peak.
Use a suitable RGB color display function to plot the fully-relaxed spectrum colored with values taken from r.
Direct Infusion ESI-MS Analysis
The following solutions were analysed (all at 10 mM): mannitol, citrate, methylmalonate, 2-hydroxybutyrate, borate, plus each standard compound at 10 mM with 10 mM borate. Samples were made up in high-grade water and infused directly into a Q-TOF Premier (Waters Micromass, Manchester, UK) at a flow-rate of 20 µL/min, using a 250 µL Hamilton syringe connected to a syringe pump. Data were collected using the centroid mode in both positive and negative ion mode using ‘V-Optics’ over 5 min for each sample, scanning a mass range of 50–1000 m/z. Scan time was 1 s with an interscan delay of 0.02 s. MS conditions were as follows: capillary voltage 3200 V in positive mode and 2400 V in negative mode, sampling cone voltage 35 V, extraction cone 5 V, desolvation gas 450 l/hr, cone gas 0 l/hr, source temperature 120°C and desolvation temperature 350°C. The instrument was operated with leucine enkephalin employed as the lock-spray (Waters Corporation, Milford, USA) solution at a concentration of 200 pg/µL, infused into the instrument at 20 µL/min, with scans to average set to 3.
RESULTS
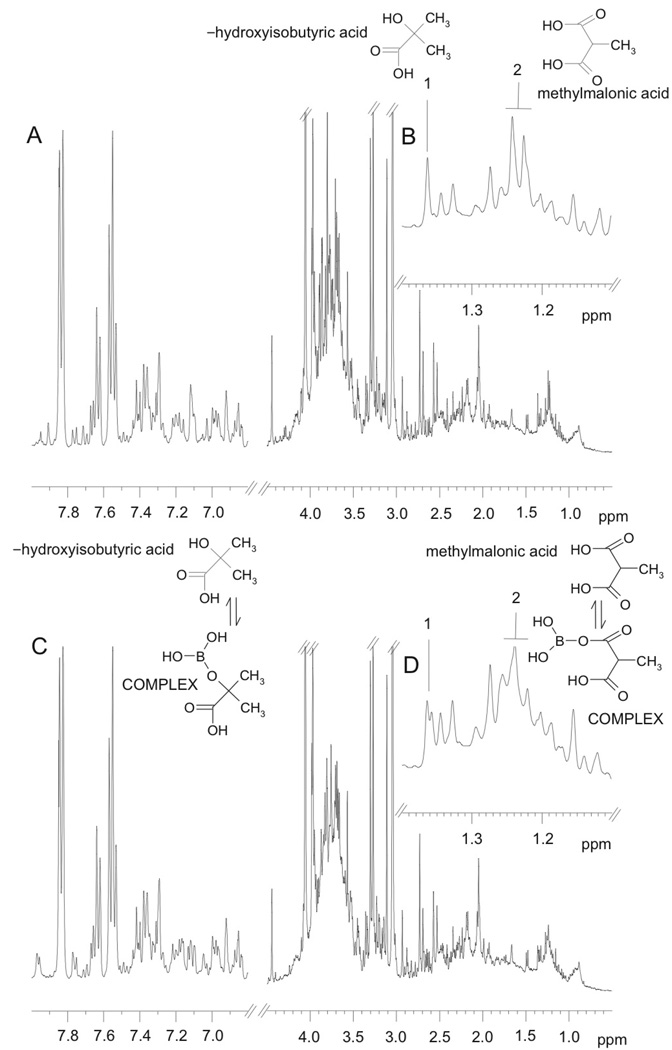
1H NMR spectra from urine specimens stored for 24 hours at room temperature supplemented with 0 and 30.73 mM borate are shown in Figure 1A and C, respectively. Visual examination of the spectral profiles revealed that the spectra were remarkably similar, but that some minor differences could be observed in the spectral regions δ3.4 – 4.1 and δ 1.1 – 1.4. For example, the α-hydroxyisobutyrate methyl singlet resonance at δ 1.36 with no borate present (Fig. 1A (inset, labelled 1)) appears as two singlets in the same urine sample after addition of 30.73 mM borate (Fig. 1B, inset labelled 1). Thus it appears that α-hydroxyisobutyrate exists as both the free substance and the borate complex in slow exchange. A similar behavior is observed for the methylmalonate methyl doublet resonance at δ1.25, (inset, labeled 2). This suggests that the sample contains a mixture of the free metabolite and borate-complexed metabolite in slow exchange on the NMR time scale. Although not visible in Figure 1 because of the complexity of the spectra, when the spectra are expanded, changes in the appearance of the peaks assigned to citrate and mannitol are also visible.
Figure 1.
Typical 1H NMR spectra of control human urine samples containing: (A) no borate; (B) expansion of the region between δ1.1–1.4 from A; (C) the same sample with added 30.73 mM borate; (D) expansion of the region between δ1.1–1.4 from C. Peaks annotated “1” and “2” correspond to α-hydroxyisobutyric acid and methylmalonic acid, respectively, either free (in A and B) or in complex with borate (in C and D).
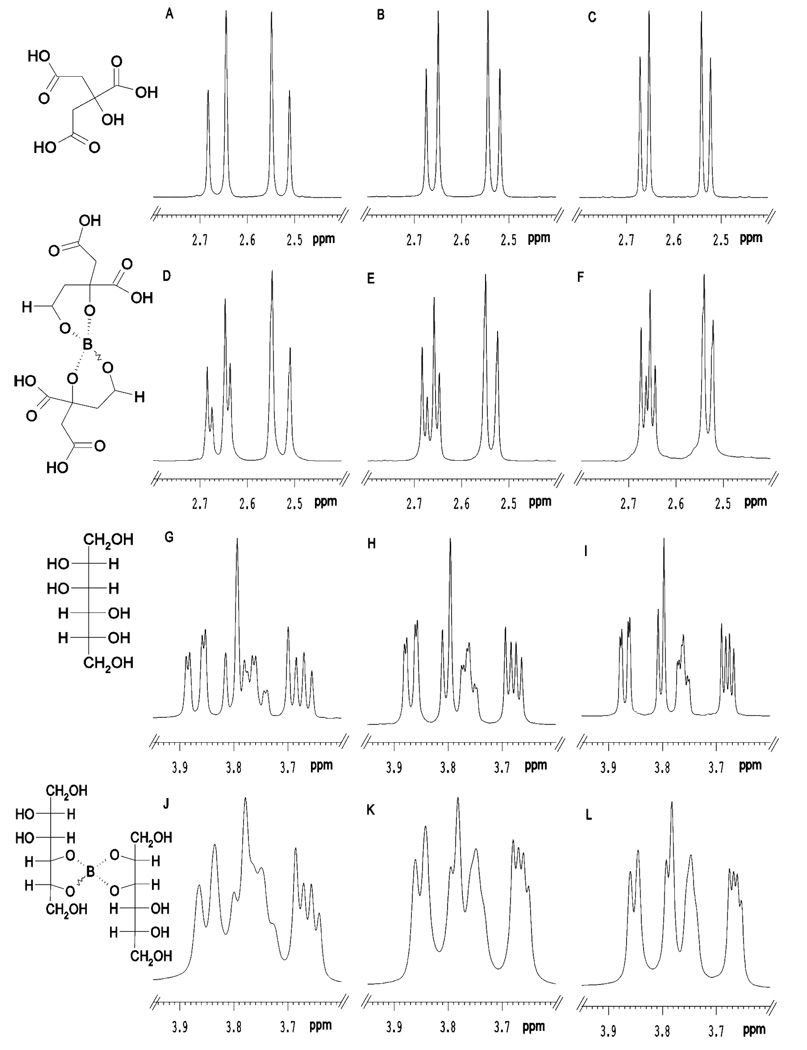
Given the complexity of 1H NMR spectra of urine, the regions of the spectra where the citrate and mannitol peaks appear were also investigated using model solutions and a range of NMR observation frequencies (1H observation at 400, 600 and 800 MHz). The results are summarized in Figure 2 where the left hand column shows spectra at 400 MHz, the center column at 600 MHz and the right hand column at 800 MHz. These three observation frequencies were used in an attempt to maximize the visualization of effects due to any differences in exchange rates between the metabolite and the borate.
Figure 2.
1H NMR spectra of a standard solution containing: (A–C) citrate, (D–F) citrate/borate complex, (G–I) mannitol, (J–L) mannitol/borate complex. A, D, G and J are data acquired at 400 MHz, B, E, H and K are data acquired at 600 MHz and C, F, I and L are data acquired at 800 MHz. Proposed structures of these compounds and their complexes are given in the left hand panel of the figure.
The NMR peaks for citrate comprise a standard AB pattern at all frequencies (as seen in Figs 2A–2C) where the CH2 protons are non-equivalent. On complexation with borate (Figs 2D–2F), the exchange between free metabolite and the borate complex is slow on the NMR time scale and separate peaks were observed for the two species at all observation frequencies, although this is best visualized at 800 MHz where the chemical shift difference is greatest. Only the high-frequency component of the AB pattern is significantly affected. The situation for mannitol complexation is slightly different and the peaks observed for free mannitol are given in Figs 2G–2I. On complexation with borate, the peak pattern is essentially unchanged and the peaks are merely broadened at all observation frequencies (Figs 2J–2L). This suggests that the exchange is intermediate on the NMR time-scale and apparently faster than that for the borate-citrate complex. This could arise because either the chemical shift differences between free and bound forms are smaller or the equilibrium constant is lower, such that the exchange appears faster on the NMR time scale and line broadening results. Alternatively, fast exchange could result from a lowering of the activation energy.
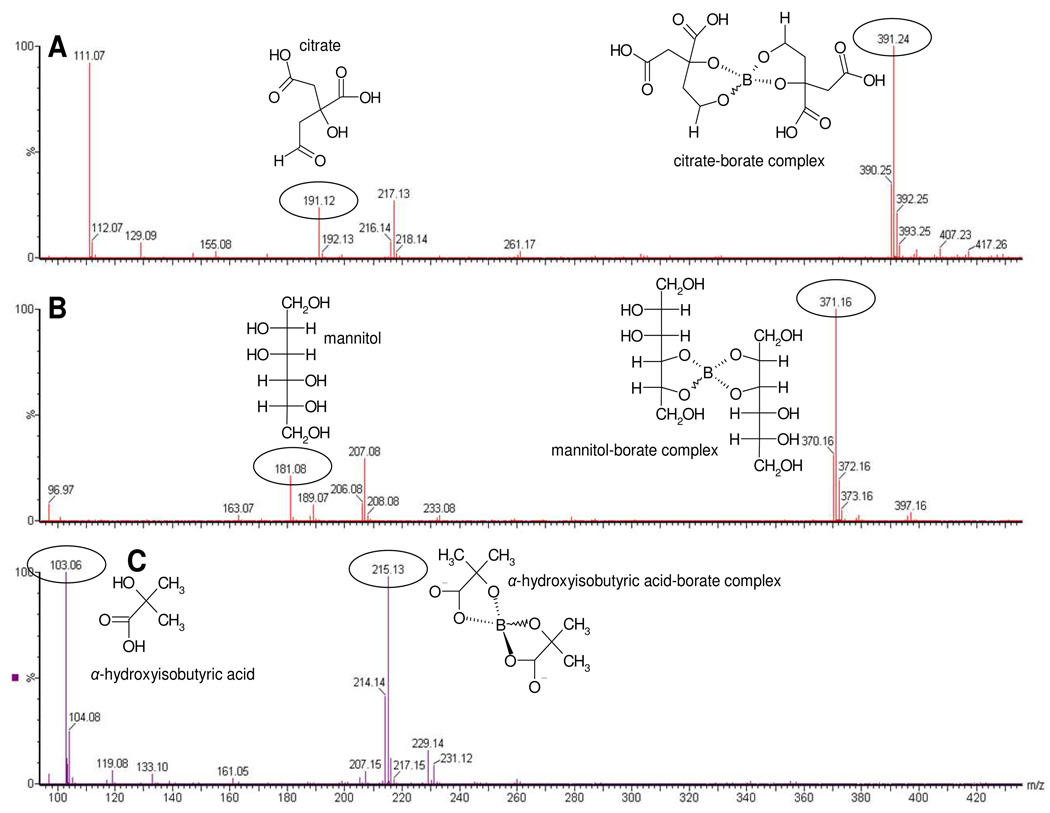
The possible stoichiometry of the citrate- and mannitol-borate complexes was investigated further using mass spectrometry. Direct infusion ESI analysis of a solution of 10 mM citrate plus 10 mM boric acid gave distinct peaks in negative ion mode at m/z 191.12, m/z 390.25 and m/z 391.24 (Figure 3A). Through comparison with the citrate standard alone, these were deduced to correspond to the [M-H]− ion of citrate (m/z 191.0) and a borate-citrate complex comprising two citrate, plus one borate ion. Specifically, m/z 390.25 and m/z 391.24 coincide with the mass of citrate-[10B]-citrate and citrate-[11B]-citrate, while a smaller peak at m/z 392.25 is citrate-[11B]-citrate with one 13C atom. The relative isotopic abundance of boron [10B]:[11B] is 20:80, and the distinctive isotope pattern of boron can be seen in the mass spectra, also aiding identification. This was also seen with a solution of 10 mM mannitol plus 10 mM borate, where a peak corresponding to free mannitol was observed at m/z 181.08 and a borate-mannitol complex comprising two mannitol molecules plus one borate molecule at m/z 370.16 (mannitol-[10B]-mannitol) and m/z 371.16 (mannitol-[11B]-mannitol) (Figure 3B). The smaller peak at m/z 372.16 is mannitol-[11B]-mannitol with one 13C atom. Finally, α-hydroxy-isobutyrate (α-HIBA) also formed a complex with borate, again 2:1 α-HIBA: borate (Figure 3C). This gave rise to ions at m/z 103.06 (free α-HIBA) and the complex with peaks at m/z 214.14 (α-HIBA-[10B]- α-HIBA) and m/z 215.13 (α-HIBA-[11B]-3-HIBA) (Figure 3C). The smaller peak at m/z 216.15 is α-HIBA-[11B]- α-HIBA with one 13C atom. This stoichiometry is likely to be the most common formed during the ESI process, where analytes are concentrated during ionization, and so it is expected that there are other stoichiometries present in lower amounts. However, based on the borate concentrations used in this study, it appears that the urinary complexes observed by 1H NMR spectroscopy were in most likely to have 1:2 borate:metabolite stoichiometry although lower abundance species may also be present, they do not appear to contribute significantly to the NMR spectra.
Figure 3.
Direct infusion (negative mode) ESI spectrum of a sample containing equal molar (A) citrate:borate, (B) mannitol:borate; (C) α-hydroxyisobutyrate:borate in water.
Effects of borate complexation on observed T1 and T 2 relaxation times
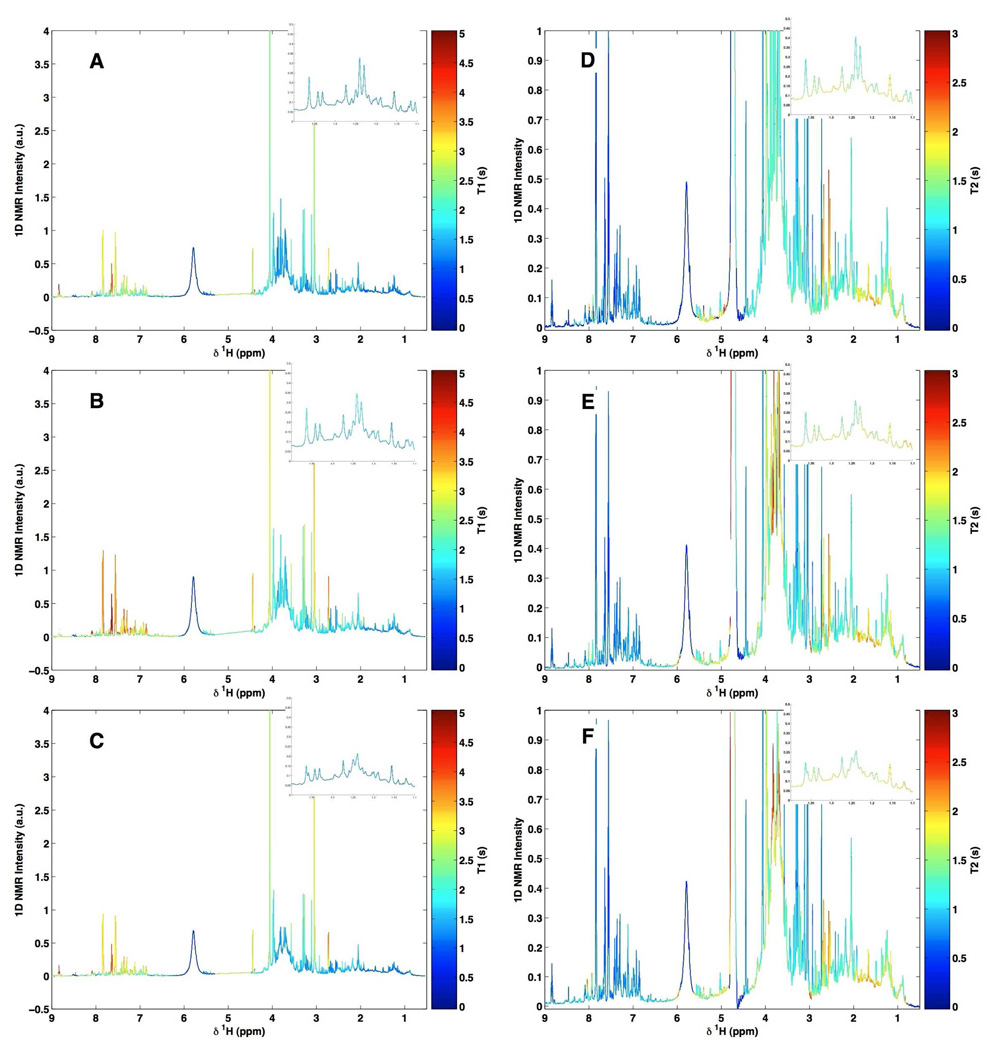
Although in the above examples the interaction of borate with specific metabolites had an effect on chemical shift and coupling patterns, it is conceivable that for other metabolites the effects of borate interaction might be more subtle. For example, modification of relaxation parameters would not be noticeable on a single NMR spectrum, but would influence the relative intensity of a given resonance when acquired under standard conditions. To visualize the potentially more subtle effects of borate complexation across the whole biofluid spectrum and between spectra, a new method for depicting variations in T1 and T2 relaxation times, namely, T1 or T2 ordered projection spectroscopy (TOPSY) has been developed, and this was applied to the urine specimens containing three concentrations of borate (0, 3.07 and 30.73 mM) (Fig. 4 A–C for T1OPSY and D–F for T2OPSY). 1H NMR spectra were acquired at 600 MHz using the inversion-recovery pulse sequence for T1 relaxation measurements and the CPMG pulse sequence for T2 relaxation measurements. T1 and T2 relaxation times for the various proton nuclei were computed at each spectral data point in the frequency domain (see Methods).
Figure 4.
600 MHz TOPSY spectra from a quality control urine sample supplemented with different amounts of borate. (A and D) borate-free urine sample, (B and E) the same urine sample supplemented with 3.07 mM borate and (C and F) the same urine sample supplemented with 30.7 mM borate. In A, B and C, the color scale represents T1 values projected onto the 1D spectrum. In D, E and F, the color scale represents T2 values projected onto the 1D spectrum.
While many techniques exist to facilitate in the interpretation of such data, TOPSY allows the calculated T1 or T2 relaxation times to be projected as a color directly onto the original 1D 1H NMR spectrum of the mixture. Thus TOPSY allows visual recovery of higher order information on chemical interactions in complex multi-component systems, while maintaining relative peak intensities and multiplet structures. Although it is the protons that are characterized by the relaxation times, an “effective” T1 or T2 value can be calculated for each spectral data point and by this means the differences in the relaxation times (both T1 and T2) between samples in Fig. 4 are seen, highlighting the resonances that are affected by borate preservation.
By examination of the TOPSY plot based on the 1H T1 relaxation times (Figs 4A–4C), it can be seen that addition of borate simply causes a general reduction of T1 values across the whole spectrum. Thus peaks colored red without borate addition become orange/yellow, and those originally colored blue become cyan. This effect is probably due to an overall effect of borate on the solution, possibly caused by a slight increase in solution viscosity which would cause a reduction of small molecule T1 values. This also indicates that the relative peak intensities are also unlikely to be affected by borate addition and if data were to be acquired under partially saturating NMR conditions, borate addition would not cause any additional problems of quantitation.
Examination of the TOPSY plots based on T2 relaxation times, shows more specific effects consistent with borate-metabolite complexation (see Figs 4B–4F). The two main effects are a shortening of the citrate proton T2 values after addition of borate and the lengthening of the T2’s of protons giving rise to specific carbohydrate resonances assignable to mannitol. This behaviour is consistent with borate-metabolite complexation, and the direction of change of T2 will be influenced by both the altered molecular reorientational mobility and the exchange rate. It is concluded that borate-induced changes in T2 relaxation times are small and limited to the main complexed species described above.
Chemometric analysis of NMR spectra from borate-treated urine samples
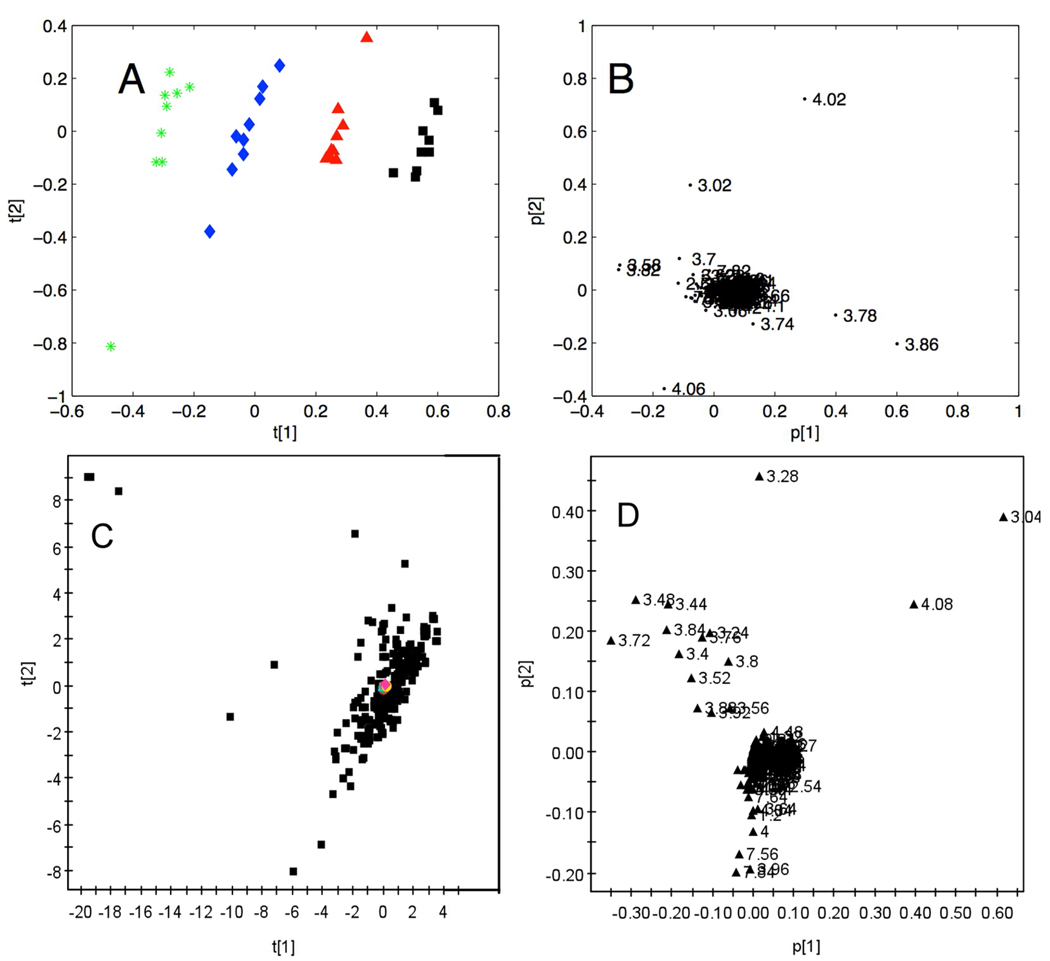
To investigate the detailed effects of borate on the global statistical mapping of urinary metabolic NMR data, spectral profiles of urine containing 4 concentrations of borate (0, 3.07, 16.90, and 30.73 mM) at 9 successive time points over 12 months (see Methods) were acquired at 400 MHz. The spectral data were analyzed by PCA and the scores plot is shown in Fig 5A. Here, each data point represents one spectral profile color-coded to indicate the concentration of borate. Differences caused by variation in concentrations of borate were largely described by the first principal component. The corresponding loadings plot (Fig. 5B) denotes the 1H NMR chemical shifts of the variables responsible for the distribution in Fig. 5A, and this is largely due to resonances in the chemical shift region δ 3.4 – 4.1. Close inspection of the spectra indicated that this sample contained mannitol, thus explaining the majority of the observed variation in this PCA model. The effects of storage time at −40°C were negligible (and not responsible for the observed variation in PC2), consistent with our previous observations. 20
Figure 5.
(A) PC1 v. PC2 scores plot of 1H NMR spectral data from urine samples with varying borate concentrations and storage times. The four concentrations of borate are 0 (green), 3.07(blue), 16.90 (red) and 30.73 (black) mM in urine at 9 time points over a period of 12 months; (B) PCA loading plot for the scores in A; (C) PC1 v. PC2 scores plot of 1H NMR spectral data from samples with varying borate concentrations (0, 3.07, 16.90 and 30.73 mM in urine) shown in red, and 200 urine sample from a typical western population shown in black; (D) PCA loading plot for the scores in (C). All data in A and B were acquired at 400 MHz, all data in C and D were acquired at 600 MHz observation frequencies.
Finally, to investigate the extent of this within-individual variation due to varying borate concentrations and time compared with inter-individual variation in a metabolic analysis of epidemiologic dataset, a range of urine samples containing 10 concentrations of borate (0, 3.07, 6.15, 9.22, 12.29, 16.90, 21.51, 24.58, 27.66 and 30.73 mM) were added to a set of human urine samples collected previously (n = 200).42,43 600 MHz 1H NMR spectroscopic data on urine samples were collected under the same preparation and acquisition conditions are described in the Methods section. In the resulting scores plot of the first two principal components based on the 1H NMR spectra (Fig. 5C), the specimens with varying concentrations of borate are colored red and the urine population metabolic dataset are black. The causes of the natural population variance are highlighted in Fig. 5D and cover a much wider range of chemical shifts than for Fig. 5B. From these results, it is clear that the variation associated with borate concentration is negligible compared with the inter-individual biological/biochemical variation in the population samples.
DISCUSSION
With development of innovative approaches to molecular epidemiology, large scale population screening of epidemiologic samples is now feasible, providing a novel means of identifying endogenous and exogenous biomarkers possibly associated with increased risk of disease.42,43 It is also possible to retrospectively examine samples banked years earlier as demonstrated by our analysis of the INTERMAP urine samples, collected in 1966–1999 and analyzed using 1H NMR spectral profiling in 2002–2004.11,25 To allow meaningful interpretation of data from banked samples, it is of key importance to isolate artifactual sources of variation that might lead to mis-assignment of signals and false biomarker identification. Complexation with borate is one such source of variation in metabolic profiles and, as this is a widely used urinary preservative, it is important to assess its influence on spectral metabolite profiles.
Borate has been used for urine sample preservation in a large number of clinical and epidemiologic studies for many decades. It has been shown to prevent urine from bacterial overgrowth,44 enabling samples to be obtained within a variety of fields42,45 and analyzed some time after collection. In comparison to biochemistry, modern analytical techniques such as 1H NMR spectroscopy provide information across the full range of metabolites in human urine, so it is likely that complexation with borate can affect the NMR spectral analysis. However, previous chemometric investigations have shown that the presence of borate does not in itself impair classification of samples.25 This is consistent with other data, which shows that borate does not interfere with standard clinical assays such as those for determining urinary creatinine or albumin.46 Nonetheless it is essential that possible chemical alterations to a spectral profile are understood in order to validate classification or biomarker identification.
For this investigation, the spectral profiles of urine samples preserved with various borate concentrations covering the range expected in epidemiologic investigation were compared.42 A new visualization technique (TOPSY) in which the measured T1 or T2 relaxation times of nuclei contributing to the NMR spectra are color-coded onto the urinary spectra enabled immediate comparison of metabolite complex signals that are changed in relaxation times due to borate complexation and assisted in the identification of those metabolites that interact with borate. These interactions were confirmed by consideration of standard solutions, using direct infusion ESI-MS, from which one possible stoichiometry for the borate-metabolite complexes has been proposed.
In addition to identifying metabolites that were affected by borate, from a population screening perspectives, it is important to determine how the concentration of borate affect 1H NMR spectral profiles globally. It was shown that the overall changes in the urinary spectral profile caused by borate addition are negligible compared with the physiological and metabolic differences between the individuals, despite minor spectral changes due to interactions between borate and citrate, mannitol, methylmalonate and α-hydroxyisobutyrate. Also, the addition of borate to urine has been shown to inhibit bacterial growth and therefore preserve levels of ethyl glucuronide,47 (a more reliable marker of chronic alcohol consumption than ethanol), a matter of particular interest to the INTERMAP study given the association of alcohol intake with blood pressure.48 Moreover, borate has been shown to be a suitable urinary preservative for the purpose of proteomic studies.49 We have investigated these effects in urine samples from broadly healthy individuals, but in most diseased subjects these and other metabolites may be observed in different proportions which may indicate caution if discriminating disease biomarkers contain diols or other borate-reactive species.
We concluded that the overall changes in the urinary spectral profile caused by borate are negligible in comparison with inter-individual biological variation and that this method of preservation is fit for purpose in large-scale metabolic epidemiology screening study.
Scheme 2.
Borate-1,2 diol complex
Scheme 3.
Borate-1,3 diol complex
ACKNOWLEDGEMENTS
LMS acknowledges funding from the METAGRAD PhD programme supported by AstraZeneca, Unilever and Servier. ADM acknowledges funding from the EU framework 6 MOLPAGE project. The INTERSALT Study was supported by the Council on Epidemiology and Prevention of the International Society and Federation of Cardiology, World Health Organisation, International Society of Hypertension, Wellcome Trust, National Heart, Lung, and Blood Institute of the USA, Heart Foundations of Canada, Great Britain, Japan and the Netherlands, Chicago Health Research Foundation, Parastatal Insurance Company Belgium and by other national agencies supporting local studies.
ABBREVIATIONS
- PCA
principal component analysis
- TOPSY
T1 orT2 ordered projection spectroscopy
- TSP
3-trimethylsilyl[2,2,3,3-2H4]propionic acid, sodium salt.
References
- 1.Coen M, Holmes E, Lindon JC, Nicholson JK. Chem. Res. Tox. 2008;21:9–27. doi: 10.1021/tx700335d. [DOI] [PubMed] [Google Scholar]
- 2.Nicholson JK, Connelly J, Lindon JC, Holmes E. Nat. Rev. Drug Disc. 2002;1:153–161. doi: 10.1038/nrd728. [DOI] [PubMed] [Google Scholar]
- 3.Ala-Korpela M. Clin. Chem. Lab. Med. 2008;46:27–42. doi: 10.1515/CCLM.2008.006. [DOI] [PubMed] [Google Scholar]
- 4.Tukiainen T, Tynkkynen T, Mäkinen VP, Jylänki P, Kangas A, Hokkanen J, Vehtari A, Gröhn O, Hallikainen M, Soininen H, Kivipelto M, Groop PH, Kaski K, Laatikainen R, Soininen P, Pirttilä T, Ala-Korpela M. Biochem. Biophys. Res. Commun. 2008;375:356–361. doi: 10.1016/j.bbrc.2008.08.007. [DOI] [PubMed] [Google Scholar]
- 5.Beckonert O, Keun HC, Ebbels TMD, Bundy J, Holmes E, Lindon JC, Nicholson JK. Nature Protocols. 2007;2:1–12. doi: 10.1038/nprot.2007.376. [DOI] [PubMed] [Google Scholar]
- 6.Gowda GAN, Zhang S, Gu H, Asiago V, Shanaiah N, Raftery D. Exp. Rev. Mol. Dia.g. 2008;8:617–633. doi: 10.1586/14737159.8.5.617. [DOI] [PMC free article] [PubMed] [Google Scholar]
- 7.Gika HG, MacPherson E, Theodoridis GA, Wilson ID. J. Chromatogr. B. 2008;871:299–305. doi: 10.1016/j.jchromb.2008.05.048. [DOI] [PubMed] [Google Scholar]
- 8.Holmes E, Wilson ID, Nicholson JK. Cell. 2008;134:714–717. doi: 10.1016/j.cell.2008.08.026. [DOI] [PubMed] [Google Scholar]
- 9.Sabatti C, Service SK, Hartikainen AL, Pouta A, Ripatti S, Brodsky J, Jones CG, Zaitlen NA, Varilo T, Kaakinen M, Sovio U, Ruokonen A, Laitinen J, Jakkula E, Coin L, Hoggart C, Collins A, Turunen H, Gabriel S, Elliot P, McCarthy MI, Daly MJ, Järvelin MR, Freimer NB, Peltonen L. Nature Genetics. 2009;41:35–46. doi: 10.1038/ng.271. [DOI] [PMC free article] [PubMed] [Google Scholar]
- 10.Yan B, Jiye A, Wang G, Lu H, Huang X, Liu Y, Zha W, Hao H, Zhang Y, Liu L, Gu S, Huang Q, Zheng Y, Su J. J. Appl. Physiol. 2009;106:531–538. doi: 10.1152/japplphysiol.90816.2008. [DOI] [PubMed] [Google Scholar]
- 11.Holmes E, Loo RL, Stamler J, Bictash M, Yap IK, Chan Q, Ebbels T, De Iorio M, Brown IJ, Veselkov KA, Daviglus ML, Kesteloot H, Ueshima H, Zhao L, Nicholson JK, Elliott P. Nature. 2008;453:396–400. doi: 10.1038/nature06882. [DOI] [PMC free article] [PubMed] [Google Scholar]
- 12.Nicholson JK, Holmes E, Elliott P. J. Proteome Res. 2008;7:3637–3638. doi: 10.1021/pr8005099. [DOI] [PubMed] [Google Scholar]
- 13.Keun HC, Beckonert O, Griffin JL, Richter C, Moskau D, Lindon JC, Nicholson JK. Anal.l Chem. 2002;74:4588–4593. doi: 10.1021/ac025691r. [DOI] [PubMed] [Google Scholar]
- 14.Spraul M, Hoffmann M, Ackermann M, Nicholls AW, Damment SJ, Haselden JN, Shockcor JP, Nicholson JK, Lindon JC. Anal. Commun. 1997;34:339–341. [Google Scholar]
- 15.Cloarec O, Dumas ME, Craig A, Barton RH, Trygg J, Hudson J, Blancher C, Gauguier D, Lindon JC, Holmes E, Nicholson JK. Anal. Chem. 2005;77:1282–1289. doi: 10.1021/ac048630x. [DOI] [PubMed] [Google Scholar]
- 16.Bylesjö M, Eriksson D, Kusano M, Moritz T, Trygg J. Plant J. 2007;52:1181–1191. doi: 10.1111/j.1365-313X.2007.03293.x. [DOI] [PubMed] [Google Scholar]
- 17.Trygg J, Holmes E, Lundstedt T. J. Proteome Res. 2007;6:469–479. doi: 10.1021/pr060594q. [DOI] [PubMed] [Google Scholar]
- 18.Lauridsen M, Hansen SH, Jaroszewski JW, Cornett C. Anal. Chem. 2007;79:1181–1186. doi: 10.1021/ac061354x. [DOI] [PubMed] [Google Scholar]
- 19.Teahan O, Gamble S, Holmes E, Waxman J, Nicholson JK, Bevan C, Keun HC. Anal. Chem. 2006;78:4307–4318. doi: 10.1021/ac051972y. [DOI] [PubMed] [Google Scholar]
- 20.Maher AD, Zirah SF, Holmes E, Nicholson JK. Anal. Chem. 2007;79:5204–5211. doi: 10.1021/ac070212f. [DOI] [PubMed] [Google Scholar]
- 21.Bollard ME, Stanley EG, Lindon JC, Nicholson JK, Holmes E. NMR Biomed. 2005;18:143–162. doi: 10.1002/nbm.935. [DOI] [PubMed] [Google Scholar]
- 22.Lenz EM, Bright J, Wilson ID, Hughes A, Morrisson J, Lindberg H, Lockton A. J. Pharm. Biomed. Anal. 2004;36:841–849. doi: 10.1016/j.jpba.2004.08.002. [DOI] [PubMed] [Google Scholar]
- 23.Stella C, Beckwith-Hall B, Cloarec O, Holmes E, Lindon JC, Powell JQ, van der Ouderaa F, Bingham S, Cross AJ, Nicholson JK. J. Proteome Res. 2006;5:2780–2788. doi: 10.1021/pr060265y. [DOI] [PubMed] [Google Scholar]
- 24.Kochhar S, Jacobs DM, Ramadan Z, Berruex F, Fuerholz A, Fay LB. Anal. Biochem. 2006;352:274–281. doi: 10.1016/j.ab.2006.02.033. [DOI] [PubMed] [Google Scholar]
- 25.Dumas ME, Maibaum EC, Teague C, Ueshima H, Zhou B, Lindon JC, Nicholson JK, Stamler J, Elliott P, Chan Q, Holmes E. Anal. Chem. 2006;78:2199–2208. doi: 10.1021/ac0517085. [DOI] [PMC free article] [PubMed] [Google Scholar]
- 26.Barton RHB, Nicholson JK, Elliott P, Holmes E. Int. J. Epidemiol. 2008;37:i31–i40. doi: 10.1093/ije/dym284. [DOI] [PubMed] [Google Scholar]
- 27.Dunn WB, Broadhurst D, Ellis DI, Brown M, Halsall A, O’Hagan S, Spasic I, Tseng A, Kell DB. Int. J. Epidemiol. 2008;37:i23–i30. doi: 10.1093/ije/dym281. [DOI] [PubMed] [Google Scholar]
- 28.Porter IA, Brodie J. Br. Med. J. 1969;2:353–355. doi: 10.1136/bmj.2.5653.353. [DOI] [PMC free article] [PubMed] [Google Scholar]
- 29.Lum KT, Meers PD. J. Infect. 1989;18:51–58. doi: 10.1016/s0163-4453(89)93667-0. [DOI] [PubMed] [Google Scholar]
- 30.Gillespie T, Fewster J, Masterton RG. J. Clin. Pathol. 1999;52:95–98. doi: 10.1136/jcp.52.2.95. [DOI] [PMC free article] [PubMed] [Google Scholar]
- 31.Zaitsu K, Miki A, Katagi M, Tsuchihashi H. Forensic Sci. Int. 2008;174:189–196. doi: 10.1016/j.forsciint.2007.04.224. [DOI] [PubMed] [Google Scholar]
- 32.Tugnait M, Ghauri FYK, Wilson ID, Nicholson JK. J. Pharm. Biomed. Anal. 1991;9:895–899. doi: 10.1016/0731-7085(91)80020-a. [DOI] [PubMed] [Google Scholar]
- 33.Knoeck J, Taylor JP. Anal. Chem. 1969;41:1730–1734. [Google Scholar]
- 34.Magnusson LB. J Inorganic Nucl. Chem. 1971;33:3602–3604. [Google Scholar]
- 35.Ackloo SZ, Burgers PC, McCarry BE, Terlouw JK. Rapid Commun. Mass Spectrom. 1999;13:2406–2415. doi: 10.1002/(SICI)1097-0231(19991215)13:23<2406::AID-RCM806>3.0.CO;2-Z. [DOI] [PubMed] [Google Scholar]
- 36.Friedman S, Pizer R. J. Am. Chem. Soc. 1975;97:6059–6062. [Google Scholar]
- 37.Cox PJ. Talanta. 2000;51:205. [Google Scholar]
- 38.Pesetsky B, Eldred NR. Tetrahedron. 1969;25:4137–4145. [Google Scholar]
- 39.Isjhii T, Ono H. Carbohydr. Res. 1999;321:257–260. [Google Scholar]
- 40.Bachelier N, Verchere J-F. Polyhedron. 1995;14:2009–2017. [Google Scholar]
- 41.Tyman JHP, Mehet SK. Chem. Physics Lipids. 2003;126:177–199. doi: 10.1016/j.chemphyslip.2003.08.004. [DOI] [PubMed] [Google Scholar]
- 42.Elliott P, Stamler R. Control Clinical Trials. 1988;9:1S–117S. [PubMed] [Google Scholar]
- 43.Stamler J, Elliott P, Dennis B, Dyer AR, Kesteloot H, Liu K, Ueshima H, Zhou BF. J. Hum. Hypertens. 2003;17:591–608. doi: 10.1038/sj.jhh.1001603. [DOI] [PMC free article] [PubMed] [Google Scholar]
- 44.Meers PD, Chow CK. J Clin Pathol. 1990;43:484–487. doi: 10.1136/jcp.43.6.484. [DOI] [PMC free article] [PubMed] [Google Scholar]
- 45.Stamler J. Am. J. Clin. Nutrition. 1997;65:626S–642S. doi: 10.1093/ajcn/65.2.626S. [DOI] [PubMed] [Google Scholar]
- 46.Pugia MJ, Lott JA, Clark LW, Parker DR, Wallace JF, Willis TW. Eur. J. Clin. Chem. Biochem. 1997;35:693–700. [PubMed] [Google Scholar]
- 47.Thierauf A, Serr R, Halter CC, Al-Ahmad A, Rana S, Weinmann W. Forensic Sci. Int. 2008;182:41–45. doi: 10.1016/j.forsciint.2008.09.011. [DOI] [PubMed] [Google Scholar]
- 48.Stamler J, Elliott P, Dennis B, Dyer AR, Kesteloot H, Liu K, Ueshima H, Zhou BF. J. Human Hypertens. 2003;17:591–608. doi: 10.1038/sj.jhh.1001603. [DOI] [PMC free article] [PubMed] [Google Scholar]
- 49.Thongboonkerd V, Saetun P. J. Proteome Res. 2007;6:4173–4181. doi: 10.1021/pr070311+. [DOI] [PubMed] [Google Scholar]


