

Abstract
In this work the feasibility of measuring neuronal-glial metabolism in rat brain in vivo using co-infusion of [1,6-13C2]glucose and [1,2-13C2]acetate was investigated. Time courses of 13C spectra were measured in vivo while infusing both 13C-labeled substrates simultaneously. Individual 13C isotopomers (singlets and multiplets observed in 13C spectra) were quantified automatically using LCModel. The distinct 13C spectral pattern observed in glutamate and glutamine directly reflected the fact that glucose was metabolized primarily in the neuronal compartment and acetate in the glial compartment. Time courses of concentration of singly and multiply-labeled isotopomers of glutamate and glutamine were obtained with a temporal resolution of 11 min. Although dynamic metabolic modeling of these 13C isotopomer data will require further work and is not reported here, we expect that these new data will allow more precise determination of metabolic rates as is currently possible when using either glucose or acetate as the sole 13C-labeled substrate.
Keywords: [1,2-13C2]acetate; [1,6-13C2]glucose; 13C MRS; brain; isotopomers; neuronal-glial metabolism
Introduction
In vivo 13C NMR spectroscopy combined with the infusion of 13C-enriched substrates is a powerful tool for studying neuronal-glial metabolism in the brain. In contrast to in vitro or ex vivo studies in brain extracts which are typically performed at a single time point, in vivo studies allow measurement of dynamic 13C-labeling curves. These data can be analyzed with metabolic models and yield quantitative determination of metabolic rates [1]. In particular, measurement of glutamate and glutamine 13C turnover curves during [1-13C] or [1,6-13C2]glucose infusion and subsequent metabolic modeling with two-compartment neuronal-glial models have allowed non-invasive measurement of multiple metabolic fluxes, including the neuronal and glial TCA cycle rate and the glutamate-glutamine cycle rate (VNT) between neurons and astrocytes [2].
An elegant approach has been suggested nearly a decade ago to simultaneously measure both neuronal and glial metabolism using co-infusion of [1-13C]glucose and [1,2-13C2]acetate in brain tissue slices using 1H-decoupled 13C NMR spectroscopy [3]. The approach relies on the fact that [1-13C]glucose (or [1,6-13C2]glucose) and [1,2-13C2]acetate produce distinct isotopomers in their metabolic products (see Fig. 1). [1,2-13C2]acetate is exclusively metabolized in the glia to form [4,5-13C2]glutamate and [4,5-13C2]glutamine, which appear as doublets in 13C spectra (J45 ≈ 50 Hz), during the first turn of the TCA cycle. In contrast, although glucose is taken up by both compartments, it is metabolized primarily in neurons because the TCA cycle is about 4 times faster in neurons than in astrocytes. Metabolism of [1-13C]glucose (or [1,6-13C2]glucose) yields labeling in [4-13C]glutamate and [4-13C]glutamine (during the first turn of the TCA cycle) which appear as singlets in 13C spectra. The ability to distinguish different isotopomers therefore permits discrimination of acetate and glucose metabolism, reflecting primarily glial and neuronal metabolism respectively. This approach has been reported in several studies in brain extracts [3; 4; 5; 6; 7], but to the best of our knowledge this has not been demonstrated in vivo.
Fig. 1.
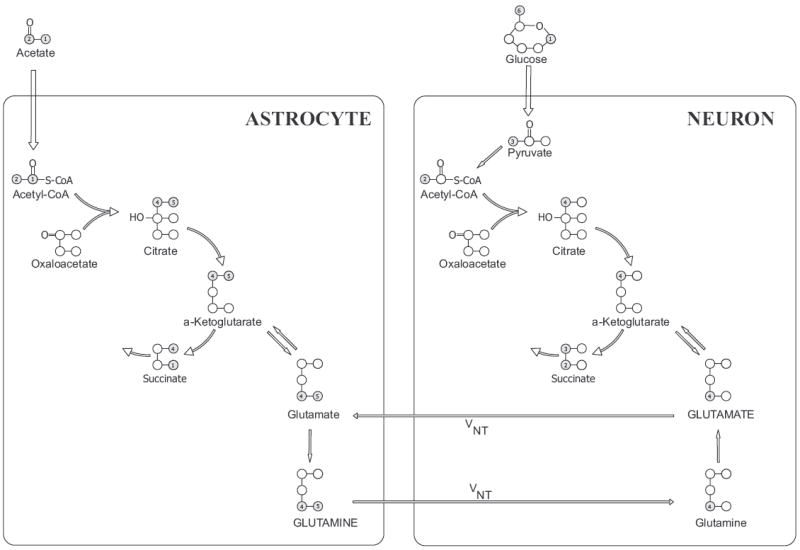
Incorporation of 13C labels into the neuronal and astrocytic compartments following simultaneous infusion of [1,6-13C2]glucose and [1,2-13C2]acetate in the brain. (For simplicity, the uptake of [1,6-13C2]glucose in the astrocytes is not shown.) In both cell types, [1,6-13C2]glucose is converted to [3-13C]pyruvate which enters the neuronal or astrocytic TCA cycle via pyruvate dehydrogenase in the form of acetyl-CoA and leads to the formation of single-labeled [4-13C]glutamate and [4-13C]glutamine. In astrocytes, [3-13C]pyruvate can also enter the TCA cycle via pyruvate carboxylase to yield [2-13C]glutamate. At the same time, after conversion to [1,2-13C2]acetyl-CoA in the astrocytes, acetate enters the TCA cycle to produce [4,5-13C2]glutamate and [4,5-13C2]glutamine during the first turn of the cycle. Glutamate released by neurons is taken up by astrocytes and converted into glutamine. Glutamine is then released and sent back to neurons where it is converted to glutamate. This cycling of neurotransmitter between astrocytes and neurons is referred to as the glutamate-glutamine cycle (VNT).
The goal of the present study is to demonstrate that the distinct isotopomer pattern observed in glutamate and glutamine during simultaneous infusion of [1,6-13C2]glucose and [1,2-13C2]acetate can be detected in vivo, and to demonstrate the feasibility of measuring this new information in a time-resolved, dynamic manner. We take advantage of our recently reported ability to detect and accurately quantify individual isotopomers, which appear as multiplets in 13C spectra [8].
Materials and Methods
Animal procedures
All animal experiments were approved by the Institutional Animal Care and Use Committee at the University of Minnesota. Five male Sprague-Dawley rats (240-275 g), fasted overnight, were anaesthetized and intubated with a 70%:30% N2O-O2 mixture and with 3% isoflurane. Femoral veins were cannulated for infusion of 13C-labeled glucose and 13C-labeled acetate. Femoral arteries were also cannulated to measure blood gases and blood glucose levels and to monitor arterial blood pressure. After surgery isoflurane was maintained at 1.8%. Temperature was maintained at 37 °C using a rectal thermosensor and a circulating hot water bath. Animals were infused simultaneously with [1,6-13C2]glucose and [1,2-13C2]acetate. A bolus of 99%-enriched glucose (1.1 M) was given at an exponentially decaying rate over 5 min followed by a constant-rate infusion (1.46 g/kg/h) of 70%-enriched glucose for 3 h [8]. 13C-labeled acetate (99%-enriched, 1.6 M, pH 4) was administered as a bolus (decreasing exponentially over 8 min) followed by a constant infusion (1.50 g/kg/h) for the rest of the experiment [9]. In addition, blood samples (300 μL) were collected for determination of blood isotopic enrichment of glucose, acetate and lactate. Physiological conditions were maintained throughout the experiment (pH ~ 7.4, PCO2 ~ 35 mm Hg and PO2 > 100 mm Hg). At the end of the in vivo experiments, animals were sacrificed using a focused microwave fixation device (Gerling Applied Engineering, Inc., CA, USA) which inactivates most enzymes in the brain almost instantly (4 kW, 1.2 s irradiation). Perchloric acid extracts of brain tissue were prepared as described previously [8]. These brain extracts were analyzed by high-resolution NMR in order to determine the isotopic enrichment of amino acids at the end point.
In vivo MRS
After surgery, animals were placed in a cradle and the head secured with a bite-bar and ear rods. The RF coil was placed on top of the head. In vivo spectra were acquired on a 9.4 T horizontal bore magnet (Magnex, Abingdon, UK) interfaced to a Varian INOVA console (Varian, Palo Alto, CA, USA). The surface transmit and receive radiofrequency probe consisted of a linear 13C surface coil and two 1H coils in quadrature. Localized in vivo 13C NMR spectra were acquired from a 400 μL voxel (9 × 5 × 9 mm3) in the rat brain using a 1H-localized polarization transfer sequence [10]. Shimming was performed using FAST(EST)MAP [11], resulting in a 16-18 Hz water linewidth. A repetition time (TR) of 2.5 s was used and proton decoupling (WALTZ-16) was applied during the acquisition time (205 ms, 8192 complex points). Data were collected in blocks of 256 scans resulting in a temporal resolution of ~11 min.
Quantification of in vivo spectra using LCModel
Time courses of in vivo 13C{1H} spectra from each individual animal were analyzed automatically using LCModel (Stephen Provencher Inc., Oakville, ON, Canada). The basis spectrum for each detectable isotopomer was simulated using home-written programs in Matlab (The MathWorks Inc., Natick, MA, USA) using published 13C chemical shifts and homonuclear 13C-13C coupling values (JCC) from Henry et al. [8]. For isotopomers labeled at more than one carbon position, the effect of JCC modulation occurring during the DEPT sequence was taken into account by simulating the appropriate phase distortion. No J-modulation was simulated for carbons coupled to a carboxyl group. Although they did undergo J-modulation, this effect was refocused since the carboxyl carbons resonances were outside the excitation bandwidth (~85 ppm) of the 13C BIR-4 pulse and therefore the corresponding 13C spins were not excited.
Scaling of in vivo 13C-labeling curves
Time courses obtained from LCModel in arbitrary units were scaled to actual 13C concentrations using values of isotopic enrichments at the end point determined from brain extracts (see next section for details on high-resolution NMR measurements). Although we chose to determine these enrichments from high-resolution spectra of brain extracts in the present study, these isotopic enrichments can also in principle be determined directly in vivo using Proton-Observed Carbon-Edited MRS as demonstrated in previous animal and human studies [12; 13].
The scaling procedure for glutamate C4 was performed as follows. First the absolute 13C concentration of glutamate C4 at the end point was obtained using the isotopic enrichment determined from brain extracts and assuming a total glutamate concentration of 10 μmol/g. Second, a scaling factor was applied to glutamate C4 curves (i.e. Glu-C4S, Glu-C4D43, Glu-C4D45, GluC4-DD and GluC4-total) so that the total concentration GluC4-total (average of last five points of the in vivo curve) matched the 13C concentration of glutamate C4 determined from brain extracts. The same procedure was used to scale curves for glutamate C3 as well as glutamine C4 and C3, assuming a glutamine concentration of 4 μmol/g.
The isotopic enrichment of glutamate and glutamine at the C2 position cannot be measured from 1H{13C} spectra even in brain extracts because the corresponding proton resonances at 3.75 ppm overlap almost completely. Therefore glutamate C2 and glutamine C2 time courses were scaled relative to glutamate C4 and glutamine C4 time courses respectively, by applying a correction factor (determined on phantom) to account for polarization transfer efficiency and off-resonance effects in the pulse sequence used for in vivo measurements. Similarly the 13C concentration of acetate and lactate in the brain was scaled relative to glutamate C4 concentration.
Analysis of brain extracts
High-resolution MRS measurements were performed on a 14.1 T UNITY INOVA high-resolution spectrometer (Varian, Palo Alto, CA, USA) equipped with a 5 mm triple resonance probe with single Z-axis gradient. The isotopic enrichment of glutamate and glutamine C4 and C3 was determined on brain extracts using 1H{13C} Proton-Observed Carbon-Edited spectroscopy with 13C decoupling during acquisition. Unedited and edited spectra were fitted with LCModel. Isotopic enrichment was measured by the relative ratio of the 13C resonance (from the edited 1H-13C spectra) to the total resonance (12C + 13C) obtained from the unedited 1H spectrum at the C4 and C3 carbon positions.
Analysis of plasma samples
The concentration of plasma glucose was measured using an Analox glucose analyzer (Analox, London, UK). Plasma samples were then measured using high-resolution NMR at 14.1 T to determine the concentration of blood acetate and lactate (using the signal of glucose as a reference) and the isotopic enrichment of glucose, acetate and lactate. 450 μL D2O was added to each 100 μl plasma sample. A STEAM diffusion 1H NMR sequence (TE = 9 ms, TM = 64 ms, TR = 10 s, 32 averages, temperature of 37 °C) without 13C decoupling was used to separate the blood plasma metabolites resonances from macromolecule and lipoproteins resonances as reported elsewhere [14]. Acetate H2, glucose H1α and lactate H3 resonances were fitted using the Varian built-in line fitting software. Total concentrations of acetate and lactate were determined by adding signals from protons attached to 12C and to 13C and using the total signal from glucose H1α as a concentration reference. Isotopic enrichment of glucose, acetate and lactate was determined by the ratio of signals from protons attached to 13C divided by the sum of signals (12C + 13C).
In addition to 1H spectra, high-resolution 13C NMR spectra were also acquired from plasma samples collected at 10, 70 and 130 min after the start of 13C infusion to evaluate the amount of recycling of 13C label into glucose C2-C5 (liver metabolism). Spectra were acquired using an 8 mm broadband probe at 37 °C and using a pulse-acquire sequence (TR = 10 s, 256 averages) with NOE and 1H decoupling. 13C resonances were fitted using the spectrometer built-in software after applying an LB of 0.2 Hz.
Results
Measurement of concentration and 13C isotopic enrichment of substrates in plasma
Analysis of plasma samples by 1H NMR showed rapid increase in the concentration and isotopic enrichment of glucose and acetate after the start of the 13C infusion (Fig. 2). The isotopic enrichment of [1,2-13C2]acetate and [1,6-13C2]glucose reached steady-state within 10 min (95 ± 1% and 59 ± 2% respectively). The arterial plasma acetate concentration rose quickly after the bolus (10.0 ± 0.4 mmol/L at 10 min) before gradually decreasing to nearly 3 mmol/L at the end of the study (Fig. 2). Furthermore an increase in blood lactate concentration and isotopic enrichment was observed. Isoflurane anesthesia is known to cause an increase in lactate concentration [15]. At the end point, lactate concentration in the blood was 5.0 ± 0.7 mmol/L and its isotopic enrichment was 39 ± 1%.
Fig. 2.
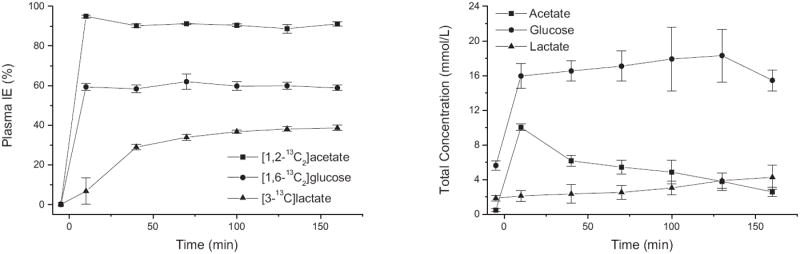
13C isotopic enrichment (left) and total concentration (right) of glucose, acetate and lactate in blood plasma. Error bars represent standard deviation (n = 5).
In addition to the detection of [1,6-13C2]glucose, [1,2-13C2]acetate and [3-13C]lactate, resonances from glucose labeled at C2-C5 positions were also observed in 13C spectra of plasma, although they were too low to be visible in vivo (approximately 0.5-1.0 mmol/L of 13C glucose at the end point corresponding to a low isotopic enrichment of 4–6 %). These were presumably produced in the liver by gluconeogenesis from the infused acetate. Therefore there is progressive appearance of 13C-labeling in the blood in different molecules (e.g. lactate) and different carbon positions (e.g. glucose C2-C5) than the infused substrates. This creates additional sources of 13C label that can be and need to be taken into account in metabolic modeling (unless they are small enough to be neglected).
High-resolution NMR spectroscopy of brain extracts
The isotopic enrichments of glutamate and glutamine were measured on brain extracts. The isotopic enrichment in glutamine C4 (71 ± 5%) was higher than that of glutamate C4 (48 ± 2%) at the end point of experiments (~180 min). In contrast, the isotopic enrichment at the C3 position for glutamine was lower (34 ± 7%) than that of glutamate C3 (43 ± 1%). These values of isotopic enrichments at the end point were used to scale in vivo 13C-labeling time courses.
In vivo 13C data
An in vivo 13C NMR spectrum measured in the rat brain after infusion of 13C-labeled substrates showed 13C-labeling of numerous resonances in multiple metabolites such as glutamate, glutamine, aspartate, lactate or GABA (Fig. 3). The fitted spectrum obtained with LCModel closely matched the in vivo spectrum as indicated by the small residuals (Fig. 3). In addition, LCModel analysis allowed separate quantification of individual isotopomers (multiplets) contributing to each resonance. For instance, the glutamate resonance at 34.37 ppm could be fitted by a combination of a singlet (C4S), two doublets (D43 and D45) and one doublet of doublets (DD) (Fig. 4).
Fig. 3.
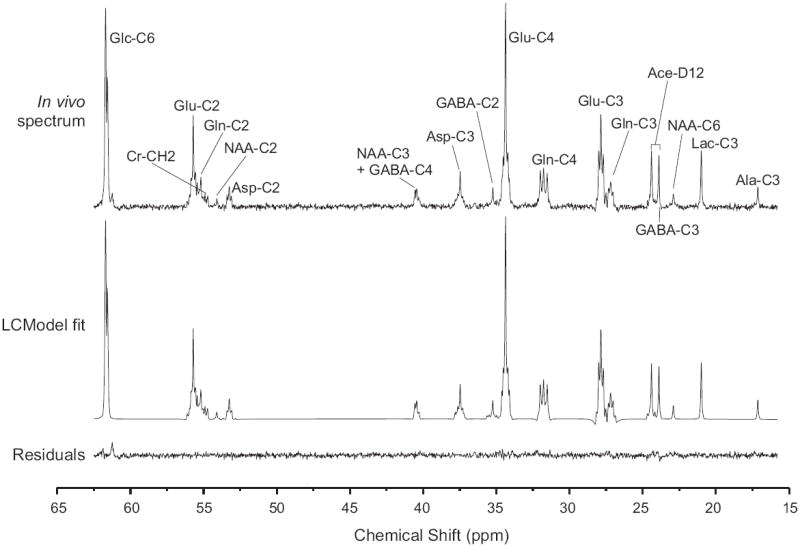
LCModel fit of an in vivo 13C NMR spectrum obtained during simultaneous infusion of [1,6-13C2]glucose and [1,2-13C2]acetate (sum spectrum of 5 rats, voxel size of 400 μL, 4096 scans per rat measured during 3 hours infusion of the 13C-labeled substrates). From top to bottom: in vivo spectrum, LCModel fit and residuals. Ace: acetate; Ala: alanine; Asp: aspartate; Cr: creatine; GABA: gamma-aminobutyric acid; Glc: glucose; Glu: glutamate; Gln: glutamine; Lac: lactate; and NAA: N-acetyl aspartate.
Fig. 4.
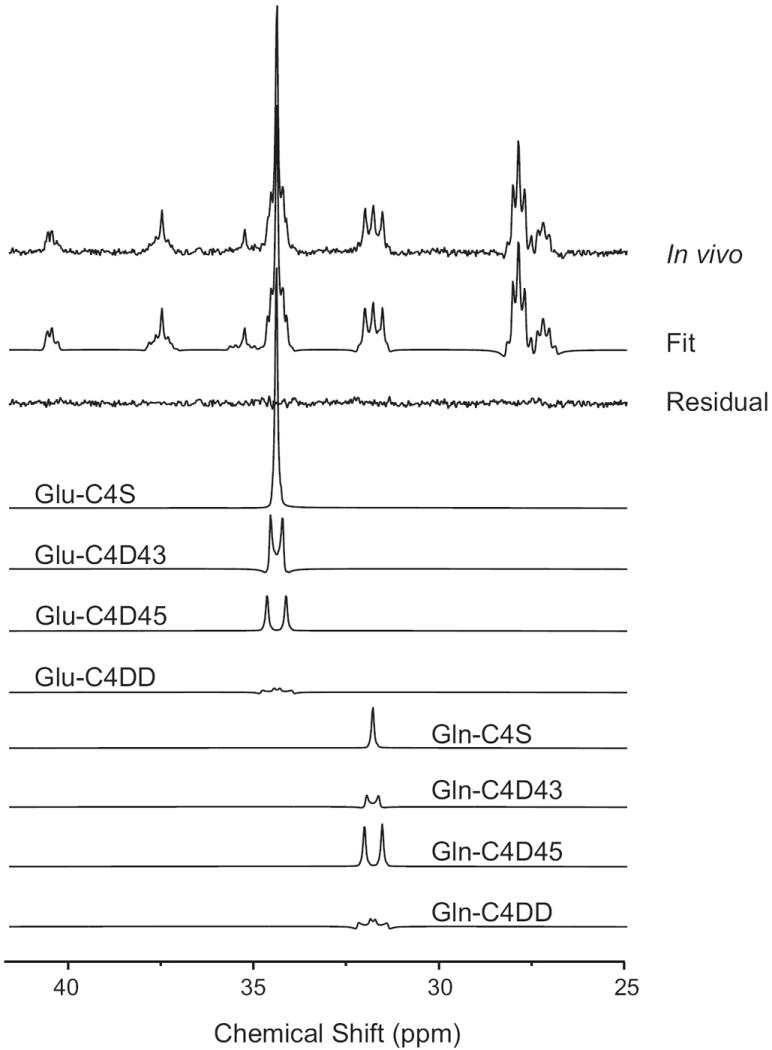
Decomposition of the individual isotopomers contributing to glutamate and glutamine C4 resonances from in vivo spectrum shown in Fig. 3. C4D45 doublets from [4,5-13C2] glutamate and glutamine are synthesized from [1,2-13C2]acetate while the C4S singlets and C4D43 doublets originate from [1,6-13C2]glucose. Note the large signal from the C4D45 doublet in glutamine indicates that a large fraction of glutamine is synthesized from [1,2-13C2]acetate metabolism in the glial TCA cycle.
The distinct spectral pattern of glutamate C4 and glutamine C4 directly reflected the fact that glucose and acetate are metabolized in different metabolic compartments in the brain (Fig. 4). The glutamine C4 resonance showed a large contribution from the doublet D45, indicating that a large fraction of the synthesized glutamine came from glial metabolism of [1,2-13C2]acetate during the first turn of the TCA cycle. In contrast, the glutamate C4 resonance was dominated by a singlet, indicating that most glutamate is synthesized from [1,6-13C2]glucose metabolism in neurons. However, this compartmentation is not absolute. For example, the glutamine C4 resonance contained not only a C4D45 doublet but also a noticeable singlet C4S component. This singlet component comes from two different sources. First, glucose is metabolized not only in neurons but also in astrocytes (albeit at a much smaller rate than in neurons). Second, glial glutamine receives 13C label from neuronal glutamate through the glutamate-glutamine cycle. Both pathways result in a singlet in glutamine C4. Similarly glutamate was not a pure singlet and also contained a small C4D45 component. Nonetheless, the strikingly different spectral pattern in glutamate and glutamine observed here in vivo is a direct reflection of cellular compartmentation and provides distinct metabolic information.
Finally, this spectral information was measured in a dynamic manner in vivo. Time courses of 13C concentrations of the individual isotopomers (singlets and multiplets) of glutamate and glutamine resonances were measured using a temporal resolution of 11 min (Fig. 5). The average coefficient of variation was 2.6% and 3.0% for total glutamate and glutamine C4 respectively at isotopic steady-state. The doublets of doublets for glutamate and glutamine, i.e. C4DD, are not shown due to their low concentration (0.11-0.21 μmol/g at 3 h).
Fig. 5.
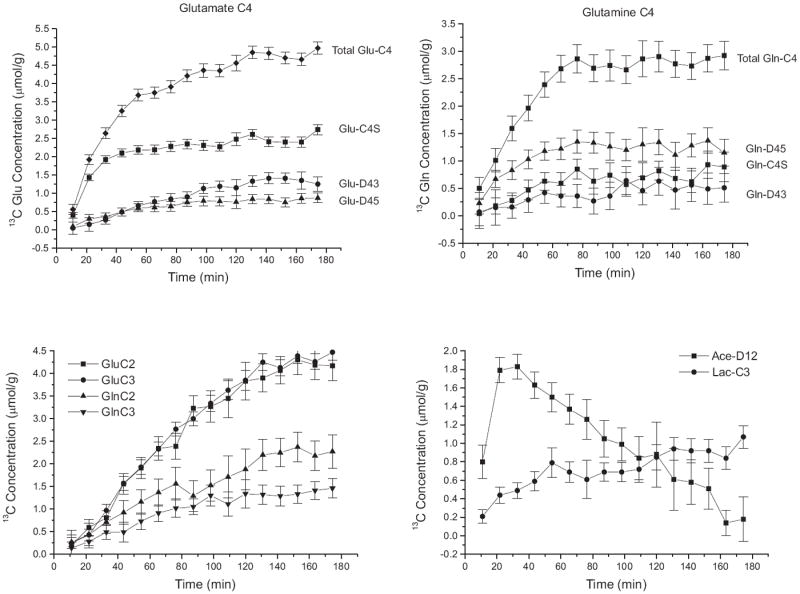
In vivo time courses of 13C concentration (μmol/g) of (a) glutamate C4 isotopomers (b) glutamine C4 isotopomers (c) total glutamate and total glutamine labeled at C2 and C3 positions and (b) acetate-D12 and lactate-C3 in the rat brain during co-infusion of [1,6-13C2]glucose and [1,2-13C2]acetate with a time resolution of 11 min (256 scans for each time point with a TR of 2.5s). Error bars represent mean Cramér-Rao Lower Bound (n = 5).
The concentration of 13C-labeled acetate in the brain increased steadily after the start of 13C infusion (1.8 ± 0.1 μmol/g at 33 min) before decreasing slowly (Fig. 5), consistent with the measured time course of acetate concentration in plasma (Fig. 2). Lactate-C3 concentration in the brain rose continuously throughout the study (from 0.2 ± 0.1 μmol/g at ~11 min to 1.0 ± 0.1 μmol/g at 180 min).
Discussion
This study demonstrates the feasibility of measuring time courses of multiple 13C isotopomers of glutamate and glutamine during simultaneous infusion of [1,6-13C2]glucose and [1,2-13C2]acetate in rat brain in vivo. The distinct spectral pattern in glutamate and glutamine resulting from the metabolism of [1,6-13C2]glucose and [1,2-13C2]acetate can be observed in vivo on 13C spectra and directly reflects compartmentation of brain metabolism between neurons and astrocytes. This approach will allow us to perform experiments in vivo that were hitherto possible only on brain extracts.
Comparison with previous in vivo studies using 13C-glucose alone or 13C-acetate alone
Most previous studies have used [1-13C]glucose or [1,6-13C2]glucose as a substrate (see for example [2; 13] for review). A handful of in vivo experiments with 13C-acetate have also been reported [16; 17; 18; 19; 20]. In particular, 13C-labeling time courses of glutamate C4 and glutamine C4 from [2-13C]acetate metabolism were recently reported in the brain in vivo [17]. It is instructive to compare the results obtained from double infusion of 13C-labeled glucose and 13C-labeled acetate as used in the present study with results obtained in previous studies when infusing either [1,6-13C2]glucose alone or [2-13C]acetate alone under similar infusion conditions. When infusing [1,6-13C2]glucose alone, glutamate C4 gets labeled more rapidly than any other resonance and reaches the highest isotopic enrichment [8; 21; 22; 23]. In contrast, glutamine C4 enrichment is typically about 30% lower than glutamate C4 enrichment at isotopic steady-state, because of net loss and isotopic dilution of glutamine [24]. For example, we give below isotopic enrichments obtained when [1,6-13C2]glucose was infused with an infusion protocol similar to that used in the present study but under alphachloralose anesthesia [8] (which gives metabolic rates similar to isoflurane anesthesia). In these experiments, the enrichment of glucose in the blood was ~65% (slightly higher than blood glucose enrichment obtained in the present double infusion experiment). The enrichment of glutamate C4 and glutamine C4 were ~53% and ~38% at 150 min following infusion.
In contrast to glucose, infusion of acetate alone in humans resulted in 3-fold higher enrichment in glutamine (14%) than in glutamate (4%) [17]. Similarly, during infusion of [2-13C]acetate in rats with an infusion rate similar to that used in the present study, isotopic enrichment was 3-fold higher in glutamine than in glutamate (44% versus 14% respectively) [9].
Double infusion essentially combines these two separate experiments (glucose alone and acetate alone) into one single experiment. During double infusion, we observed a high enrichment in glutamine C4 at isotopic steady-state (71%), consistent with glutamine getting labeled from both glucose and acetate metabolism. In contrast, the enrichment of glutamate C4 at isotopic stead-state was similar to that obtained when using [1,6-13C2]glucose alone, in agreement with glutamate C4 being synthesized primarily from glucose. Indeed, the time course of glutamate measured during double infusion was very similar to time courses of glutamate C4 measured during infusion of glucose alone under similar conditions [8; 23]. Finally, the ratio of isotopic enrichments of glutamine C4 to glutamate C4 at isotopic steady-state from the double infusion study (~1.5) was higher than when using glucose alone (~0.7) but still much lower than when using acetate alone (~ 3), again reflecting the superposition of metabolism from both glucose and acetate.
A key aspect of double infusion experiments is to combine [1,6-13C2]glucose with [1,2-13C2] acetate rather than [2-13C]acetate. With this strategy, a distinct spectral pattern is observed in glutamate C4 and glutamine C4 as was shown earlier in brain extracts [3; 5]. These spectral patterns are a unique feature of 13C MRS and they directly reflect the compartmentation of metabolic pathways. Most notably, the time course of the doublet C4D45 in glutamine arises almost exclusively from [1,2-13C2]acetate metabolism through the TCA cycle in astrocytes (neglecting possible minor contributions from scrambling of label in glucose present in the blood, for example due to liver pyruvate recycling. These contributions can be assessed from MRS of blood samples). In contrast, the singlet in glutamine arises from glutamate C4 as well as from a small uptake of glucose directly into astrocytes. From separate studies of acetate transport (not shown), we estimate that, when infusing acetate as in the present study, about 80% of astrocytic acetyl-CoA is synthesized from acetate and the remaining 20% from glucose, so that the uptake of glucose into astrocytes during double infusion is smaller than when infusing 13C-glucose alone.
Considerations regarding metabolic modeling
Since the compartmentation of metabolism for each substrate is not absolute, labeling curves measured during double infusion of glucose and acetate cannot be neatly separated into “neuronal” and “astrocytic” curves. The only exception is the time course of the glutamine C4D45 doublet, which purely reflects astrocytic metabolism. All other curves involve some scrambling of label between the two compartments, as mentioned earlier.
One way to harness the full information content of the dynamic in vivo data is to analyze labeling curves with a multi-compartment metabolic model. Metabolic rates are determined by adjusting the rates so that kinetic labeling curves computed from the model best fit the experimental data. This approach has been used extensively for glucose studies (see [2] for review). For example, although glutamate and glutamine labeling curves measured during infusion of 13C-glucose alone cannot be ascribed purely to neuronal or astrocytic processes, fitting of these curves with a two-compartment metabolic model has allowed determination of a number of metabolic fluxes in the brain; including the astroytic TCA cycle rate, and the rate of glutamate-glutamine cycle and the rate of pyruvate carboxylase.
A similar metabolic modeling approach can be used to fit the data obtained during double infusion and take full advantage of the metabolic information contained in the data. However several new developments are necessary before this can be achieved. First, a new metabolic model needs to be developed to take into account the additional information available from 13C-13C isotopomers. Previously reported two-compartment “positional” models of brain metabolism allow modeling of total 13C enrichment at each carbon position but not modeling of individual isotopomer time courses. We recently presented preliminary accounts for a new “isotopomer” model to fit dynamic isotopomer data [25].
A second requirement for successful metabolic modeling of double infusion curves is that acetate uptake into the brain and its conversion to acetyl-CoA need to be parameterized accurately in the model. Simultaneous measurement of both blood plasma and brain concentration of acetate at different levels of acetate infusion should allow determination of the kinetics parameters for acetate transport and utilization. Preliminary results suggest that utilization of acetate in the brain is saturated for blood acetate concentrations above ~3 mM [9]. Therefore, even though the concentration of acetate in blood plasma was not constant in our study, this should not affect 13C time courses in glutamate and glutamine. Consistent with this observation, time courses of 13C glutamate and glutamine synthesized from acetate (reflected in the C4D45 doublets) reached isotopic steady-state after 60 min even though the brain acetate concentration was not constant. In summary the development of an isotopomer metabolic model and the characterization of acetate transport and utilization are well under way. We expect metabolic modeling of double infusion curves to be feasible in the near future.
Perspectives for increased precision in metabolic modeling
Recently we showed that metabolic modeling studies with [1-13C]glucose or [1,6-13C2]glucose alone may not allow precise determination of all metabolic fluxes in the model when using a two-compartment model [26]. Although we do not report metabolic modeling of curves measured during double infusion in the present study, several lines of evidence support the idea that additional metabolic information from multiple substrates and/or from multiple isotopomers leads to increased precision in metabolic modeling.
First, it has been shown in heart studies performed with one-compartment models that the precision of fitted metabolic fluxes is improved when taking into account the information from individual isotopomers [27].
Second, a recent study reported quantitative measurement of metabolic fluxes in the brain using two separate experiments conducted while infusing either [2-13C]acetate or [1-13C]glucose (therefore requiring two separate experiments in two separate animals) [28]. This two-step approach with two different substrates was presumably chosen in order to improve stability in the fitting procedure with a complex three-compartment metabolic model. Interestingly, the double infusion approach presented here would allow measurement of similar information in only one experiment instead of two.
Finally, two recent preliminary reports suggest that dynamic metabolic information from two different substrates (e.g. glucose and acetate) and/or multiple 13C isotopomers into the metabolic modeling procedure does indeed improve the precision of the determination of metabolic fluxes [29; 30]. For example, Monte-Carlo simulations suggest that the precision and reliability of metabolic modeling are improved when using double infusion and an isotopomer model [30]. Therefore we expect that the additional information obtained from the double infusion approach presented here and concomitant in vivo detection of time courses for multiple 13C isotopomers will lead to significantly improved precision in determining metabolic fluxes.
We anticipate that these developments will benefit 13C studies in the brain in health and disease. Previous 13C double infusion studies (with acetate and glucose) have been reported in brain extracts in animal models of disease [5; 6; 7]. By comparing the concentration of 13C isotopomers in brain metabolites in a control group and in a treated group, these studies were able to determine which compartment (whether neuronal or glial) was most affected by the treatment. However such studies performed at a single time point have not allowed quantitative determination of metabolic rates. The feasibility of performing similar double infusion experiments in vivo in a dynamic manner opens new possibilities to investigate compartmentalized brain metabolism in these animal models of disease.
Conclusion
This study has shown the feasibility of measuring dynamic time courses of individual 13C isotopomers of glutamate and glutamine in rat brain in vivo during simultaneous infusion of [1,6-13C2]glucose and [1,2-13C2]acetate. We expect that dynamic metabolic modeling of these 13C time courses will lead to more precise and reliable determination of metabolic fluxes in the brain when using two-compartment neuronal-glial models.
Acknowledgments
This work was supported by NIH P41RR008079, P30NS057091, R01NS038672 (P.G.H) and the Keck Foundation. The high-resolution NMR facility at the University of Minnesota is supported with funds from the University of Minnesota Medical School, NSF (BIR-961477) and the Minnesota Medical Foundation.
References
- 1.Henry PG, Adriany G, Deelchand D, Gruetter R, Marjanska M, Oz G, Seaquist ER, Shestov A, Ugurbil K. In vivo 13C NMR spectroscopy and metabolic modeling in the brain: a practical perspective. Magn Reson Imaging. 2006;24:527–39. doi: 10.1016/j.mri.2006.01.003. [DOI] [PubMed] [Google Scholar]
- 2.Gruetter R, Adriany G, Choi IY, Henry PG, Lei H, Oz G. Localized in vivo 13C NMR spectroscopy of the brain. NMR Biomed. 2003;16:313–38. doi: 10.1002/nbm.841. [DOI] [PMC free article] [PubMed] [Google Scholar]
- 3.Taylor A, McLean M, Morris P, Bachelard H. Approaches to studies on neuronal/glial relationships by 13C-MRS analysis. Dev Neurosci. 1996;18:434–42. doi: 10.1159/000111438. [DOI] [PubMed] [Google Scholar]
- 4.Hassel B, Bachelard H, Jones P, Fonnum F, Sonnewald U. Trafficking of Amino Acids Between Neurons and Glia In Vivo. Effects of Inhibition of Glial Metabolism by Fluoroacetate. 1997;17:1230–1238. doi: 10.1097/00004647-199711000-00012. [DOI] [PubMed] [Google Scholar]
- 5.Haberg A, Qu H, Haraldseth O, Unsgard G, Sonnewald U. In vivo injection of [1-13C]glucose and [1,2-13C]acetate combined with ex vivo 13C nuclear magnetic resonance spectroscopy: a novel approach to the study of middle cerebral artery occlusion in the rat. J Cereb Blood Flow Metab. 1998;18:1223–32. doi: 10.1097/00004647-199811000-00008. [DOI] [PubMed] [Google Scholar]
- 6.Eloqayli H, Dahl CB, Gotestam KG, Unsgard G, Sonnewald U. Changes of glial-neuronal interaction and metabolism after a subconvulsive dose of pentylenetetrazole. Neurochem Int. 2004;45:739–45. doi: 10.1016/j.neuint.2004.02.002. [DOI] [PubMed] [Google Scholar]
- 7.Kondziella D, Brenner E, Eyjolfsson EM, Markinhuhta KR, Carlsson ML, Sonnewald U. Glial-neuronal interactions are impaired in the schizophrenia model of repeated MK801 exposure. Neuropsychopharmacology. 2006;31:1880–7. doi: 10.1038/sj.npp.1300993. [DOI] [PubMed] [Google Scholar]
- 8.Henry PG, Oz G, Provencher S, Gruetter R. Toward dynamic isotopomer analysis in the rat brain in vivo: automatic quantitation of 13C NMR spectra using LCModel. NMR Biomed. 2003;16:400–12. doi: 10.1002/nbm.840. [DOI] [PubMed] [Google Scholar]
- 9.Deelchand DK, Koski DM, Shestov AA, Ugurbil K, Henry PG. Acetate Utilization is Rate-Limited in the Rat Brain. Proc Intl Soc Mag Reson Med. 2007;15:717. [Google Scholar]
- 10.Henry PG, Tkac I, Gruetter R. 1H-localized broadband 13C NMR spectroscopy of the rat brain in vivo at 9.4 T. Magn Reson Med. 2003;50:684–92. doi: 10.1002/mrm.10601. [DOI] [PubMed] [Google Scholar]
- 11.Gruetter R, Tkac I. Field mapping without reference scan using asymmetric echo-planar techniques. Magn Reson Med. 2000;43:319–23. doi: 10.1002/(sici)1522-2594(200002)43:2<319::aid-mrm22>3.0.co;2-1. [DOI] [PubMed] [Google Scholar]
- 12.Rothman DL, Behar KL, Hetherington HP, Shulman RG. Homonuclear 1H double-resonance difference spectroscopy of the rat brain in vivo. Proc Natl Acad Sci USA. 1984;81:6330–6334. doi: 10.1073/pnas.81.20.6330. [DOI] [PMC free article] [PubMed] [Google Scholar]
- 13.de Graaf RA, Mason GF, Patel AB, Behar KL, Rothman DL. In vivo 1H-[13C]-NMR spectroscopy of cerebral metabolism. NMR Biomed. 2003;16:339–57. doi: 10.1002/nbm.847. [DOI] [PubMed] [Google Scholar]
- 14.de Graaf RA, Behar KL. Quantitative 1H NMR spectroscopy of blood plasma metabolites. Anal Chem. 2003;75:2100–4. doi: 10.1021/ac020782+. [DOI] [PubMed] [Google Scholar]
- 15.Valette J, Guillermier M, Besret L, Hantraye P, Bloch G, Lebon V. Isoflurane strongly affects the diffusion of intracellular metabolites, as shown by 1H nuclear magnetic resonance spectroscopy of the monkey brain. 2006;27:588–596. doi: 10.1038/sj.jcbfm.9600353. [DOI] [PubMed] [Google Scholar]
- 16.Cerdan S, Kunnecke B, Seelig J. Cerebral metabolism of [1,2-13C2]acetate as detected by in vivo and in vitro 13C NMR. J Biol Chem. 1990;265:12916–26. [PubMed] [Google Scholar]
- 17.Lebon V, Petersen KF, Cline GW, Shen J, Mason GF, Dufour S, Behar KL, Shulman GI, Rothman DL. Astroglial contribution to brain energy metabolism in humans revealed by 13C nuclear magnetic resonance spectroscopy: elucidation of the dominant pathway for neurotransmitter glutamate repletion and measurement of astrocytic oxidative metabolism. J Neurosci. 2002;22:1523–31. doi: 10.1523/JNEUROSCI.22-05-01523.2002. [DOI] [PMC free article] [PubMed] [Google Scholar]
- 18.Bluml S, Moreno-Torres A, Shic F, Nguy CH, Ross BD. Tricarboxylic acid cycle of glia in the in vivo human brain. NMR Biomed. 2002;15:1–5. doi: 10.1002/nbm.725. [DOI] [PubMed] [Google Scholar]
- 19.Mason GF, Petersen KF, Lebon V, Rothman DL, Shulman GI. Increased brain monocarboxylic acid transport and utilization in type 1 diabetes. Diabetes. 2006;55:929–34. doi: 10.2337/diabetes.55.04.06.db05-1325. [DOI] [PMC free article] [PubMed] [Google Scholar]
- 20.Yang J, Li SS, Bacher J, Shen J. Quantification of cortical GABA-glutamine cycling rate using in vivo magnetic resonance signal of [2-13C]GABA derived from glia-specific substrate [2-13C]acetate. Neurochemistry International. 2007;50:371–378. doi: 10.1016/j.neuint.2006.09.011. [DOI] [PubMed] [Google Scholar]
- 21.Sibson NR, Dhankhar A, Mason GF, Behar KL, Rothman DL, Shulman RG. In vivo 13C NMR measurements of cerebral glutamine synthesis as evidence for glutamate-glutamine cycling. Proc Natl Acad Sci U S A. 1997;94:2699–704. doi: 10.1073/pnas.94.6.2699. [DOI] [PMC free article] [PubMed] [Google Scholar]
- 22.Choi IY, Lei H, Gruetter R. Effect of deep pentobarbital anesthesia on neurotransmitter metabolism in vivo: on the correlation of total glucose consumption with glutamatergic action. J Cereb Blood Flow Metab. 2002;22:1343–51. doi: 10.1097/01.WCB.0000040945.89393.46. [DOI] [PubMed] [Google Scholar]
- 23.de Graaf RA, Mason GF, Patel AB, Rothman DL, Behar KL. Regional glucose metabolism and glutamatergic neurotransmission in rat brain in vivo. Proc Natl Acad Sci U S A. 2004;101:12700–5. doi: 10.1073/pnas.0405065101. [DOI] [PMC free article] [PubMed] [Google Scholar]
- 24.Shen J, Petersen KF, Behar KL, Brown P, Nixon TW, Mason GF, Petroff OA, Shulman GI, Shulman RG, Rothman DL. Determination of the rate of the glutamate/glutamine cycle in the human brain by in vivo 13C NMR. Proc Natl Acad Sci U S A. 1999;96:8235–40. doi: 10.1073/pnas.96.14.8235. [DOI] [PMC free article] [PubMed] [Google Scholar]
- 25.Shestov AA, Ugurbil K, Henry PG. A New Metabolic Model for Analysis of Dynamic 13C Isotopomer Time Courses in the Brain. Proc Intl Soc Mag Reson Med. 2007;15:196. [Google Scholar]
- 26.Shestov AA, Valette J, Ugurbil K, Henry PG. On the reliability of (13)C metabolic modeling with two-compartment neuronal-glial models. J Neurosci Res. 2007;85:3294–303. doi: 10.1002/jnr.21269. [DOI] [PubMed] [Google Scholar]
- 27.Jeffrey FM, Reshetov A, Storey CJ, Carvalho RA, Sherry AD, Malloy CR. Use of a single (13)C NMR resonance of glutamate for measuring oxygen consumption in tissue. Am J Physiol. 1999;277:E1111–21. doi: 10.1152/ajpendo.1999.277.6.E1111. [DOI] [PubMed] [Google Scholar]
- 28.Patel AB, de Graaf RA, Mason GF, Rothman DL, Shulman RG, Behar KL. The contribution of GABA to glutamate/glutamine cycling and energy metabolism in the rat cortex in vivo. Proc Natl Acad Sci U S A. 2005;102:5588–93. doi: 10.1073/pnas.0501703102. [DOI] [PMC free article] [PubMed] [Google Scholar]
- 29.Boumezbeur F, Petersen KF, de Graaf RA, Cline GW, Behar KL, Shulman GI, Rothman DL, Mason G. Combination of Datasets from [2-13C]Acetate and [1-13C]Glucose Experiments Improve Accuracy of Metabolic Rates Determination in Humans. Proc Intl Soc Mag Reson Med. 2008:196. [Google Scholar]
- 30.Shestov AA, Deelchand DK, Ugurbil K, Henry PG. Improving the Precision of Brain 13C Metabolic Modeling using Co-infusion of [1,2-13C2]acetate and [1,6-13C2]glucose. Proc Intl Soc Mag Reson Med. 2008;16:2335. [Google Scholar]