Abstract
Previously, we reported an in vitro cell culture model that recreates many of the hallmarks of glial scarring around electrodes used for recording in the brain; however, the model lacked the reproducibility necessary to establish a useful characterization tool. This methods paper describes a protocol, modeled on protocols typically used to culture neural stem/precursor cells, that generates a predictable positive control of an intense scarring reaction. Six independent cell culture variables (growth media, seeding density, bFGF addition day, serum concentration in treatment media, treatment day, and duration of culture) were varied systematically and the resulting scars were quantified. The following conditions were found to give the highest level of scarring: Neurobasal medium supplemented with B27, 10% fetal bovine serum at treatment, 10ng/ml b-FGF addition at seeding and at treatment, treatment at least 6 days after seeding and scar growth of at least 5 days. Seeding density did not affect scarring as long as at least 500,000 cells were seeded per well, but appropriate media, bFGF, and serum were essential for significant scar formation - insights that help validate the in vitro-based approach to understanding glial scarring. With the control protocol developed in this study producing a strong, reproducible glial scarring positive control with every dissection, this culture model is suitable for the in vitro study of the mechanisms behind glial scarring and neuroelectrode failure.
INTRODUCTION
While exciting advancements continue to be made in thought-controlled neuroprosthetics (Velliste et al., 2008), efforts to translate this technology to the clinic remain unfulfilled (Cyberkinetics, 2007). The disparity lies in the different stability and reliability requirements between the laboratory and the clinic. Excellent data can be obtained from live animal recordings for weeks and even months, but an implanted neuroelectrode array must record stable neural signals for years in paralyzed patients to warrant the cost and risk of the invasive surgery. Most neural recording arrays fail to record the adequate number of high signal to noise ratio unit potentials necessary to generate a control signal after several weeks to months (Rousche and Normann, 1998;Williams et al., 1999;Liu et al., 1999;Nicolelis et al., 2003;Schwartz, 2004). It is generally believed that a well defined, although poorly understood tissue reaction against the recording electrodes is the primary cause of the signal degradation experienced over time (Polikov et al., 2005). This tissue reaction is initiated by electrode insertion injury, which kills cells and severs vasculature, thus activating the innate inflammatory and wound healing responses of the brain. The chronic presence of a foreign object results in a well defined tissue response, termed the glial scar, mediated by microglia, astrocytes, and perhaps other cells,.
Recently, we reported an in vitro, mixed cell culture based system that reproduced characteristic hallmarks of the in vivo glial scar (Polikov et al., 2006); i.e. microglial activation and attachment to a mock stainless steel microwire electrode, and astrocyte activation beyond the microglial layer in the form of GFAP upregulation. The glial scarring model was unique in that it utilized a mixed primary culture containing neurons, astrocytes, microglia, and precursor cells, thus permitting the glia-glia and glia-neuron interactions normally present in vivo. While this model was able to re-create the glial scar, a phenomenon previously only fully observed in vivo, it was not able to do so reliably. This was in spite of tight control of all culture and dissection conditions. In order to make this in vitro glial scarring model experimentally meaningful, it was necessary to determine the culture conditions that would generate a glial scar positive control in every culture.
In this current study, the previously described “Original Protocol” was amended iteratively to increase the baseline level of scarring around microwire. After attempting a number of protocol variations, it was observed that culture conditions that mimicked protocols used for studying neural precursor cells (Kondo and Raff, 2000;Mi et al., 2001;Morrow et al., 2001;Hermanson et al., 2002;Belachew et al., 2003;Kondo and Raff, 2004;Yang et al., 2005;Liu et al., 2007) started to generate more consistent scars. The “Base Protocol” is derived from these protocols and served as the first “best guess” in the optimization process. The “Control Protocol” was achieved by systematically varying six critical parameters of the culture conditions (growth media, seeding density, day of bFGF addition, serum concentration in the treatment media, treatment day, and duration of culture). This study resulted in both the desired positive control culture conditions, as well as a deeper understanding of the requirements for glial scarring, including the requirement of serum and of neural precursor cell growth factors.
MATERIALS AND METHODS
Reagents
Cell culture ingredients were obtained from Invitrogen (Carlsbad, CA, USA). Polyclonal antibody against glial fibrillary acidic protein (GFAP) was bought from DAKO Corporation (Carpinteria, CA, USA). The Vectastain ABC kit and biotinylated secondary antibodies were purchased from Vector Laboratories (Burlingame, CA, USA). 50 μm diameter stainless steel microwire was bought from A-M Systems (Carlsborg, WA, USA). Human plasma fibronectin was bought from Millipore (Billerica, MA, USA). Basic Fibroblast Growth Factor (bFGF) was obtained from R&D Systems (Minneapolis, MN, USA).
Animals
Timed-pregnant Fisher F344 rats were obtained from Charles River Laboratories (Raleigh, NC, USA). Housing and breeding of the animals was performed in strict accordance with the National Institutes of Health guidelines at the National Institutes of Environmental Health Sciences (Research Triangle Park, NC, USA).
Primary mesencephalic neuron-glia cultures – Original Model Protocol
Neuron-glia cultures were prepared from the ventral mesencephalic tissues of embryonic day 14–15 rats, as described previously (Li et al., 2005a). Briefly, dissociated cells were seeded at 5 × 10⁵ cells/well into poly-D-lysine-coated 24-well plates. Cells were maintained at 37°C in a humidified atmosphere of 5% CO2 and 95% air, in minimal essential medium (MEM) containing 10% fetal bovine serum (FBS), 10% horse serum (HS), 1 g/L glucose, 2 mM L-glutamine, 1 mM sodium pyruvate, 100 μM nonessential amino acids, 50 U/mL penicillin, and 50 μg/mL streptomycin. Seven-day-old cultures were used for treatment after a media change to MEM containing 2% FBS, 2% HS, 2 mM L-glutamine, 1 mM sodium pyruvate, 50 U/mL penicillin, and 50 μg/mL streptomycin.
Primary mesencephalic neuron-glia cultures – Base Protocol
Neuron-glia cultures were prepared from the ventral mesencephalic tissues of embryonic day 14–15 rats, as in the Original Model Protocol. 24-well plates were coated with poly-D-lysine for one hour, washed three times, and coated with 10ug/ml fibronectin in PBS overnight. Fibronectin-PBS was removed immediately before cell plating without further washing. Dissociated cells were seeded at 1 × 10⁶ cells/well into the poly-D-lysine and fibronectin-coated 24-well plates. Cells were maintained at 37°C in a humidified atmosphere of 5% CO2 and 95% air, in Neurobasal (NB) medium supplemented with B27 serum free supplement containing 2 mM L-glutamine, 50 U/mL penicillin, and 50 μg/mL streptomycin. 10 ng/ml of bFGF was added to the cultures three days after seeding (T=3d). Ten-day-old cultures were used for treatment. Treatment consisted of placement of four microwires in each well after a media change to NB with B27, 10% FBS, 2 mM L-glutamine, 50 U/mL penicillin, and 50 μg/mL streptomycin. Cultures were fixed with 3.7% formaldehyde 7 days after treatment (T=17d). Data shown are representative of at least 3 different culture preparations.
Microwire Placement
Stainless steel microwire (50 μm diameter) was cut into 3–5 mm pieces and soaked in 70% ethanol for at least 30 minutes, after which it was allowed to dry in a laminar flow hood. At treatment time, 4 pieces of wire were placed into each treatment well at random locations using sterile forceps, so that the pieces would sink and rest atop the cultured cell layer.
Immunostaining
Astrocytes were detected with an antibody against GFAP as described previously (Polikov et al., 2006). Briefly, formaldehyde (3.7%) -fixed cultures were sequentially incubated with blocking solution (20 min), primary antibody (overnight, 4°C), biotinylated secondary antibody (1 h), and ABC reagents (1 h). Color was developed with 3,3'-diaminobenzidine.
Scarring Index
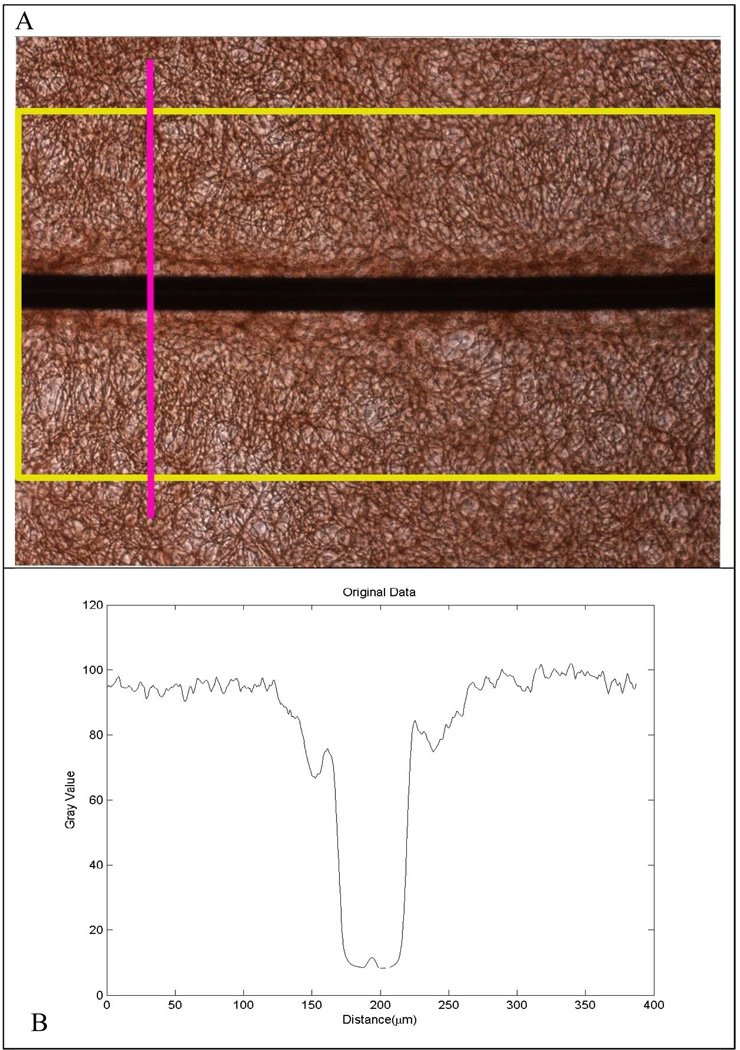
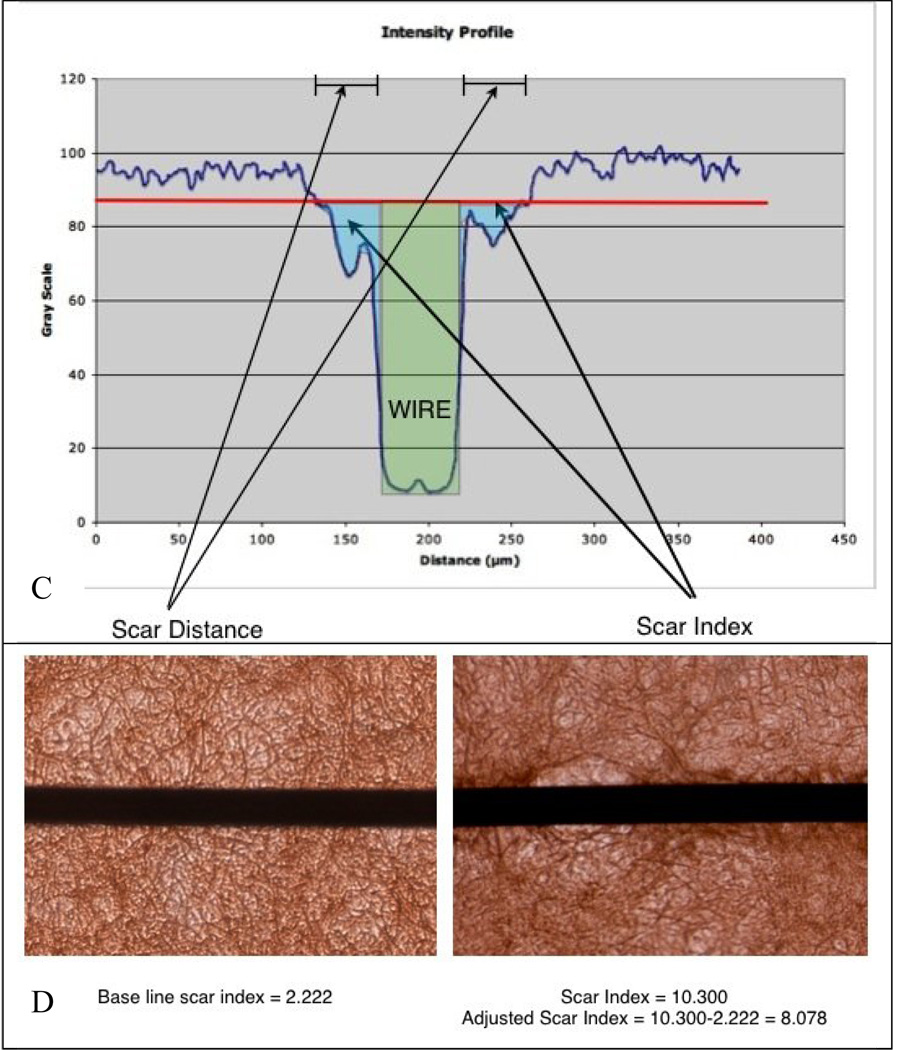
Images were recorded with a Nikon Eclipse TE2000-U inverted microscope (Nikon; Tokyo, Japan) connected to a Nikon Digital Sight DS-2MV camera (Nikon; Tokyo Japan) operated with Nikon NIS-Elements software (Nikon; Tokyo, Japan). A measure of glial scarring within each well was generated using a quantitative image analysis procedure by observers blinded to the various culture treatments. Images of GFAP staining along the entire length of each wire segment were taken using the 10X objective such that each wire segment generated 4–6 images across its length. For each image, ImageJ software (National Institutes of Health; Bethesda, Maryland) was used to register the image so that the wire was on the horizontal, and a vertical intensity profile (Figure 1a, pink line) was generated across the length of the wire within the image (Figure 1a, yellow rectangle). This resulted in a line profile along the vertical direction averaged across the entire horizontal direction so that the many variations in scarring across the wire length were averaged out and one intensity profile was generated for each wire image. The resulting intensity plot (Figure 1b) displayed the extent of GFAP staining across each image of the wire segment. The intensity plot data was imported into Matlab where a custom-built image analysis script normalized the intensity plot and identified the dark region in each image generated from the wire, the background intensity far away from the wire, and the region of the intensity profile next to the wire where there was an increase in GFAP staining due to glial scarring. The “Scar Distance” was taken to be the distance from the wire where the GFAP intensity reached 90% of background intensity. The integrated intensity from the wire to the Scar Distance was termed the Image Scar Index (Figure 1C). Each image of each wire segment generated an Image Scar Index. The 4–6 Image Scar Index values for each wire segment were averaged together to generate a Wire Scar Index, and the four Wire Scar Index values for each well (there were four wires placed in each well) generated an overall Scar Index for the well. This overall Scar Index for each well was the average of all of the scarring along all the images of all four wires in the well. There was often variation in scarring from one wire segment to another or from one end of a wire to the other end, as is always observed in vivo. This method averaged out this variation to provide one number for each experimental condition, which allows comparisons of one condition to another and highlights the power of this approach to answer scientific questions that an in vivo system cannot.
Figure 1.
A) A picture of GFAP stained culture around a microwire is rotated so the wire is on a horizontal and an intensity profile across the vertical is taken along the entire length of the wire, resulting in an intensity profile shown in B). C) The intensity profile is then imported into Matlab, where the profile is normalized, the background value is found (red marker), and the Scar Index and Scar Distance are calculated. D) To account for inaccuracies caused by shadows and the Matlab program, a baseline scar index was subtracted from calculated scar indices.
Scar Indexes from wells from at least three different dissections (on different days) generated the Scar Indexes reported in the figures. A fifth segment of microwire was added to each culture after the culture was fixed and stained (no cell interaction with microwire) to generate a baseline Scar Index value to account for shadow from the microwire and any inaccuracies introduced by the automatic detection Matlab code (Figure 1D). The Scar Index reported in Figures 3–8 has the baseline Scar Index already subtracted out.
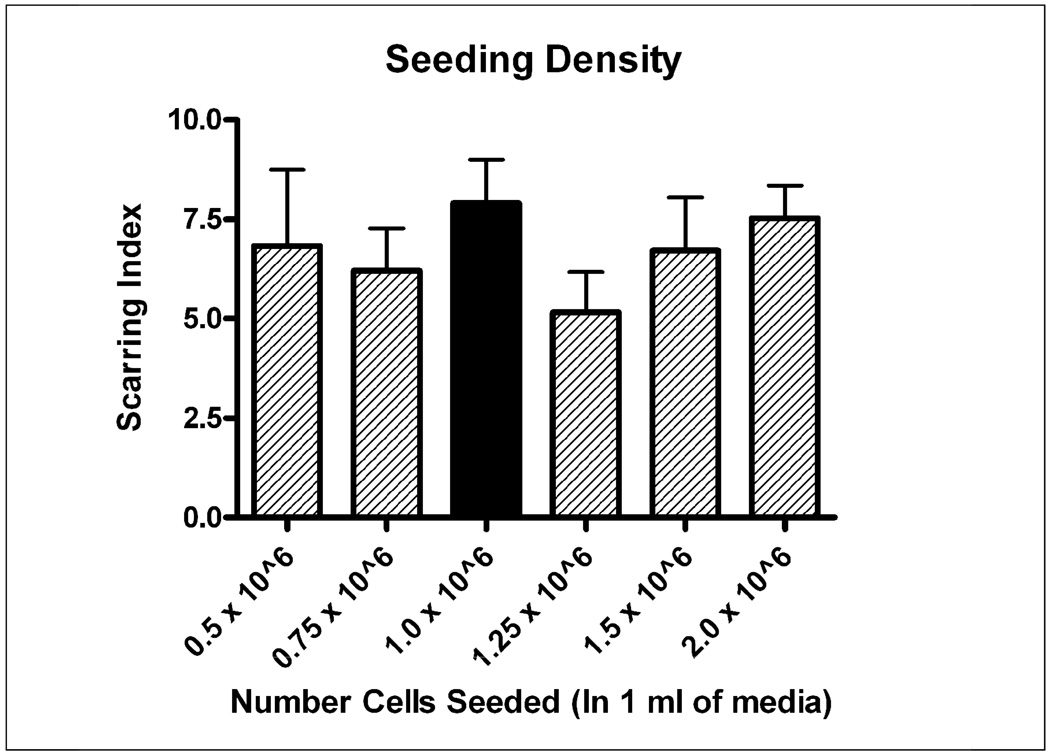
Figure 3.
Six different seeding densities were investigated with all other factors being held constant. There was no significant difference between the Base Protocol (1 million cells/well) and the lowest seeding density investigated (500,000 cells/well). Black bar indicates “Base Protocol” conditions.
Statistical Analysis
Statistical significance was determined by repeated measures analysis of variance (ANOVA) with a p<0.05 significance level and Dunnett’s or Tukey’s post-hoc tests. Analysis was performed on log-transformed data because of heterogeneous variance. The true variability between the different treatments is actually smaller than the error bars shown in the figures would suggest because of plate-to-plate and dissection-to-dissection variation, but this is accounted for by using repeated measures ANOVA. Statistical tests were conducted using the GraphPad Prism software (GraphPad Software, Inc. La Jolla, CA, USA).
RESULTS
Table 1 compares the new Base Protocol to the Original Protocol. In the Base Protocol cells were seeded in 1ml of serum-free Neurobasal (NB) media supplemented with the B27 supplement and grown (without feeding) to confluency over 10 days. On the third day, 10ng/ml bFGF was added to the culture. Media was replaced with NB+B27 medium containing 10% fetal bovine serum (FBS) and microwires are placed on top of the culture. The Base Protocol differs from the Original Protocol, which seeded cells in high serum at lower density, did not use bFGF, and maintained cells in an MEM-based media. The Base Protocol resulted in scar formation (arbitrarily defined as a scar index greater than 4, which is visually equivalent to “weak” or “minor” scarring) in 100% of the cultures tested (18/18) with a mean scar index of 7.6 +/− 0.66. Scar index measurements were not made with cultures generated through the Original Protocol (the Original Protocol was used in our previous publication, when Scar Index analysis was not performed), but the authors estimate less than 30% of cultures generated scars according to this metric. The level of consistency we had hoped to achieve (>95%) is possible through the Base Protocol, which was a “best guess” based on over 2 years of iterative changes to the Original Protocol.
Table 1.
| Procedure | Original Protocol | Base Protocol | |
|---|---|---|---|
|
Seeding Media |
Base | MEM | Neurobasal |
| Serum | 10% FBS, | - | |
| 10% Horse Serum | - | ||
| Supplements | 1 g/L glucose, | - | |
| 2 mM L-glutamine | 2 mM L-glutamine | ||
| 1 mM sodium pyruvate | - | ||
| 100 μM nonessential amino acids |
- | ||
| 50 U/mL penicillin | 50 U/mL penicillin | ||
| 50 μg/mL streptomycin | 50 μg/mL streptomycin | ||
| - | B27 | ||
|
Plate Coating |
Poly-D-Lysine | Poly-D-Lysine | |
| - | 10ug/ml Fibronectin | ||
|
Seeding Density |
1 × 10⁶ cells/ml in 0.5 ml/well | 1 × 10⁶ cells/ml in 1 ml/well | |
| Cell Feeding | Add 0.5 ml media at day 3 | - | |
| - | Add 10 ng/ml bFGF at day 3 | ||
|
Treatment Day |
Day 7 | Day 10 | |
|
Treatment Media |
Base | MEM | Neurobasal |
| Serum | 2% FBS, | 10% FBS | |
| 2% Horse Serum | - | ||
| Supplements | 2 mM L-glutamine | 2 mM L-glutamine | |
| 1 mM sodium pyruvate | - | ||
| 50 U/mL penicillin | 50 U/mL penicillin | ||
| 50 μg/mL streptomycin | 50 μg/mL streptomycin | ||
| - | B27 | ||
|
Treatment Protocol |
Change media and place microwire |
Change media and place microwire |
|
|
Culture stop day |
Day 17 (10 days after treat) | Day 17 (7 days after treat) | |
|
Frequency of scar formation |
<30% | ~100% | |
|
Typical Scar Index |
0–2 | 7–8 | |
Once this “best guess” Base protocol was established, six different culture conditions were varied independently to identify features of the culture important to scarring. The six dimensions varied were: A) growth media, B) seeding density, C) bFGF addition day, D) serum concentration in treatment media, E) treatment day, and F) duration of culture. At least three different dissections were performed for each variation in a single dimension while all other dimensions were held at Base Protocol values. In each of the following figures, the culture conditions that correspond to Base Protocol conditions are represented by solid bars.
Growth Media
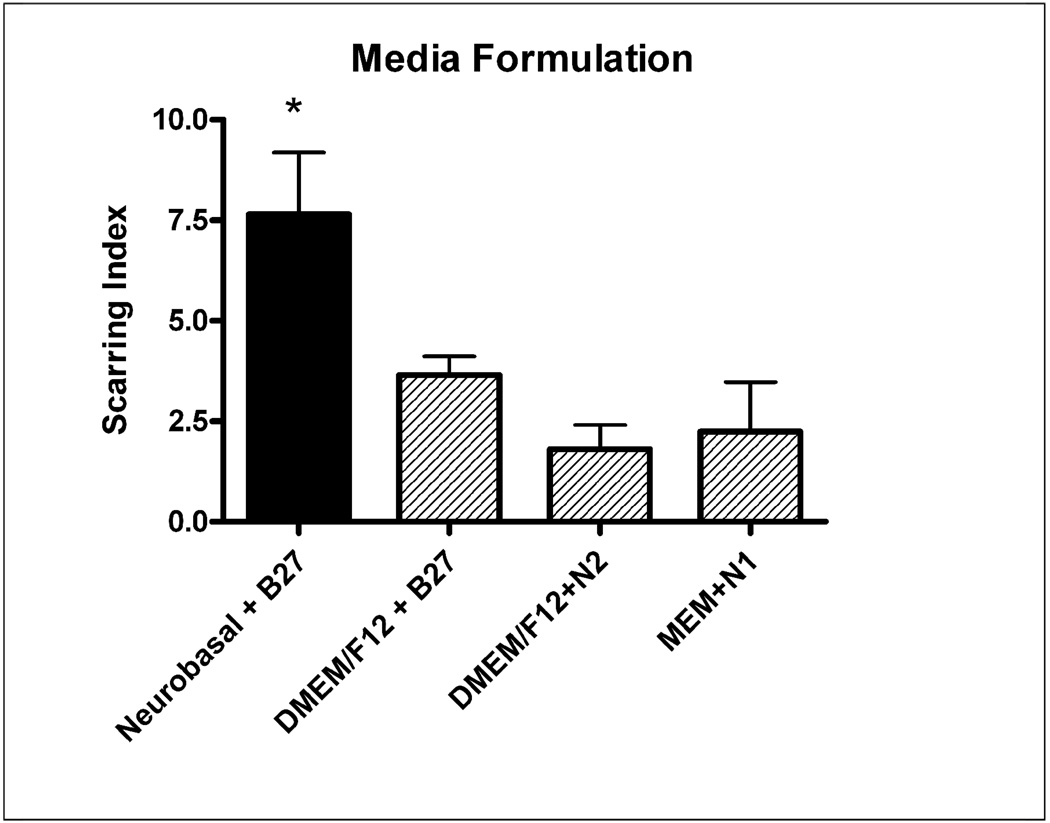
Four different kinds of growth media were investigated, made up of three types of basal media (Neurobasal, 1:1 DMEM/F12, and Minimum Essential Media (MEM)), and three types of serum free supplements (N1, N2, and B27). The four different growth media preparations were: Neurobasal + B27 (Base), DMEM/F12 + N2, DMEM/F12 + B27, and MEM+N1. Cultures were treated in the same media formulation as they were seeded, except 10% FBS was added. The Base Protocol growth media (Neurobasal+B27) generated a significantly higher scarring index (p<.05 ANOVA, P<.05 compared to DMEM/F12 + B27, and MEM+N1 according to Dunnett’s post-hoc test) among these four options (Figure 2).
Figure 2.
Four different growth media were investigated to see which one caused more consistent scarring. Neurobasal combined with B27 supplement generated significantly larger scars (p<.05) than DMEM12 + B27 and MEM+N1. Black bar indicates “Base Protocol” conditions.
Seeding Density
Six different seeding densities were investigated, ranging from 500,000 cells/well in 1 ml of media to 2 million cells per well in 1 ml. There was no significant difference among the various seeding densities, suggesting that a lower seeding density (and thus more experiments/dissection) could be utilized without a loss in scarring potential (Figure 3). Therefore, although the lowest seeding density did not result in greater scarring, it was selected for its beneficence: i.e. uses the least number of cells and therefore the smallest number of animals. Even though serum is not present during the growth phase of these cultures, bFGF acts as a strong mitogen for the cells, thus allowing smaller numbers of cells to grow to confluence over the course of the 10 day growth phase.
Day of bFGF addition
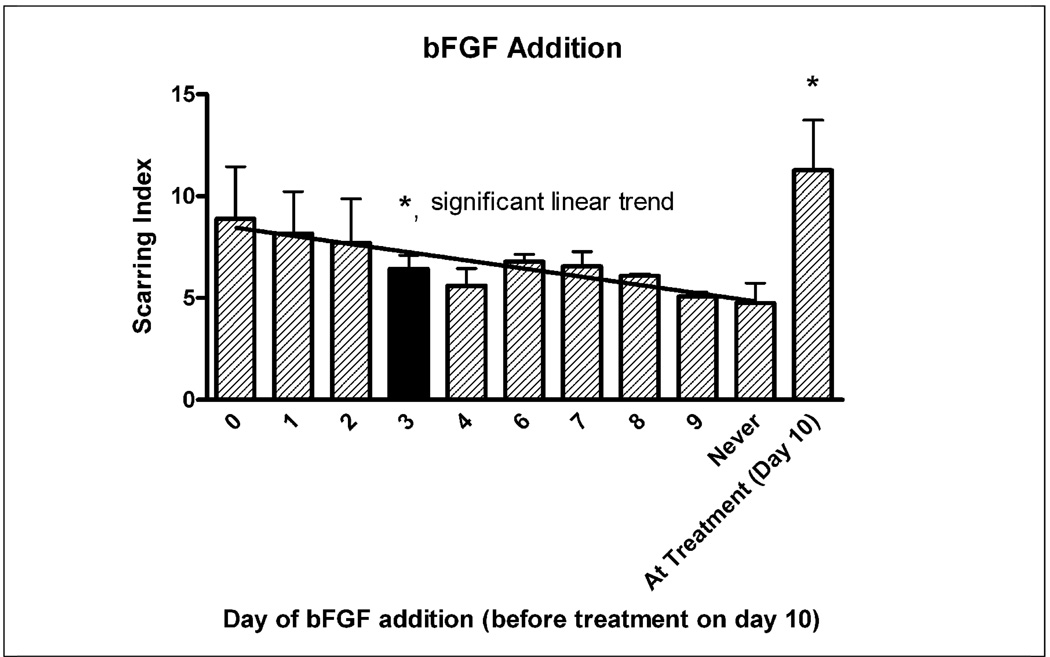
The Base Protocol involved adding 10ng/ml of bFGF, a growth factor for precursor cells, to the cultures at T=3 days. The day at which bFGF was added, as well as whether bFGF was necessary for scar formation was investigated. Figure 4 shows that not only was bFGF essential for significant scar formation, but there was a statistically significant linear correlation between the length of time bFGF was in culture and the extent of scar formation (r = .51). Since media is replaced with treatment media without bFGF at T=10 days, cultures treated with bFGF at T=9 days only experienced a benefit from bFGF for 1 day before bFGF was removed. The largest effect was when bFGF was administered at seeding time (T=0 days) or at treatment time (T=10 days). Adding bFGF at treatment time (T=10d) generated a significantly larger scar than adding bFGF before treatment (ANOVA p<0.05, Dunnett’s Post Hoc test p<0.05). This data suggests that bFGF should be administered either at seeding time or at treatment time, or perhaps at both times.
Figure 4.
bFGF was administered to the culture at different days. bFGF was necessary for optimal scar formation and the longer bFGF was present in the culture, the larger the scar (p<.05 significant linear trend, r=0.51). bFGF administration in the treatment media resulted in significantly larger scars (p<.05) compared to bFGF addition during the growth phase before treatment at T=10d. Black bar indicates “Base Protocol” conditions.
Serum concentration at treatment
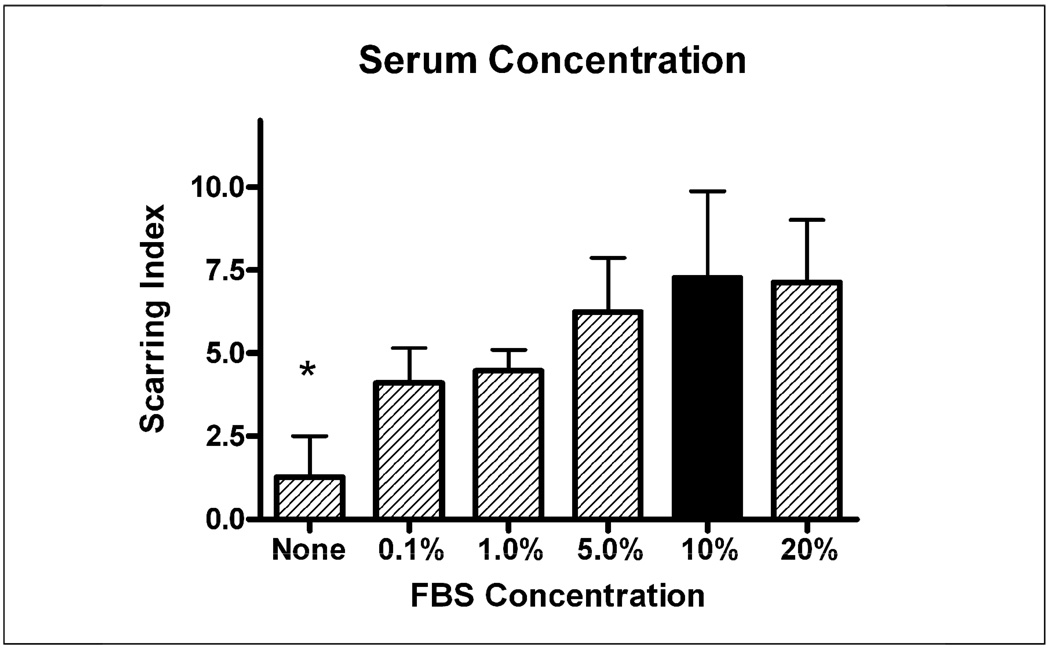
A consistent observation from the beginning of the development of this in vitro model has been that the presence of serum is necessary for scar formation. The Base Protocol involves adding 10% FBS to the culture at treatment time. This study varied serum concentration in the treatment media from 0% to 20%. Figure 5 reports that serum is indeed necessary for significant scar formation, although even small amounts of serum (0.1%) are adequate for scar formation and a plateau is reached at 5% FBS. The effect of serum on scar formation is statistically significant (ANOVA p<.05) with scars in cultures with any amount of serum significantly higher than scars in cultures with no serum (p<0.05 Tukey’s multiple comparisons post-hoc test). Surprisingly, there is no statistically significant difference between scars formed in 0.1% serum and those in 20% serum according to the post-hoc test.
Figure 5.
The requirement and optimal concentration of serum was tested in the culture. Serum was shown to be a necessary factor driving glial scar formation (p<.05 no serum condition vs. any condition with serum) but even very low amounts of serum could induce some scar formation. While there was a qualitative correlation between higher serum and greater scarring, there was no significant difference between conditions as long as some serum was present. Black bar indicates “Base Protocol” conditions.
Treatment day
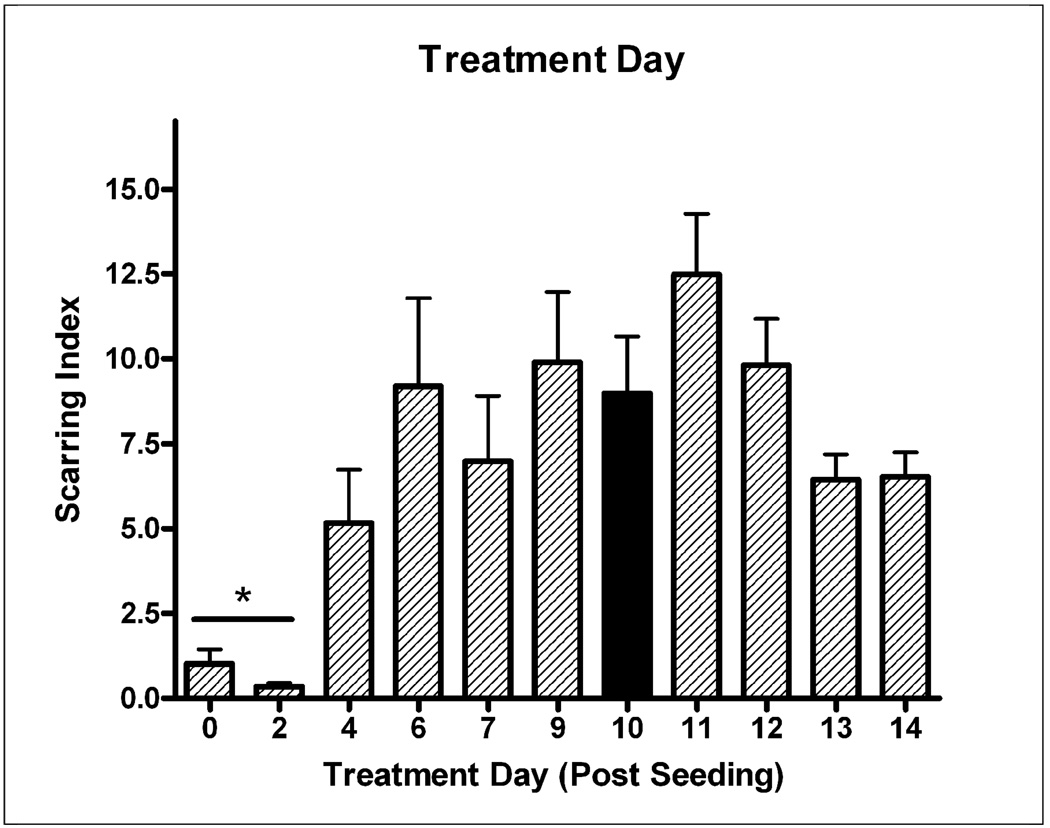
The Base Protocol involved changing of the growth media to treatment media and wire placement at T=10 days. This study aimed to find the optimal treatment day. Figure 6 shows that any day between 6 and 12 days after seeding will yield significant scarring. There was statistically higher scarring when treatment occurred after 4 days as compared to treatment at 0–2 days (ANOVA p<.05, p<0.05 Tukey’s multiple comparisons post-hoc test). Cultures treated at days 4, 13, and 14 developed smaller scars, but not to a significance level of p<0.05.
Figure 6.
The day at which growth media was replaced with treatment media and wires were placed in the culture was varied. Optimal times for treatment ranged from T=6 days to T=12 days. Treatment after at least 4 days of culture growth resulted in significantly larger scars (p<.05, T=0–2d vs. treatment any later day). Black bar indicates “Base Protocol” conditions.
Culture stop day
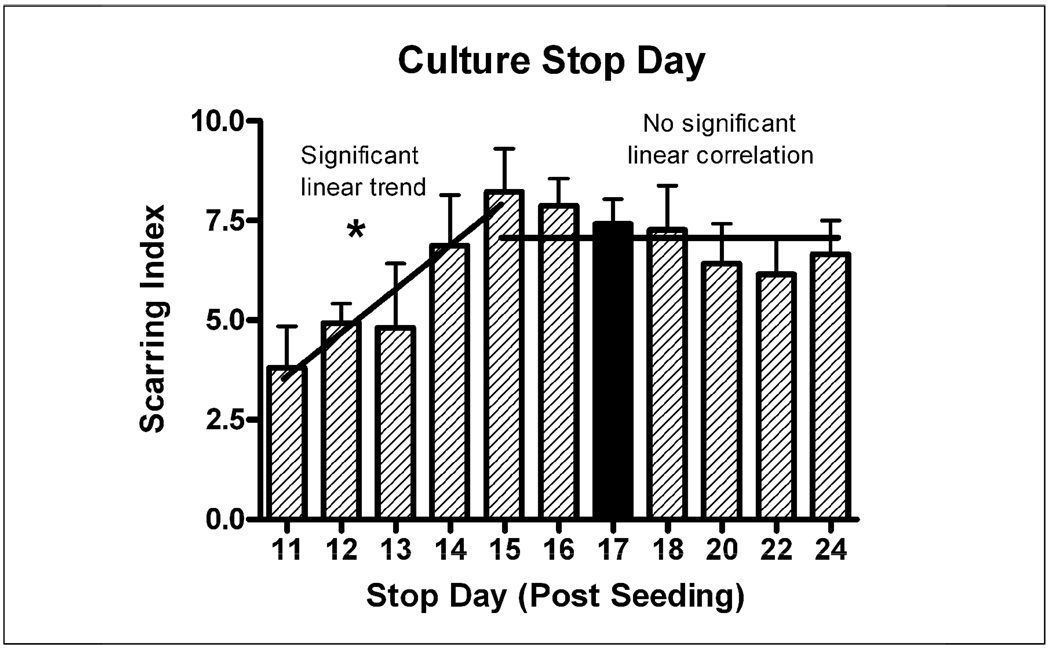
The Base Protocol involved stopping the culture at T=17 days after seeding (7 days after treatment). This study aimed to find the optimal day to stop the culture to see if taking the culture out longer would result in larger scars. Figure 7 suggests that while it takes the scar 4–5 days to mature to its optimal level, it does not grow larger once that level is reached at T=15. The scars were smaller in cultures stopped at T=11 to T = 14, where only 1–4 days were available for scar formation. These two growth phases were analyzed separately. There was a statistically significant (p<.05) increase in scarring with longer times in culture up to stop day 15 (ANOVA p<.05, r=0.72) and no significant change in scarring after day 15.
Figure 7.
The number of days the scar was allowed to grow (after treatment at T=10d) was varied by stopping the culture at different times. Between 1 and 5 days of scar growth (Stop day 11–15), scarring increased with time (r=0.72), but once an optimal scar formed at T=15 days (5 days after treatment), it did not get larger with longer time available for scar formation (no significant linear trend). Black bar indicates “Base Protocol” conditions.
DISCUSSION
Previously we showed that a well-documented embryonic neuron-glia culture system developed for studying adult Parkinson’s disease can reproduce many of the hallmarks of the glial scarring around neuroelectrode materials (Mcmillian et al., 1994;Pennypacker et al., 1996;Liu et al., 2000a;Gao et al., 2003;Qin et al., 2004;Wang et al., 2005;Polikov et al., 2006). This neuron-glia model was adopted after testing and rejecting many different culture systems -- from cell-lines to adult primary mixed-glia cultures, to brain slices -- none of which were successful in recreating the gial scar around the electrode specimen.
We hypothesized that it was the presence and interaction of all the cell types necessary for scar formation – astrocytes, microglia, neurons, and precursor cells – that finally resulted in the glial scar.
There are major deficiencies with using an in vitro model to study a process like glial scarring (embryonic cells, 2-d environment, lack of vasculature, etc), but there are also potentially large benefits over in vivo studies (strict control over environmental factors, quantifiable results, reproducibility, high throughput, mechanistic insight, etc.). To mimic the in vivo situation as closely as possible, we based our culture system on a neuron-glia neuroinflammation in vitro model developed for Parkinson’s disease, a model whose results have been validated many times through in vivo experiments (Liu et al., 2000b;Qin et al., 2004;Li et al., 2005b). However, we have not conducted any in vivo validation of the glial scarring insights presented in this paper, and therefore the conclusions derived from the system are only applicable to an in vitro environment until such in vivo validation occurs. Specifically, two commonly expressed criticisms of the model are the use of embryonic cells and the presence of serum in the medium – both of which are absolutely essential.
Although glial scarring in vivo is a phenomenon observed in adult animals, adult neurons do not survive the cell isolation process and therefore nearly all primary cultures that aim to study high density neuron-neuron and neuron-glia interactions utilize embryonic cells. The primary mesencephalic neuron-glia embryonic cell cultures described here have successfully been used to study the mechanisms involved in Parkinson’s disease, an adult disease that does not exist in embryonic animals. Also, the embryonic cells in our cultures are “aged” for 10 days before treatment and, regardless of their embryonic origin, they do form glial scars, which is what we had hoped to find.
The presence of serum in the culture medium is criticized because neurons exist beyond the blood-brain barrier. While healthy intact brain tissue lacks serum, trauma causes blood to seep into brain tissue. These authors are aware of no conditions were glial scarring forms without breaching the blood-brain barrier. As demonstrated below, serum appears to be a necessary stimulant for gliosis both in vivo and in vitro.
The objective of this study was to modify the previously published Original Protocol that yielded a robust glial scar in less than half of all culture preparations, even under rigidly controlled conditions. This partly reflects the in vivo observation that the brain’s tissue response to implanted materials is highly variable, a fact that has frustrated development of a chronically implantable recording array. Such variability, however, is poorly suited for the development of an in vitro model positive control that could be used to understand the mechanisms behind scarring around neuroelectrode materials. The Base Protocol presented here results in significant glial scarring in every culture preparation, thus allowing its use as a positive control for further investigation.
Using the Base Protocol as a starting point, the protocol was varied on six dimensions to further increase the extent of scarring, and thus possibly glean insights into glial scar formation. The Control Protocol is compared to our original “best guess” Base Protocol in Table 2 with changes highlighted.
Table 2.
| Procedure | Base Protocol | Control Protocol | |
|---|---|---|---|
| Seeding Media | Base | Neurobasal | Neurobasal |
| Serum | - | - | |
| Supplements | 2 mM L-glutamine | 2 mM L-glutamine | |
| 50 U/mL penicillin | 50 U/mL penicillin | ||
| 50 μg/mL streptomycin | 50 μg/mL streptomycin | ||
| B27 | B27 | ||
| Plate Coating | Poly-D-Lysine | Poly-D-Lysine | |
| 10ug/ml Fibronectin | 10ug/ml Fibronectin | ||
| Seeding Density | 1 × 10⁶ cells/ml in 1 ml/well |
0.5 × 10⁶ cells/ml in 1 ml/well |
|
| Cell Feeding | Add 10 ng/ml bFGF at day 3 |
Add 10 ng/ml bFGF at day 0 |
|
| Treatment Day | Day 10 |
Any day 6–12 days after seed |
|
| Treatment Media | Base | Neurobasal | Neurobasal |
| Serum | 10% FBS | 10% FBS | |
| Supplements | 2 mM L-glutamine | 2 mM L-glutamine | |
| 50 U/mL penicillin | 50 U/mL penicillin | ||
| 50 μg/mL streptomycin | 50 μg/mL streptomycin | ||
| B27 | B27 | ||
| Treatment Protocol | Change media and place microwire |
Change media and place microwire. Add 10ng/ml bFGF. |
|
| Culture stop day | Day 17 (7 days after treat) |
Any day 15–17 (at least 5 days after treat) |
|
In the process of varying culture conditions to arrive at the final Control Protocol, four important trends became apparent. First, it was clear that bFGF was a key driver of glial scar formation in our model, and the longer bFGF-containing media was available to the cells, the greater the scarring. Dozens of other factors linked to glial scar formation (i.e. TNF-αL-1β, IL-6) were added to the cultures in the search for a more robust and reproducible scar over the course of 2 years of culture development, but all had little to no effect, except bFGF.
Cultures that received no bFGF or were only exposed to bFGF for one day (as opposed to the optimal 10 days) generated significantly smaller glial scars. For example, treatment at T=0 and T=2 days rather than at T=10 days (Figure 6) produced almost no scarring, likely because treatment occurred before bFGF administration (in the Base Protocol, bFGF is administered at T=3 days in growth media, so wells treated at T=0 and T=2 days do not have bFGF added at any time). A lower Scar Index at T = 4 days was also observed, possibly since bFGF was only available in the media for one day before the media was replaced during treatment. It is also possible that treatment at T=0, T=2, and T=4 days produced less scarring because cultures were not given opportunity to grow to confluence, or because scarring is not observed in embryonic animals in vivo and the “immature” cells at the earlier treatment time points were unable to form scars. Still, it was clear that bFGF significantly enhanced glial scarring, which was at its highest level when bFGF was administered in the treatment medium (T=10 days), thus affecting cells as they were forming the scar.
The second trend observed was that the glial scar in our model takes five days to fully form. Lower scarring when the culture was treated at T=13 and T=14 days (Figure 6) can be explained by this fact as the scar may not have fully matured by the time the culture were stopped at T=17 days. The requirement of 4–5 days for scar maturity was corroborated by Figure 7, which shows the culture maturing at T=14–15 days, or 4–5 days after treatment at T=10 days. This timing is well supported by in vivo studies that have aimed at identifying the timeline of glial scar formation (Turner et al., 1999;Szarowski et al., 2003).
Third, a picture of glial scarring emerged that implicates glial precursor cells as key mediators of glial scarring, a conclusion that reinforces much of what has been presented recently in the in vivo literature. It is clear that Neurobasal medium, combined with B27 media supplement and bFGF strongly amplifies glial scar formation within the culture. A protocol that utilizes Neurobasal + B27 media with 10ng/ml bFGF added in is found in one other area in neural cell culture literature: optimized conditions for the growth and maintenance of neural stem and precursor cells (Morrow et al., 2001;Hermanson et al., 2002;Yang et al., 2005). In fact, bFGF is a necessary growth factor for the proliferation and maintenance of neural precursor cells. The data supports a conclusion that increasing neural stem/precursor cell growth results in a larger, more robust glial scar. Such a conclusion is well supported by recent reports of NG2+ oligodendrocyte precursors and other undifferentiated, multipotent cells migrating to injury sites and differentiating into scar astrocytes (Hampton et al., 2004;Alonso, 2005;Magnus et al., 2007a), a notion that is at odds with the previously established view that it is the nearby mature astrocytes that proliferate, become reactive, and form the glial scar.
Fourth, the data suggested a clear requirement for serum in glial scar formation. This requirement is corroborated by a vast array of literature that suggests gliosis is a natural brain response to any breakdown of the blood-brain-barrier that releases serum components into the normally serum-free brain parenchyma, whereas injuries that do not result in serum release do not induce significant glial scarring (Skoff, 1975;Balasingam et al., 1994;Nadal et al., 1995;Nadal et al., 1997;Raivich et al., 1999). These data suggest that even a small amount of blood-brain-barrier breakdown will initiate a glial reaction, with 0.1% serum still capable of increasing glial scarring within our culture model. Serum may also be important in stimulating the migration, proliferation, and differentiation at the site of injury. Without serum, glial precursors do not migrate to an injury site in vitro when a portion of the culture is scraped free of cells ((Polikov et al., 2006) and unpublished observations). Furthermore, serum is often used as a differentiating factor within culture models studying neural and glial precursor cells, with serum driving the differentiation into an astrocytic cell type at the expense of other neural cell fates like oligodendrocytes or even neurons (Kahn et al., 1997;Kondo and Raff, 2000;Hermann et al., 2006;Magnus et al., 2007b). The requirement of serum in glial scarring suggests neuroscientists should concentrate on leaving as much vasculature intact as possible during electrode implantation for chronic applications.
All three conditions described above: serum, appropriate stem/precursor cell media (NB+B27), and bFGF, are necessary for robust scar formation. When all three are present, the scar index is 7.6 +/− 0.66, well above 4, the index which the authors chose to signify the presence of “scarring.” When serum is taken away (Figure 5), the scar index drops to 1.3 +/− 1.2 and scarring is almost never observed. If serum and bFGF are present but NB+B27 media is replaced with another commonly used medium for neuron cell culture (DMEM/F12 + N2), the scar index drops from 7.6 to 1.8 +/− 0.6 and scarring is not observed (Figure 2). Finally, without bFGF, the scarring index drops to 4.7 +/− 1.0, and minor scarring is observed (Figure 4), but scarring is at such a low level as to be insufficient for the culture to be used as a positive control for future studies. This study points to the need for all three conditions to be present for robust scarring to occur in vitro.
CONCLUSIONS
We previously reported an in vitro model of glial scarring that allowed us to directly observe the progression of gliosis around neuroelectrode materials. Our original intent was to develop a new test for studying new electrode designs that would reduce glial scarring (Polikov et al., 2006). However, scarring in this in vitro model was highly variable (as observed in vivo) and we set about finding the culture conditions for a strong positive control that reproducibly and predictably yields a robust scarring around electrode materials. This study yielded two main findings. First from a materials testing perspective, we identified the Control Culture conditions (i.e. necessity of serum release after blood-brain-barrier breakdown, bFGF as a growth factor, neural precursor cell survival and growth essential to glial scar formation). Second, and perhaps more significantly, this is the first controlled, systematic study of the critical factors that lead to glial scarring around materials. All of the insights gained by this in vitro study are corroborated in the in vivo literature. Combined, these findings suggest that the model is not only a useful model for in vitro testing of anti-gliosis strategies, but also a useful vitro model for dissecting complicated biological phenomena involved in glial scarring.
Acknowledgements
Our sincere thanks go to Dr. Theodore Slotkin of Duke University for his help in explaining and recommending the various statistical methods used to analyze the data. Dr. Slotkin teaches a graduate seminar called Statistics for Basic Biomedical Scientists and freely and graciously provides such help to current and former students. This work was supported by NS R21NS057131.
Contributor Information
Vadim S. Polikov, Department of Biomedical Engineering, Duke University, Durham, NC 27708
Eric C. Su, Department of Biomedical Engineering, Duke University, Durham, NC 27708
Matthew A. Ball, Department of Biomedical Engineering, Duke University, Durham, NC 27708
Jau-Shyong Hong, Neuropharmacology Group, National Institute of Environmental Health Sciences (NIEHS), Research Triangle Park, North Carolina 27709.
William M. Reichert, Department of Biomedical Engineering, Box 90281, Duke University, Durham, NC 27708-0281, Office: 919-660-5151, F AX: 919-660-5362, E-mail: reichert@duke.edu.
Reference List
- 1.Alonso G. NG2 proteoglycan-expressing cells of the adult rat brain: Possible involvement in the formation of glial scar astrocytes following stab wound. Glia. 2005;49:318–338. doi: 10.1002/glia.20121. [DOI] [PubMed] [Google Scholar]
- 2.Balasingam V, Tejadaberges T, Wright E, Bouckova R, Yong VW. Reactive Astrogliosis in the Neonatal Mouse-Brain and Its Modulation by Cytokines. J.Neurosci. 1994;14:846–856. doi: 10.1523/JNEUROSCI.14-02-00846.1994. [DOI] [PMC free article] [PubMed] [Google Scholar]
- 3.Belachew S, Chittajallu R, Aguirre AA, Yuan XQ, Kirby M, Anderson S, Gallo V. Postnatal NG2 proteoglycan-expressing progenitor cells are intrinsically multipotent and generate functional neurons. J.Cell Biol. 2003;161:169–186. doi: 10.1083/jcb.200210110. [DOI] [PMC free article] [PubMed] [Google Scholar]
- 4.Cyberkinetics, Inc. Form SB2 Registration Statement. 7-3-2007. [Google Scholar]
- 5.Gao HM, Liu B, Zhang WQ, Hong JS. Critical role of microglial NADPH oxidase-derived free radicals in the in vitro MPTP model of Parkinson's disease. FASEB J. 2003;17:1954-+. doi: 10.1096/fj.03-0109fje. [DOI] [PubMed] [Google Scholar]
- 6.Hampton DW, Rhodes KE, Zhao C, Franklin RJM, Fawcett JW. The responses of oligodendrocyte precursor cells, astrocytes and microglia to a cortical stab injury, in the brain. Neuroscience. 2004;127:813–820. doi: 10.1016/j.neuroscience.2004.05.028. [DOI] [PubMed] [Google Scholar]
- 7.Hermann A, Maisel M, Wegner F, Liebau S, Kim DW, Gerlach M, Schwarz J, Kim KS, Storch A. Multipotent neural stem cells from the adult tegmentum with dopaminergic potential develop essential properties of functional neurons. Stem Cells. 2006;24:949–964. doi: 10.1634/stemcells.2005-0192. [DOI] [PubMed] [Google Scholar]
- 8.Hermanson O, Jepsen K, Rosenfeld MG. N-CoR controls differentiation of neural stem cells into astrocytes. Nature. 2002;419:934–939. doi: 10.1038/nature01156. [DOI] [PubMed] [Google Scholar]
- 9.Kahn MA, Huang CJ, Caruso A, Barresi V, Nazarian R, Condorelli DF, Devellis J. Ciliary neurotrophic factor activates JAK/Stat signal transduction cascade and induces transcriptional expression of glial fibrillary acidic protein in glial cells. J.Neurochem. 1997;68:1413–1423. doi: 10.1046/j.1471-4159.1997.68041413.x. [DOI] [PubMed] [Google Scholar]
- 10.Kondo T, Raff M. Oligodendrocyte precursor cells reprogrammed to become multipotential CNS stem cells. Science. 2000;289:1754–1757. doi: 10.1126/science.289.5485.1754. [DOI] [PubMed] [Google Scholar]
- 11.Kondo T, Raff M. Chromatin remodeling and histone modification in the conversion of oligodendrocyte precursors to neural stem cells. Genes & Development. 2004;18:2963–2972. doi: 10.1101/gad.309404. [DOI] [PMC free article] [PubMed] [Google Scholar]
- 12.Li GR, Cui G, Tzeng NS, Wei SJ, Wang TG, Block ML, Hong JS. Femtomolar concentrations of dextromethorphan protect mesencephalic dopaminergic neurons from inflammatory damage. FASEB J. 2005a;19:489–496. doi: 10.1096/fj.04-2555com. [DOI] [PubMed] [Google Scholar]
- 13.Li GR, Liu YX, Tzeng NS, Cui G, Block ML, Wilson B, Qin LY, Wang TG, Liu B, Liu J, Hong JS. Protective effect of dextromethorphan against endotoxic shock in mice. Biochem.Pharmacol. 2005b;69:233–240. doi: 10.1016/j.bcp.2004.10.003. [DOI] [PubMed] [Google Scholar]
- 14.Liu AX, Han YR, Li JD, Sun DM, Ouyang M, Plummer MR, Casaccia-Bonnefil P. The glial or neuronal fate choice of oligodendrocyte progenitors is modulated by their ability to acquire an epigenetic memory. J.Neurosci. 2007;27:7339–7343. doi: 10.1523/JNEUROSCI.1226-07.2007. [DOI] [PMC free article] [PubMed] [Google Scholar]
- 15.Liu B, Du LN, Hong JS. Naloxone protects rat dopaminergic neurons against inflammatory damage through inhibition of microglia activation and superoxide generation. J.Pharmacol.Exp.Ther. 2000a;293:607–617. [PubMed] [Google Scholar]
- 16.Liu B, Jiang JW, Wilson BC, Du L, Yang SN, Wang JY, Wu GC, Cao XD, Hong JS. Systemic infusion of naloxone reduces degeneration of rat substantia nigral dopaminergic neurons induced by intranigral injection of lipopolysaccharide. J.Pharmacol.Exp.Ther. 2000b;295:125–132. [PubMed] [Google Scholar]
- 17.Liu X, McCreery DB, Carter RR, Bullara LA, Yuen TGH, Agnew WF. Stability of the Interface Between Neural Tissue and Chronically Implanted Intracortical Microelectrodes. IEEE Trans.Rehabil.Eng. 1999;7:315–326. doi: 10.1109/86.788468. [DOI] [PubMed] [Google Scholar]
- 18.Magnus T, Coksaygan T, Korn T, Xue HP, Arumugam TV, Mughal MR, Eckley DM, Tang SC, DeTolla L, Rao MS, Cassiani-Ingoni R, Mattson MP. Evidence that nucleocytoplasmic Olig2 translocation mediates brain-injury-induced differentiation of glial precursors to astrocytes. J.Neurosci.Res. 2007a;85:2126–2137. doi: 10.1002/jnr.21368. [DOI] [PubMed] [Google Scholar]
- 19.Magnus T, Coksaygan T, Korn T, Xue HP, Arumugam TV, Mughal MR, Eckley DM, Tang SC, DeTolla L, Rao MS, Cassiani-Ingoni R, Mattson MP. Evidence that nucleocytoplasmic Olig2 translocation mediates brain-injury-induced differentiation of glial precursors to astrocytes. J.Neurosci.Res. 2007b;85:2126–2137. doi: 10.1002/jnr.21368. [DOI] [PubMed] [Google Scholar]
- 20.Mcmillian MK, Thai L, Hong JS, Ocallaghan JP, Pennypacker KR. Brain Injury in A Dish - A Model for Reactive Gliosis. Trends Neurosci. 1994;17:138–142. doi: 10.1016/0166-2236(94)90086-8. [DOI] [PubMed] [Google Scholar]
- 21.Mi HY, Haeberle H, Barres BA. Induction of astrocyte differentiation by endothelial cells. J.Neurosci. 2001;21:1538–1547. doi: 10.1523/JNEUROSCI.21-05-01538.2001. [DOI] [PMC free article] [PubMed] [Google Scholar]
- 22.Morrow T, Song MR, Ghosh A. Sequential specification of neurons and glia by developmentally regulated extracellular factors. Development. 2001;128:3585–3594. doi: 10.1242/dev.128.18.3585. [DOI] [PubMed] [Google Scholar]
- 23.Nadal A, Fuentes E, Pastor J, McNaughton PA. Plasma-Albumin Is A Potent Trigger of Calcium Signals and Dna-Synthesis in Astrocytes. Proc.Natl.Acad.Sci.U.S.A. 1995;92:1426–1430. doi: 10.1073/pnas.92.5.1426. [DOI] [PMC free article] [PubMed] [Google Scholar]
- 24.Nadal A, Fuentes E, Pastor J, McNaughton PA. Plasma albumin induces calcium waves in rat cortical astrocytes. Glia. 1997;19:343–351. doi: 10.1002/(sici)1098-1136(199704)19:4<343::aid-glia7>3.0.co;2-y. [DOI] [PubMed] [Google Scholar]
- 25.Nicolelis MAL, Dimitrov D, Carmena JM, Crist R, Lehew G, Kralik JD, Wise SP. Chronic, multisite, multielectrode recordings in macaque monkeys. Proc.Natl.Acad.Sci.U.S.A. 2003;100:11041–11046. doi: 10.1073/pnas.1934665100. [DOI] [PMC free article] [PubMed] [Google Scholar]
- 26.Pennypacker KR, Hong JS, Mullis SB, Hudson PM, Mcmillian MK. Transcription factors in primary glial cultures: Changes with neuronal interactions. Mol.Brain Res. 1996;37:224–230. doi: 10.1016/0169-328x(95)00318-m. [DOI] [PubMed] [Google Scholar]
- 27.Polikov VS, Block ML, Fellous JM, Hong JS, Reichert WM. In vitro model of glial scarring around neuroelectrodes chronically implanted in the CNS. Biomaterials. 2006;27:5368–5376. doi: 10.1016/j.biomaterials.2006.06.018. [DOI] [PubMed] [Google Scholar]
- 28.Polikov VS, Tresco PA, Reichert WM. Response of brain tissue to chronically implanted neural electrodes. J.Neurosci.Methods. 2005;148:1–18. doi: 10.1016/j.jneumeth.2005.08.015. [DOI] [PubMed] [Google Scholar]
- 29.Qin LY, Liu YX, Wang TG, Wei SJ, Block ML, Wilson B, Liu B, Hong JS. NADPH oxidase mediates lipopolysaccharide-induced neurotoxicity and proinflammatory gene expression in activated microglia. J.Biol.Chem. 2004;279:1415–1421. doi: 10.1074/jbc.M307657200. [DOI] [PubMed] [Google Scholar]
- 30.Raivich G, Bohatschek M, Kloss CUA, Werner A, Jones LL, Kreutzberg GW. Neuroglial activation repertoire in the injured brain: graded response, molecular mechanisms and cues to physiological function. Brain Research Reviews. 1999;30:77–105. doi: 10.1016/s0165-0173(99)00007-7. [DOI] [PubMed] [Google Scholar]
- 31.Rousche PJ, Normann RA. Chronic recording capability of the Utah Intracortical Electrode Array in cat sensory cortex. J.Neurosci.Methods. 1998;82:1–15. doi: 10.1016/s0165-0270(98)00031-4. [DOI] [PubMed] [Google Scholar]
- 32.Schwartz AB. Cortical neural prosthetics. Neurosci. 2004;27:487–507. doi: 10.1146/annurev.neuro.27.070203.144233. [DOI] [PubMed] [Google Scholar]
- 33.Skoff RP. RP. Fine-Structure of Pulse Labeled (H-3-Thymidine Cells) in Degenerating Rat Optic-Nerve. J.Comp.Neurol. 1975;161:595–611. doi: 10.1002/cne.901610408. [DOI] [PubMed] [Google Scholar]
- 34.Szarowski DH, Andersen MD, Retterer S, Spence AJ, Spence M, Craighead HG, Turner JN, Shain W. Brain responses to micro-machined silicon devices. Brain Res. 2003;983:23–35. doi: 10.1016/s0006-8993(03)03023-3. [DOI] [PubMed] [Google Scholar]
- 35.Turner JN, Shain W, Szarowski DH, Andersen M, Martins S, Isaacson M, Craighead H. Cerebral astrocyte response to micromachined silicon implants. Exp.Neurol. 1999;156:33–49. doi: 10.1006/exnr.1998.6983. [DOI] [PubMed] [Google Scholar]
- 36.Velliste M, Perel S, Spalding MC, Whitford AS, Schwartz AB. Cortical control of a prosthetic arm for self-feeding. Nature. 2008;453:1098–1101. doi: 10.1038/nature06996. [DOI] [PubMed] [Google Scholar]
- 37.Wang TG, Pei Z, Zhang W, Liu B, Langenbach R, Lee C, Wilson B, Reece JM, Miller DS, Hong JS. MPP+-induced COX-2 activation and subsequent dopaminergic neurodegeneration. FASEB J. 2005;19 doi: 10.1096/fj.04-2457fje. [DOI] [PubMed] [Google Scholar]
- 38.Williams JC, Rennaker RL, Kipke DR. Long-term neural recording characteristics of wire microelectrode arrays implanted in cerebral cortex. Brain Research Protocols. 1999;4:303–313. doi: 10.1016/s1385-299x(99)00034-3. [DOI] [PubMed] [Google Scholar]
- 39.Yang ZS, Watanabe M, Nishiyama A. Optimization of oligodendrocyte progenitor cell culture method for enhanced survival. J.Neurosci.Methods. 2005;149:50–56. doi: 10.1016/j.jneumeth.2005.05.003. [DOI] [PubMed] [Google Scholar]


