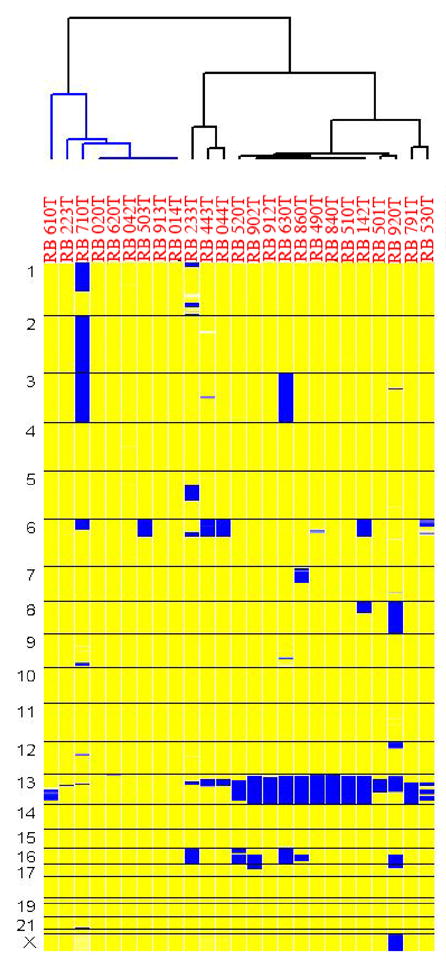
Figure 1.

This picture describes the clustering of 25 RB tumor samples based on their whole genome loss of heterozygosity (LOH) profile. Each column represents a matched normal/tumor pair and each horizontal block indicates a chromosome. The yellow regions indicate retention of heterozygosity (ROH) and blue regions indicate LOH.
