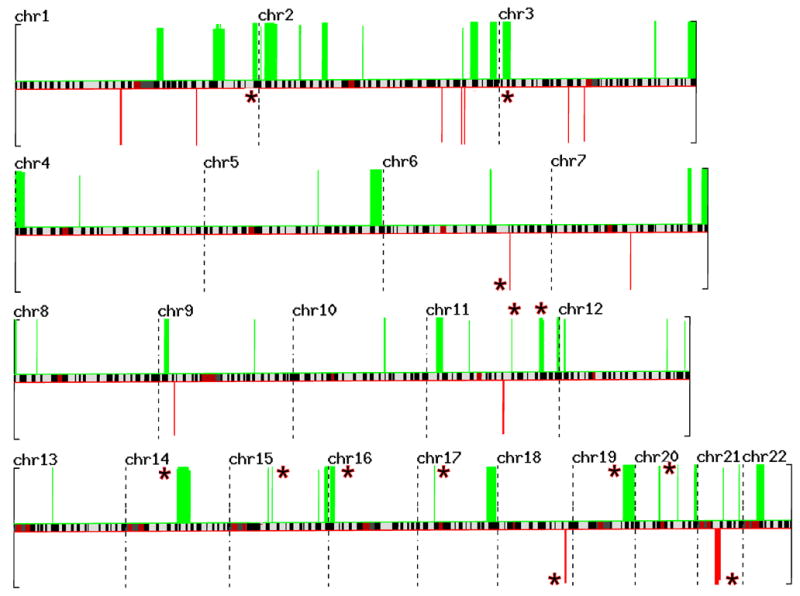
Figure 4.

This figure represents the STAC output for the whole genome displayed across individual chromosomes– the green bars indicate gains and red bars indicate losses. Each bar represents an aberration that has a p-value less than 0.05. The red asterisks indicate 13 novel regions identified in this analysis.
