

Abstract
The value of reversed-phase high-performance liquid chromatography (RP-HPLC) and the field of proteomics would be greatly enhanced by accurate prediction of retention times of peptides of known composition. The present study investigates the hydrophilicity/hydrophobicity of amino acid side-chains at the N- and C-termini of peptides while varying the functional end-groups at the termini. We substituted all 20 naturally occurring amino acids at the N- and C-termini of a model peptide sequence, where the functional end-groups were Nα-acetyl-X- and Nα-amino-X- at the N-terminus and –X-Cα-carboxyl and -X-Cα-amide at the C-terminus. Amino acid coefficients were subsequently derived from the RP-HPLC retention behaviour of these peptides and compared to each other as well as to coefficients determined in the centre of the peptide chain (internal coefficients). Coefficients generated from residues substituted at the C-terminus differed most (> 2.5 min between the –X-Cα-carboxyl and -X-Cα-amide peptide series) for hydrophobic side-chains. A similar result was seen for the Nα-acetyl-X- and Nα-amino-X- peptide series, where the largest differences in coefficient values (> 2 min) were observed for hydrophobic peptides. Coefficients derived from substitutions at the C-terminus for hydrophobic amino acids were dramatically different compared to internal coefficients for hydrophobic side-chains, ranging from 17.1 min for Trp to 4.8 min for Cys. In contrast, coefficients derived from substitutions at the N-terminus showed relatively small differences from the internal coefficients. Subsequent prediction of peptide retention time, within an error of just 0.4 min, was achieved by a predictive algorithm using a combination of internal coefficients and a weighted coefficient for the C-terminal residue.
1. Introduction
The ability to predict the retention times of peptides of known composition would greatly enhance the value of reversed-phase high-performance liquid chromatography (RP-HPLC), particularly in the field of proteomics. As noted by Petritis et al [1], an aspect of proteomic analysis that has not been hitherto well exploited involves use of the information available from peptide retention times during liquid chromatography, specifically RP-HPLC. The authors noted that if there was a way to predict the retention time for a given peptide, this information could then be used in conjunction with MS/MS data to improve the confidence of peptide identifications. At present, however, prediction of peptide retention behaviour during RP-HPLC is not accurate enough to be used reliably for such a purpose.
Accurate prediction of peptide retention behaviour during RP-HPLC represents a considerable challenge since peptides derived from various sources differ widely in size, amino acid composition and relative hydrophilicity/hydrophobicity. Factors which clearly affect the retention behaviour of peptides in RP-HPLC include (i) amino acid composition, (ii) peptide chain length and (iii) sequence-dependent effects.
(i) Amino acid composition
It has been recognized for more than 20 years that, unless a peptide is subject to conformational restraints, its chromatographic behaviour in RP-HPLC can be correlated with its amino acid composition. RP-HPLC has frequently been employed to generate amino acid side-chain hydrophilicity/hydrophobicity scales (or “coefficients”) from peptides [2]. Initially, this approach involved assignment of hydrophilicity/hydrophobicity values of amino acid side-chains through regression analysis of the RP-HPLC retention times of a random collection of peptides of varied composition and length [3–12]. More recent work has included a quantitative structure-retention relationship (QSRR) approach, taking into account additional factors (peptide Van der Waals volume, theoretical n-octanol/water partition coefficient) to that of overall peptide hydrophobicity (as expressed by RP-HPLC retention time), albeit this predictive model still relies on multiple regression analysis of random peptides [13, 14]. Another interesting recent approach to prediction of peptide retention behaviour during RP-HPLC is based on artificial neural networks (ANN) [1], such a model also being based on the premise that peptide elution times should substantially depend on amino acid composition. This model was also developed (or “trained”) from a data set of random peptides, albeit a very large number (~7,000 peptides) obtained from enzymatic digestion of proteome-wide proteins.
In 1986, we used a more precise method for determining the contribution of individual amino acid residues to RP-HPLC retention behaviour by measuring the effect of all 20 amino acids found in proteins by their substitution into a model synthetic peptide: Ac-Gly-X-X-(Leu)3-(Lys)2-amide [15]. We believed that such an approach eliminates concerns such as the relative frequency with which a particular amino acid appears compared to others in a random collection of peptides. In addition, empirical approaches are always dependent on the sample, whereas a synthetic peptide approach can unravel the parameters and their magnitude. Amino acid coefficients generated from observed RP-HPLC retention times of these peptides were subsequently shown to have good correlation of predicted versus observed retention times (correlation coefficient of 0.98) for a wide range of peptides of varying size (2–16 residues) and composition. Interestingly, the hydrophilicity/hydrophobicity coefficients generated from the aforementioned ANN approach [1] showed good agreement in terms of a similar ordering of coefficients (most hydrophobic to most hydrophilic) to that of our synthetic model peptide approach, albeit relative values between different amino acids frequently varied significantly.
(ii) Polypeptide chain length
A number of researchers have reported that peptides larger than 15–20 residues were eluted more rapidly than predicted from a simple summation of side-chain hydrophilicity/hydrophobicity coefficients [6, 8, 16–19]. Such non-ideal behaviour was generally assumed to be due to stabilized higher orders of polypeptide structure (secondary, tertiary) which may remove certain amino acid residues from contact with the hydrophobic stationary phase. However, Mant et al [20] demonstrated that there was a polypeptide chain length effect on retention behaviour of peptides independent of any conformational considerations. This chain length effect was subsequently successfully factored into prediction of peptide retention times based on the Guo et al [15] coefficients. In addition, these same coefficients were used to demonstrate that it was possible to predict relative elution order of proteins during RP-HPLC, once polypeptide chain length was taken into consideration [21]. These authors clearly demonstrated the important point that for prediction of relative elution order of proteins, the proteins must possess no tertiary or quaternary structure (i.e., denatured/unfolded). Such disruption of protein structure is generally assured by conditions characteristic of RP-HPLC, i.e., very hydrophobic stationary phase (containing n-alkyl ligands such as C8 or C18; high ligand density), the organic solvent acetonitrile in the mobile phase and, frequently, a low mobile phase pH (pH 2) [21–23].
(iii) Sequence dependent effects
In an earlier paper [24], we suggested that sequence-dependent effects can be divided into two categories: conformational effects and nearest-neighbour effects. Our definition of the former was that an apparent reduction or enhancement of the apparent hydrophobicity of a peptide (as expressed by its RP-HPLC retention time) as a result of the peptide adopting a unique conformation on interacting with the hydrophobic stationary phase, compared to its apparent hydrophobicity if it existed as a random coil, i.e., lacking an unique conformation.
Concerning conformational effects, specifically secondary structure effects, it is well known that the hydrophobic environment of RP-HPLC, although it disrupts tertiary and quaternary structure, will induce and stabilize any potential α-helical structure of a polypeptide chain [24–27]. Thus, if a molecule becomes helical on binding and contains a preferred binding domain (i.e., the non-polar face of an amphipathic α-helix), the binding of this domain to the hydrophobic stationary phase will be greater than if it were binding as a random coil or as a non-amphipathic α-helix [24, 28], showing significant deviation from expected retention behaviour based on amino acid composition alone. Significant differences in retention time between α-helical peptides of the same composition but different sequence (SCDS) were also demonstrated by Houghten’s group [29, 30]. Such induction of α-helix structure during RP-HPLC may be significant when one considers that ~50% of all α-helices in proteins are amphipathic [31]. Fortunately, from the perspective of prediction in proteomics, proteolytic (e.g., tryptic) digests of protein mixtures generally produce a vast majority of only small peptides, where induction of any secondary structure is unlikely and, indeed, where peptide chain length is also not a factor. In fact, a theoretical digest by our laboratory of the Escherichia coli proteome showed that for peptide fragments in the workable range for accurate mass spectrometry (MS) measurement (5–40 residues), 83% are 20 or fewer residues in length. Thus, the likelihood of tryptic cleavage not occurring within α-helical segments found in proteins is small, fortifying the expectation that the vast majority of peptides will not have any defined structure during RP-HPLC.
Concerning nearest-neighbour effects, it has been suggested that the cumulative effects of many local side-chain backbone interactions between each amino acid and its immediate neighbours may severely restrict the conformations accessible to a polypeptide chain [32,33]. Thus, nearest-neighbour effects during RP-HPLC imply sequence-dependent variability of peptide retention behaviour but independent of a defined secondary structure (β-turn, β-sheet or α-helical). Attempts to quantify such nearest-neighbour effects have been rare, although our laboratory has made a recent initial quantification of such effects by observation of the differences in observed retention times of L- and D-peptide diastereomers, where the model peptides varied only in the L- or D- amino acid substituted adjacent to a bulky leucine residue [34]. In addition, we have also developed a set of intrinsic hydrophilicity/hydrophobicity coefficients based on our model peptide approach where amino acid substitutions were made at the N-terminal end of the model peptide adjacent to a glycine residue, ensuring the complete absence of any conformational restraints on the substituted amino acid [35]. However, sequence-dependent effects, especially nearest-neighbour interactions, clearly have to be taken into account if we wish ultimately to predict peptide retention times accurately. Most recently, Krokhin et al [36,37] developed a predictive algorithm from the coefficients of Guo et al [15] and observed deviations from this model when predicting the retention times of 346 tryptic peptides in the 560 to 4,000-Da mass range from a mixture of 17 protein digests. These authors noted that their predictions could be improved if adjustments were made to the coefficients of the N-terminal residues (containing a free N-terminal amino group), together with weighted coefficients reflecting the influence of distance from the N-terminus. The conclusion of these authors was that the coefficients of amino acids at the N-terminus of a peptide may be significantly different from those located in the interior of the peptide sequence. Hence, they suggested that a set of terminal end group coefficients (C-terminal as well as N-terminal) would be required for improvement of prediction of peptide retention times during RP-HPLC.
In the present study, we therefore decided to investigate the hydrophilicity/hydrophobicity of side-chains at the N- and C-termini of peptides while varying the functional end-groups at the termini. That is, we would substitute all 20 naturally occurring amino acids at the termini where the functional end-groups were Nα-acetyl-X- and Nα-amino-X- at the N-terminus and –X-Cα-carboxyl and –X-Cα-amide at the C-terminus. In this way we would be able to determine the amino acid coefficients at these positions and compare them to each other and to side-chain coefficients determined in the centre of the peptide chain (internal coefficients) with the objective that the use of N-terminal, C-terminal and internal coefficients would improve peptide retention time predictions.
2. Materials and Methods
2.1. Materials
Trifluoroacetic acid (TFA) was obtained from Hydrocarbon Products (River Edge, NJ, USA); HPLC-grade acetonitrile was obtained from Fisher Scientific (Pittsburgh, PA, USA); fluoroenyloxymethylcarbonyl (Fmoc) amino acids, Wang resin (100–200 mesh) and Rink Amide MBHA (methoxybenzhydrylamine) resin (100–200 mesh) were obtained from Novabiochem (San Diego, CA, USA). De-ionized water was purified by an E-pure water filtration device from Barnstead/Thermolyne (Dubuque, IA, USA).
2.2. Instrumentation
RP-HPLC runs were carried out on an Agilent 1100 series liquid chromatography system from Agilent Technologies (Little Falls, DE, USA), containing an autosampler with a loop size of 250 μl.
2.3. Column
RP-HPLC runs were carried out on a Kromasil C18 column (150 mm × 2.1 mm internal diameter, 5 μm particle size; 100 Å pore size) from Hichrom (Berkshire, UK).
2.4. Peptide synthesis
Peptide synthesis was carried out by solid-phase synthesis methodology using conventional Fmoc chemistry with diisopropylcarbodiimide (DIC) activation. Elongation of the peptide chains was carried out in polypropylene reaction vessels. The side-chain protecting groups used were: Arg (Pbf), Lys (Boc), Trp (Boc), Asn (Trt), Cys (Trt), His (Trt), Asp (OBut), Glu (OBut), Ser (But), Thr (But) and Tyr (But), where Pbf denotes 2,2,4,6,7-pentamethyldihydrobenzofuran-5-sulfonyl, Boc denotes tertiary-butyloxycarbonyl, Trt denotes trityl, OBut denotes butoxy and But denotes butyl. Following addition of the final amino acid, the peptides were either N-terminally acetylated using acetic anhydride or left with a free amino terminus. Most peptides were cleaved from the resin using 95% TFA, 2.5% water and 2.5% triisopropylsilane (TIS) for 120 min at room temperature. Peptides containing Met were cleaved using 95% TFA, 2.5% TIS and 2.5% methyl sulfide, while peptides containing Cys were cleaved using 94.5% TFA, 1.5% TIS, 1.5% water and 1.5% ethanedithiol (EDT). Crude peptides were washed from the resin with neat TFA and precipitated with cold diethylether. Crude peptides were then dissolved in neat acetic acid or 50% (v/v) aqueous acetonitrile and lyophilized.
2.5. Purification of crude peptides
Crude peptides were purified by RP-HPLC on a Zorbax 300SB-C8 (250 mm × 4.6 mm I.D.) column from Agilent using a linear AB gradient (0.25 – 0.5% B/min) at a flow-rate of 1 ml/min, where eluent A is 0.2% aq. TFA and eluent B is 0.2% TFA in acetonitrile. The correct masses of the peptides were confirmed by electrospray mass spectrometry using a Mariner Biospectrometry Workstation mass spectrometer (PerSeptive Biosystems, Framingham, MA, USA).
2.6. Analytical RP-HPLC of model peptides
Model peptides were eluted from the Kromasil column using a linear AB gradient (0.25% B/min) at a flow-rate of 0.3 ml/min and a temperature of 25 °C, where eluent A was 20 mM aq. TFA containing 2 % (v/v) acetonitrile and eluent B was 20 mM TFA in acetonitrile. Sample loads were adjusted to produce peak heights of ~ 100 mAU for each peptide at a detection wavelength of 210 nm.
2.7. Prediction of peptide retention time
The predicted retention time (τ) was determined by the sum of the retention coefficients shown in Table 3 plus the value tg, where tg = td + to. The time for the gradient to reach the top of the column from the proportioning valve via the pump, solvent mixer and injection loop is the gradient delay time (td). The time for the gradient to reach the detector (tg) is the gradient delay to the column top plus to, the time for an unretained peak to be eluted. In this study td = 4.5 min and to = 1.2 min for a value of tg = 5.7 min. The value for td is determined by running a linear AB gradient at 0.25% acetonitrile/min, where eluent A is 20 mM aq. TFA and eluent B is 20 mM TFA in acetonitrile, containing 1% acetone. The elution profile is monitored at 270 nm to detect the beginning of the linear increase in acetone absorbance in the absence of the column. Since only a single column was used in this study with the same solvents for elution of all peptides, the same instrument and the same conditions for chromatography, no other correction was used. See Guo et al, (15,38) for prediction of peptide retention time using a time correction for a peptide standard which allows the researcher to use any HPLC apparatus, reversed-phase columns of any length or diameter and reversed-phase packings of any n-alkylchain length and ligand density.
Table 3.
Comparison of N-terminal (Nα-acetyl and Nα-amino), and C-terminal (Cα-carboxyl, Cα-amide), and internal side-chain hydrophobicity coefficients at 25°C.
| Amino Acid Substitution at Position Xa | Peptide 1 (-G-X-OH) tRb(Gly) (min) | Peptide 2 (G-X-amide) ΔtRb(Gly) (min) | Peptide 3 (Ac-X-G-) ΔtRb(Gly) (min) | Peptide 4 (NH2-X-G-) ΔtRb(Gly) (min) | Peptide 5 (-G-X-G-) ΔtRb(Gly) (min) | Peptide 1 Weighted Coefficients by 0.5c | Change in Coefficient Δ (1–2) (min) | Change in Coefficient (3–4) (min) | Change in Coefficient (1–4) (min) | Change in Coefficient (1–5) (min) | Change in Coefficient (4–5) (min) |
|---|---|---|---|---|---|---|---|---|---|---|---|
| Trp | 40.0d | 36.5 | 33.2 | 27.9 | 22.9 | 20.0 | 3.5 | 5.3 | 12.1 | 17.1 | 5.0 |
| Phe | 37.0 | 32.9 | 29.6 | 22.3 | 2 0.6 | 18.5 | 4.1 | 7.3 | 14.7 | 16.4 | 1.7 |
| Leu | 32.2 | 26.0 | 23.7 | 15.8 | 16.8 | 16.1 | 6.2e | 7.9 | 16.4 | 15.4 | −1.0 |
| Ile | 30.5 | 25.2 | 21.8 | 14.2 | 15.3 | 15.3 | 5.3 | 7.6 | 16.3 | 15.2 | −1.1 |
| Met | 21.2 | 18.0 | 16.5 | 11.8 | 11.2 | 10.6 | 3.2 | 4.7 | 9.4 | 10.0 | 0.6 |
| Tyr | 18.9 | 16.4 | 15.6 | 12.8 | 8.2 | 9.5 | 2.5 | 2.8 | 6.1 | 10.7 | 4.6 |
| Val | 20.0 | 15.4 | 13.8 | 8.1 | 8.6 | 10.0 | 4.6 | 5.7 | 11.9 | 11.4 | −0.5 |
| Pro | 12.2 | 7.5 | 10.2 | 4.5 | 3.6 | 6.1 | 4.7 | 5.7 | 7.7 | 8.6 | 0.9 |
| Cys | 10.8 | 8.6 | 8.1 | 4.3 | 6.0 | 5.4 | 2.2 | 3.8 | 6.5 | 4.8 | −1.7 |
| Ala | 5.0 | 3.0 | 3.4 | 1.5 | 2.8 | 2.5 | 2.0 | 1.9 | 3.5 | 2.2 | −1.3 |
| Glu | 2.1 | 3.8 | 3.1 | 1.4 | 2.3 | 1.1 | −1.7 | 1.7 | 0.7 | −0.2 | −0.9 |
| Thr | 3.6 | 3.3 | 2.8 | 1.9 | .5 | 1.8 | 0.3 | 0.9 | 1.7 | 2.1 | 0.4 |
| Arg | 2.5 | 3.7 | 2.4 | 3.0 | −1.1 | 1.3 | −1.2 | −0.6 | −0.5 | 3.6 | 4.1 |
| Asp | 1.4 | 1.9 | 1.7 | 1.4 | 1.5 | 0.7 | −0.5 | 0.3 | 0.0 | −0.1 | −0.1 |
| Gln | 0.0 | 1.6 | 0.7 | 1.4 | 0.8 | 0.0 | −1.6 | −0.7 | −1.4 | −0.8 | 0.6 |
| Gly | 0.0 | 0.0 | 0.0 | 0.0 | 0.0 | 0.0 | 0.0 | 0.0 | 0.0 | 0.0 | 0.0 |
| His | 0.0 | 1.2 | 0.0 | 1.4 | −2.4 | 0.0 | −1.2 | −1.4 | −1.4 | 2.4 | 3.8 |
| Ser | −0.8 | 0.0 | 0.0 | 0.0 | 0.6 | −0.4 | −0.8 | 0.0 | −0.8 | −1.4 | −0.6 |
| Lys | −1.0 | 0.0 | −0.3 | 1.3 | −2.3 | −0.5 | −1.0 | −1.6 | −2.3 | 1.3 | 3.6 |
| Asn | −2.3 | 0.0 | −0.5 | 0.0 | −0.5 | −1.2 | −2.3 | −0.5 | −2.3 | −1.8 | 0.5 |
The L-amino acid substitutions at position X in the peptide sequences shown in Table 1.
ΔtR(Gly) denotes peptide retention at 25 oC relative to the Gly substituted peptide for that sequence.
The peptide 1 coefficients were weighted by 0.5 to quantitatively resemble the internal coefficients from peptide 5.
The side-chain coefficient showing the greatest hydrophobicity in each of the five sets of peptides is bolded.
The maximum difference between any two sets of coefficients is bolded.
3. Results and discussion
3.1. Design of Model Peptides
In order to determine intrinsic hydrophobicity/hydrophilicity values for amino acid residues at the N- and C-terminus of peptides with different end-groups, the following considerations were used in the peptide design: (1) a peptide length of 10 residues was chosen to represent the size of peptides found in abundance in tryptic digests of proteins; (2) the peptide should be of sufficient overall hydrophobicity to maintain satisfactory retention behaviour on substituting the 20 amino acids at the substitution site X; (3) the peptide sequences should have no tendency to form any type of secondary structure (α-helix, β-sheet or β-turn) which could restrict the interaction of the substitution site with the hydrophobic matrix during partitioning of the peptide between the mobile phase and stationary phase during RP-HPLC; (4) the distribution of amino acid side-chains should be such that there is no clustering of hydrophobic side-chains which may minimize the contribution of the substituting amino acid side-chain; (5) the substitution site should be next to a residue that has a minimal side-chain in terms of size and hydrophobicity, thus allowing the substituting amino acid to express its true intrinsic hydrophilicity/hydrophobicity [35].
The sequences chosen to reflect the above criteria in determining the intrinsic hydrophilicity/hydrophobicity of the 20 naturally occurring amino acids in peptide/proteins at the N-terminus in the presence of the Nα-acetyl and Nα-amino group, at the C-terminus in the presence of the Cα-carboxyl and Cα-amide group and at an internal position in the polypeptide chain are shown in Table 1. These sequences contain four or five Gly residues spread periodically throughout the sequence to ensure that the peptide has no secondary structure tendencies [39,40]. The substitution site (denoted X) is adjacent to a Gly residue to ensure that there is unrestricted rotation on either side of the peptide bond between the substitution site and the residue next to it. In addition, since the guest site is the N-terminal or C-terminal residue, there is no restriction in its interaction with the reversed-phase matrix. When the substituting residue is at the N-terminus, the N-terminus is either acetylated or left as an α-amino group to demonstrate the effect these end groups have on the hydrophilicity/hydrophobicity of the adjacent side-chain. Similarly, when the substituting residue is at the C-terminus, the C-terminus is amidated or left as a carboxyl group to demonstrate the effect these end groups have on the hydrophilicity/hydrophobicity of the adjacent side-chain. When the substituting residue X is in an internal position, there is a Gly residue on both sides (Peptide 5, Table 1). All peptides have a minimum of a single positive charge to ensure peptide solubility at pH 2. The four hydrophobes in the peptide sequences 1, 2, 3 and 4 (2 Ala, 1 Val and 1 Leu) and peptide 5 (4 Leu) were distributed throughout the sequence to ensure no clustering of hydrophobes and subsequent creation of a preferred hydrophobic binding domain [24,28]. The sequences of Peptide 1 and Peptide 2 are identical (Table 1), differing only in the end-group (Cα-carboxyl or Cα-amide group). Similarly, the sequences of Peptide 3 and Peptide 4 are identical (Table 1), differing only in the end group (Nα-acetyl or Nα-amino group). Thus, the effect of these end-groups on the adjacent side-chain hydrophobicity/hydrophilicity can be determined.
Table 1.
Peptide sequences used in this study
| Peptide Group Number | Sequencea |
|---|---|
| 1 | NH2- G- A- G- A- G- V- G- L- G- X-OH |
| 2 | NH2- G- A- G- A- G- V- G- L- G- X-amide |
| 3 | Ac- X- G- A- K- G- A- G- V- G- L-amide |
| 4 | NH2- X- G- A- K- G- A- G- V- G- L-amide |
| 5 | NH2- L- G- L- G- X- G- L- G- L- G- K-OH |
Position X (bolded) is substituted by all 20 naturally occurring amino acids in each of the five peptides shown. Ac- denotes Nα-acetyl, NH2- denotes Nα amino, -amide denotes Cα-amide, -OH denotes Cα-carboxyl.
3.2. RP-HPLC retention behaviour of peptides at pH 2
The reversed-phase retention times of the 100 synthetic peptides were determined at pH 2 using a linear AB gradient (0.25% acetonitrile/min), where eluent A is 20 mM aqueous TFA containing 2% acetonitrile and eluent B is 20 mM TFA in acetonitrile. Even though the efficiency of ionization in electrospray LC/MS/MS is less efficient in the presence of TFA compared to formic acid/acetic acid-based eluents, the TFA system was chosen since it is the most highly used system in reversed-phase chromatography of peptides due to its superior separation efficiency compared to other RP-HPLC mobile phases [23]; in addition, TFA is still compatible with LC/MS/MS in proteomic applications. The shallow gradient of 0.25% acetonitrile/min was selected to magnify any differences in retention behaviour between peptides and, thus, in the generated hydrophobicity values of side-chains. In fact, it could be argued that when separating thousands of peptides for proteomics applications that this shallow gradient approach maximizes resolution and peak capacity for better separations compared to more widely employed gradient rates of 0.5%-1%/min The retention time data are shown in Table 2. These data allow the determination of the hydrophilicity/hydrophobicity of amino acid side chains as a function of end-groups (Peptides 1, 2, 3 and 4). The peptides in Table 2 with varying end-groups on the N-terminal or C-terminal substitution site are ordered from the most retentive peptide to the least retentive peptide based on the results of the N-terminal substituted Nα-acetylated peptides (Peptide 3, Table 2).
Table 2.
Comparison of RP-HPLC peptide retention time data with different N-terminal (Nα-acetyl-X- and Nα-amino-X-), C-terminal (-X-Cα-carboxyl and -X-Cα-amide) amino acid residues and functional groups and internal peptide substitution (-G-X-G-).
| Amino Acid Substitution at Position Xa | Peptide 1 (-G-X-OH) tRb(min) | Peptide 2 (-G-X-amide) tRb(min) | Peptide 3 (Ac-X-G-) tRb(min) | Peptide 4 (NH2-X-G-) tRb(min) | Peptide 5 (-G-X-G-) tRb(min) |
|---|---|---|---|---|---|
| Trp | 76.3 | 68.9 | 68.0 | 57.1 | 96.9 |
| Phe | 73.3 | 65.3 | 64.4 | 51.5 | 94.4 |
| Leu | 68.5 | 58.4 | 58.5 | 45.0 | 90.6 |
| Ile | 66.8 | 57.6 | 56.6 | 43.4 | 89.3 |
| Met | 57.5 | 50.4 | 51.3 | 41.0 | 84.9 |
| Tyr | 55.2 | 48.8 | 50.4 | 42.0 | 82.1 |
| Val | 56.3 | 47.8 | 48.6 | 37.3 | 82.4 |
| Pro | 48.5 | 39.9 | 45.0 | 33.7 | 77.5 |
| Cys | 47.1 | 41.0 | 42.9 | 33.5 | 79.7 |
| Ala | 41.3 | 35.4 | 38.2 | 30.7 | 76.6 |
| Glu | 38.4 | 36.2 | 37.9 | 30.6 | 76.3 |
| Thr | 39.9 | 35.7 | 37.6 | 31.1 | 75.2 |
| Arg | 38.8 | 36.1 | 37.2 | 32.2 | 72.7 |
| Asp | 37.7 | 34.3 | 36.5 | 30.6 | 75.4 |
| Gln | 36.3 | 34.0 | 35.5 | 30.6 | 74.7 |
| Gly | 36.3 | 32.4 | 34.8 | 29.2 | 73.8 |
| His | 36.3 | 33.6 | 34.8 | 30.6 | 71.6 |
| Ser | 35.5 | 32.4 | 34.8 | 29.2 | 74.4 |
| Lys | 35.3 | 32.4 | 34.5 | 30.5 | 71.4 |
| Asn | 34.0 | 32.4 | 34.3 | 29.2 | 73.4 |
The L-amino acid substitutions at position X in the peptide sequences shown in Table 1.
tR denotes peptide retention time at 25°C. See Materials and Methods for column and conditions of chromatography.
3.3. Amino acid hydrophilicity/hydrophobicity coefficients
To determine the hydrophilicity/hydrophobicity of the substituting amino acid side-chain at position X of the five peptide sequences, the retention time of the Gly-substituted peptide was used as a reference since Gly has only a hydrogen atom as its side-chain. Thus, the hydrophilicity/hydrophobicity coefficients of the 19 side-chains (other than Gly) were generated from RP-HPLC data from the difference in the retention times (ΔtR) of the X-substituted peptide and the Gly-substituted peptide, i.e. ΔtR = tR X-substituted peptide minus tR Gly-substituted peptide (Table 3). Thus, side-chains that are more hydrophobic than Gly have positive ΔtR values and side-chains that are more hydrophilic than Gly have negative ΔtR values.
3.3.1. Comparison of C-terminal end-groups on the hydrophilicity/hydrophobicity of C-terminal side-chains
The effect of the Cα-carboxyl group and the Cα-amide group on the hydrophilicity/hydrophobicity of amino acid residues at the C-terminus of a peptide is shown in Table 3, where the coefficients from Peptide 1 (X - Cα-carboxyl coefficients) and Peptide 2 (X - Cα-amide coefficients) are compared. The change in these C-terminal coefficients varies from 0 to 6.2 min depending on the side-chain (Peptide 1 coefficients minus Peptide 2 coefficients, Table 3). From Fig. 1A, when the X - Cα-carboxyl coefficients (ΔΔtR) for the 20 peptides are plotted against the X - Cα-amide coefficients for the 20 peptides there is an excellent correlation (R = 0.993). This result suggests that the relative difference in hydrophobicity between side-chains with different end-groups is very similar. However, the values for many side-chains are quantitatively different as shown in Fig. 1B. The side-chain coefficients that differ by more than 2.5 min are the hydrophobic amino acid side-chains, including P, V, M, I, L, F and W (2.5 min for Y to 6.2 min for Leu) (Table 3). The side-chain coefficients that show small variations (Fig. 1A and Table 3) are in general the hydrophilic amino acid side-chains, including the polar side-chains (D, E, N, Q, S and T) along with the positively charged side-chains (H, K and R). The small hydrophobes Ala and Cys show a small change of 2.0 min and 2.2 min, respectively between the two end-groups (Cα-carboxyl vs. Cα-amide).
Figure 1.
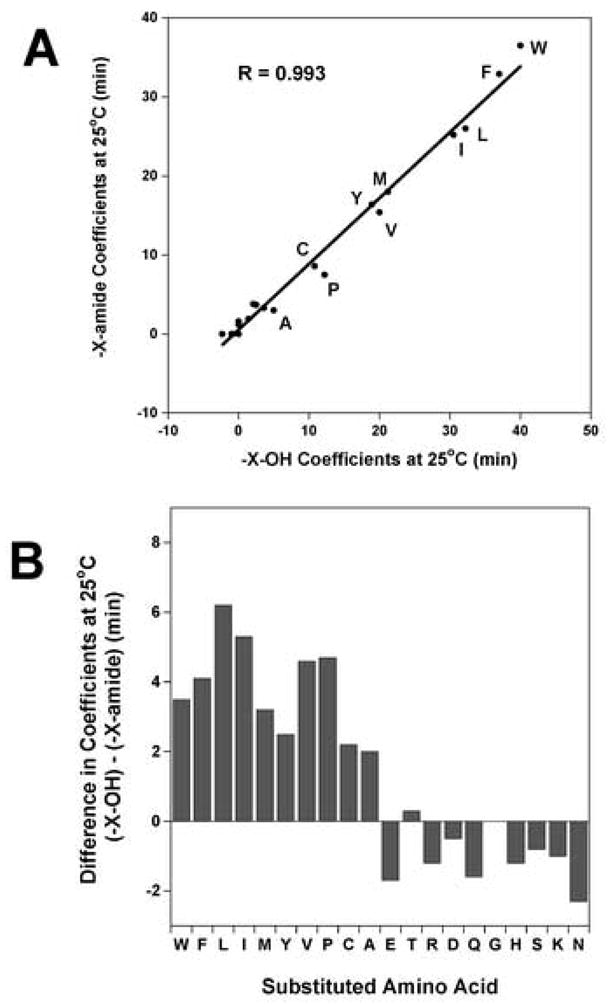
Panel A: Correlation plot of the hydrophilicity/hydrophobicity coefficients at the peptide C-terminus when the end group is Cα-amide versus Cα-carboxyl. The side-chain coefficients were determined from reversed-phase retention behaviour of peptides at 25°C (data taken from Peptide 1 and Peptide 2, Table 3). The peptide sequences are shown in Table 1. The hydrophobic amino acid substitutions are denoted by the single letter code. Y = 0.834 x + 0.522, correlation coefficient R = 0.993. Panel B: The differences in coefficients between Peptide 1 and Peptide 2 are plotted as a bar graph (data taken from Table 3).
3.3.2. Comparison of N-terminal end-groups on the hydrophilicity/hydrophobicity of N-terminal side-chains
The effect of the Nα-acetyl group and the Nα-amino group on the hydrophilicity/hydrophobicity of amino acid residues at the N-terminus of a peptide is shown in Table 3, where the coefficients determined from Peptide 3 (Nα-acetyl – X coefficients) and Peptide 4 (Nα-amino – X coefficients) are compared. The change in coefficients vary from 0 to 7.9 min depending on the side-chain (Peptide 3 coefficients minus Peptide 4 coefficients, Table 3). From Fig. 2A, when the Nα-amino – X coefficients for the 20 peptides are plotted against the Nα-acetyl coefficients for the 20 peptides, there is an excellent correlation (R = 0.982). This result again suggests that the relative difference in hydrophobicity between the side-chains with different end-groups is very similar. However, the values for many side-chains are quantitatively different as shown in Fig. 2B. The amino acid coefficients that differ more than 2 min are the hydrophobic amino acid residues including C, P, V, Y, M, I, L, F and W (3.8 min for Cys to 7.9 min for Leu). The amino acid coefficients that show small variations (Fig. 2B and Table 3) are in general the hydrophilic amino acid residues including the polar side-chains (D, E, N, Q, S and T) along with the positively charged side-chains (H, K and R). The small hydrophobe Ala shows a change of less than 2 minutes between the two end-groups. It should be noted that one of the most common post-translational modifications made in proteins is acetylation of the N-terminal amino acid. Thus, the Nα-acetyl coefficients can be used to predict retention times of such modified N-terminal peptides.
Figure 2.
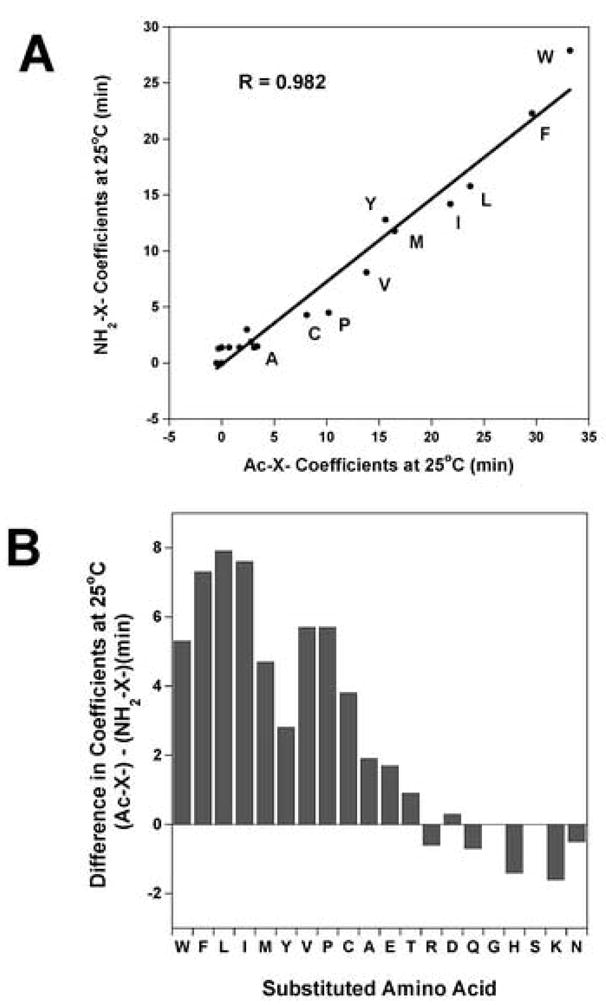
Panel A: Correlation plot of the hydrophilicity/hydrophobicity coefficients at the peptide N-terminus when the end group is Nα-amino versus Nα-acetyl. The coefficients were determined from reversed-phase retention behaviour of peptides at 25°C (data taken from Peptide 3 and Peptide 4, Table 3). The peptide sequences are shown in Table 1. The hydrophobic amino acid substitutions are denoted by the single letter code. Y = 0.739 x + 0.114, correlation coefficient R = 0.982. Panel B: The difference in coefficients between Peptide 3 and Peptide 4 are plotted as a bar graph (data taken from Table 3).
3.3.3. Comparison of terminal coefficients with the largest differences in side-chain hydrophilicity/hydrophobicity
The greatest difference in coefficients depending on location and end-groups is shown in Table 3 where the coefficients determined from Peptide 1 (C-terminal – X-carboxyl coefficients) and Peptide 4 (N-terminal amino – X coefficients) are compared. The change in coefficients varies from 0 to 16.4 min., depending on the side-chain (Table 3). From Fig. 3A, when the amino – X-coefficients for the 20 peptides are plotted against the –X-carboxyl coefficients for 20 peptides there is an excellent correlation (R = 0.967). This result suggests that the relative difference in hydrophobicity between side-chains is very similar regardless of location and difference in end-groups. However, the values for many amino acid residues are quantitatively different as shown in Fig. 3B. The amino acid coefficients that differ by more than 3.0 min are the hydrophobic amino acid residues including A, C, P, V, Y, M, I, L, F and W (3.5 min for Ala to 16.4 min for Leu). The amino acid coefficients that show small variations are the hydrophilic amino acid side-chains including the polar side-chains (D, E, N, Q, S and T) along with the positively charged side-chains (H, K and R) (Fig. 3B and Table 3).
Figure 3.
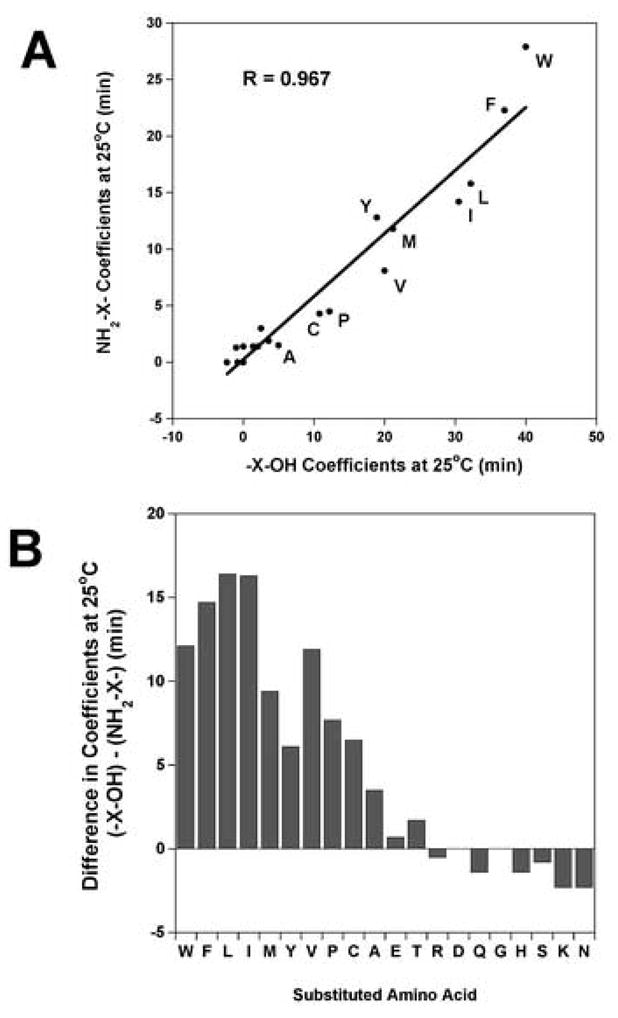
Panel A: Correlation plot of the hydrophilicity/hydrophobicity coefficients at the peptide N-terminus with a Nα-amino group versus coefficients at the C-terminus with a Cα-carboxyl group determined from reversed-phase retention behaviour of peptides at 25°C (data taken from Peptide 1 and Peptide 4, Table 3). The peptide sequences are shown in Table 1. The hydrophobic amino acid substitutions are denoted by the single letter code. Y = 0.558 x + 0.242, correlation coefficient R = 0.967. Panel B: The differences in coefficients between Peptide 1 and Peptide 4 are plotted as a bar graph (data taken from Table 3).
3.3.4. Relative hydrophobicity of the N- and C-terminal functional groups
To determine the relative hydrophobicity of the functional groups in the absence of any effect of the N- or C-terminal side-chain, we compared the difference in retention times of the peptides with Gly at position X (Table 2). Nα-acetyl Gly – peptide is more hydrophobic than the Nα-amino Gly – peptide by 5.6 min (tR 34.8 min − tR 29.2 min, Table 2). Since the Nα-amino group is fully protonated at pH 2, with a positive charge, it was expected to be more hydrophilic than the Nα-acetyl moeity. The hydrophilicity of the Nα-amino group will be dependent on the concentration of hydrophobic ion-pairing reagent used (TFA) during RP-HPLC, i.e., it will become less hydrophilic with increasing TFA concentration [41, 42]. Thus, the lower the TFA concentration the greater the difference between the Nα-acetyl and Nα-amino group.
The peptide-Gly-Cα-carboxyl is more hydrophobic than the peptide-Gly- Cα-amide by 3.9 min (tR 36.3 min − tR 32.4 min, Table 2). The carboxyl moeity must be fully protonated at pH 2 to be more hydrophobic than the amide moeity. Any ionization of the carboxyl group would make the carboxyl group negatively charged and much more hydrophilic than the amide group. The hydrophobic environment of the matrix would also be expected to increase the pKa of the carboxyl moiety, thus keeping the carboxyl in its uncharged form at pH 2 [43].
It should be noted that no single value for the functional end-groups (Cα-carboxyl, Cα-amide, Nα-amino and Nα-acetyl) can be assigned since the values for the end-groups are dependent on the side-chain on the terminal residue and the hydrophilicity/hydrophobicity values of the side-chains are dependent on the end-groups. Thus, the coefficients at the N- and C-termini of the peptide chain are amino acid coefficients.
3.3.5. Comparison of the N-terminal amino-X and C-terminal X-carboxyl coefficients with the internal coefficients
Comparing the coefficients obtained at the C-terminal (-X-COOH) with the internal coefficients where the substitution site is in the centre of the peptide between two Gly residues (Table 1) showed that the internal coefficients are considerably smaller and the differences in the coefficient values are large (Table 3, Peptide 1 – Peptide 5). From Fig. 4A, when the -X-carboxyl coefficients for the 20 peptides are plotted against the internal coefficients for the 20 peptides, there is an excellent correlation (R = 0.984). This result again suggests that the relative difference in hydrophobicity between side-chains is very similar regardless of location. However, the values for many side-chains are quantitatively different as shown in Fig. 4B. Thus, the amino acid coefficients at the C-terminus (Cα-carboxyl) were dramatically different from internal coefficients for the hydrophobic side-chains in the order of Trp>Phe>Leu>Ile>Val>Tyr>Met>Pro>Cys (ranging from 17.1 min for Trp to 4.8 min for Cys) (Fig. 4B, Table 3). The only non-hydrophobic side-chain with a value greater than 3.0 min is Arg. Arg is much more hydrophilic in the centre of the peptide (coefficient of −1.1) compared to the terminal locations where Arg was always hydrophobic relative to Gly (Table 3). In fact, the other positively charged side-chains (His and Lys) are also significantly more hydrophilic in the centre of the peptide with coefficient values of −2.4 and −2.3, respectively (Table 3). The amino acid coefficients that show small variations are the hydrophilic amino acid residues including the polar side-chains (D, E, N, Q, S and T) along with the positively charged side-chains (H and R) (Fig. 4B and Table 3).
Figure 4.

Panel A: Correlation plot of the hydrophobicity/hydrophilicity coefficients at the C-terminus with a Cα-carboxyl group versus internal side-chain coefficients (data taken from Peptide 1 and Peptide 5, Table 3). The peptide sequences are shown in Table 1. The hydrophobic amino acid side-chains are denoted by the single letter code. Y = 0.985 x − 0.497, correlation coefficient R = 0.984. Panel B: The difference in coefficients between Peptide 1 and Peptide 5 are plotted as a bar graph (data taken from Table 3).
Differences in the N-terminal coefficients (Nα-amino) relative to the internal coefficients are generally small except for 5 side-chains (Trp, Tyr, Arg, His, Lys) (Table 3). The 3 positively charged side-chains (Arg, His and Lys) become more hydrophobic at the terminal positions compared to the internal location (Table 3). Interestingly, the two hydrophobic aromatic amino acids with hetero-atoms (Trp, Tyr) become more hydrophobic at the N-terminus in the presence of the Nα-amino group relative to the hydrophobic side-chains (Phe, Leu, Ile, Met, Val), where the values are similar between the two locations (Table 3, Peptide 4 vs. Peptide 5).
The amino acid coefficients at the C-terminus in the presence of the Cα-carboxyl group showed the greatest difference from the internal coefficients compared to the other terminal end groups (Cα-amide, Nα-acetyl, Nα-amino) (Table 3). Indeed, the differences in the amino acid coefficients in the presence of the Nα-amino group when compared to the internal coefficients were small compared to the differences in the amino acid coefficients determined at the C-terminus in the presence of the Cα-carboxyl group compared to the internal coefficients. In addition, comparison of the C-terminal coefficients in the presence of the Cα-carboxyl group to the N-terminal coefficients in the presence of the Nα-amino group show the greatest differences for the hydrophobic side-chains (Trp, Phe, Leu, Ile, Met, Val, Tyr, Pro,Cys, Ala) (Fig. 3B, Table 3) compared to polar side-chains. For example, the amino acid coefficient for Trp when located at the N-terminus (NH2-X-) had a value of 27.9 min relative to Gly at the same position, whereas the internal side-chain coefficient for Trp was 22.9 min. In contrast, the coefficient value for Trp when located at the C-terminus (-X-COOH) was 40.0 min. Thus, the side-chain coefficient effect at the C-terminus for Trp was 3.4-fold greater than at the N-terminus.
3.4. Prediction of peptide retention time
From the results presented above, it is clear that for accurate prediction of peptide retention time, the sum of the amino acid coefficients must include the values for the N- and C-terminal amino acid residues, which also depend on the end group on that residue (Cα-amide, Cα-carboxyl, Nα-acetyl, Nα-amino) plus the internal values for the remaining residues in the polypeptide chain.
To demonstrate the importance of using terminal coefficients combined with internal coefficients in the prediction of peptide retention time, we compared predicted and observed retention times using various coefficient sets by themselves, or weighted coefficients by themselves or in various combinations (e.g., weighted coefficients to represent internal values or experimentally derived internal coefficients, both in combination with terminal coefficients). The terminal coefficients that vary the most from the experimentally derived internal coefficients are the C-terminal X-carboxyl coefficients (Peptide 1, Table 3) compared to the internal coefficients (Peptide 5, Table 3). Thus, we chose to predict the retention times of the 20 peptides of peptide 1 using first the C-terminal X-carboxyl coefficients for all residues in the peptide sequence. The results are shown in Table 4 (columns 1, 2 and 3). It is immediately obvious that we over-predicted the observed retention times by 31.6 min. This indicates that the coefficients determined at the C-terminus of the peptide chain do not represent quantitatively the hydrophilicity/hydrophobicity of side-chains in general, thus the large error in prediction.
Table 4.
Comparison of predicted and observed retention times.
| Column Number | |||||||||||
|---|---|---|---|---|---|---|---|---|---|---|---|
| 1 | 2 | 3 | 4 | 5 | 6 | 7 | 8 | 9 | 10 | 11 | |
| Amino Acid Substitution at Position Xa | Obs.b (min) |
Pred 1c (min) |
Pred 1 - Obs (min) |
Pred 2d (min) |
Pred 2 - Obs (min) |
Pred 3e (min) |
Pred 3 - Obs (min) |
Pred 4f (min) |
Pred 4 - Obs (min) |
Pred 5g (min) |
Pred 5 - Obs (min) |
| Trp | 76.3 | 107.9 | 31.6 | 56.8 | −19.5 | 76.8 | 0.5 | 59.6 | −16.7 | 76.7 | 0.4 |
| Phe | 73.3 | 104.9 | 31.6 | 55.3 | −18.0 | 73.8 | 0.5 | 57.3 | −16.0 | 73.7 | 0.4 |
| Leu | 68.5 | 100.1 | 31.6 | 52.9 | −15.6 | 69.0 | 0.5 | 53.5 | −15.0 | 68.9 | 0.4 |
| Ile | 66.8 | 98.4 | 31.6 | 52.1 | −14.7 | 67.3 | 0.5 | 52.0 | −14.8 | 67.2 | 0.4 |
| Met | 57.5 | 89.1 | 31.6 | 47.4 | −10.1 | 58.0 | 0.5 | 47.9 | − 9.6 | 57.9 | 0.4 |
| Tyr | 55.2 | 86.8 | 31.6 | 46.3 | − 8.9 | 55.7 | 0.5 | 44.9 | −10.3 | 55.6 | 0.4 |
| Val | 56.3 | 87.9 | 31.6 | 46.8 | − 9.5 | 6.8 | 0.5 | 45.3 | −11.0 | 56.7 | 0.4 |
| Pro | 48.5 | 80.1 | 31.6 | 42.9 | − 5.6 | 49.0 | 0.5 | 40.3 | − 8.2 | 48.9 | 0.4 |
| Cys | 47.1 | 78.7 | 31.6 | 42.2 | − 4.9 | 47.6 | 0.5 | 42.7 | − 4.4 | 47.5 | 0.4 |
| Ala | 41.3 | 72.9 | 31.6 | 39.3 | − 2.0 | 41.8 | 0.5 | 39.5 | − 1.8 | 41.7 | 0.4 |
| Glu | 38.4 | 70.0 | 31.6 | 37.9 | − 0.5 | 38.9 | 0.5 | 39.0 | 0.6 | 38.8 | 0.4 |
| Thr | 39.9 | 71.5 | 31.6 | 38.6 | − 1.3 | 40.4 | 0.5 | 38.2 | − 1.7 | 40.3 | 0.4 |
| Arg | 38.8 | 70.4 | 31.6 | 38.1 | − 0.7 | 39.3 | 0.5 | 35.6 | − 3.2 | 39.2 | 0.4 |
| Asp | 37.7 | 69.3 | 31.6 | 37.5 | − 0.2 | 38.2 | 0.5 | 38.2 | 0.5 | 38.1 | 0.4 |
| Gln | 36.3 | 67.9 | 31.6 | 36.8 | 0.5 | 36.8 | 0.5 | 37.5 | 1.2 | 36.7 | 0.4 |
| Gly | 36.3 | 67.9 | 31.6 | 36.8 | 0.5 | 36.8 | 0.5 | 36.7 | 0.4 | 36.7 | 0.4 |
| His | 36.3 | 67.9 | 31.6 | 36.8 | 0.5 | 36.8 | 0.5 | 34.3 | − 2.0 | 36.7 | 0.4 |
| Ser | 35.5 | 67.1 | 31.6 | 36.4 | 0.9 | 36.0 | 0.5 | 37.3 | 1.8 | 35.9 | 0.4 |
| Lys | 35.3 | 66.9 | 31.6 | 36.3 | 1.0 | 35.8 | 0.5 | 34.4 | − 0.9 | 35.7 | 0.4 |
| Asn | 34.0 | 65.6 | 31.6 | 35.6 | 1.6 | 34.5 | 0.5 | 36.2 | 2.2 | 34.4 | 0.4 |
The L-amino acid substitutions at position X in the peptide sequences shown in Table 1.
Observed retention times of the twenty peptides differing at position X of peptide 1 shown in Table 2.
Predicted peptide retention time (τ) using the C-terminal X-carboxyl coefficients for all residues in the peptide sequence (column 2) and the difference between predicted and observed (column 3).
τ using weighted C-terminal carboxyl coefficients (weighting factor 0.5) for all residues in the peptide sequence (column 4) and the difference in predicted and observed (column 5).
τ using the weighted C-terminal carboxyl coefficients for all residues except the C-terminal residue which uses the C-terminal X-carboxyl coefficients (column 6) and the difference in predicted and observed (column 7).
τ using experimentally derived internal coefficients (peptide 5, Table 3) for all residues in the sequence (column 8) and the difference in predicted and observed (column 9)
τ using the internal coefficients for all residues except the C-terminal residue which uses the C-terminal X-carboxyl coefficients (column 10) and the difference in predicted and observed (column 11).
Since the coefficients when compared to each other show excellent correlations (Figs. 1–4), any set of hydrophobicity/hydrophilicity coefficients should be able to predict peptide retention times if weighted correctly to represent internal residues in the polypeptide chain. Thus, using a weighting factor of 0.5, the weighted C-terminal carboxyl coefficients were used for all residues in the peptide sequence to predict peptide retention times of the same 20 peptides (Table 4, columns 4 and 5). Though the prediction was better than using unweighted coefficients, we under-predicted the observed retention times for the peptides containing hydrophobic substitutions (Cys, Pro, Val, Tyr, Met, Ile, Leu, Phe and Trp) by −4.9 min to −19.5 min. These deviations can be explained by the fact that these 20 peptides in the Peptide 1 group (Table 1) vary only at the C-terminal residue and we have already shown that the C-terminal carboxyl coefficients are dramatically different from experimentally derived internal coefficients (Table 3). Thus, we next used the weighted C-terminal carboxyl coefficients for all residues in the peptide sequence except the C-terminal residue for which we used the C-terminal carboxyl coefficients (Peptide 1, Table 4). With this combination of coefficients, the predicted retention times are shown in Table 4, column 6, and the difference between predicted and observed retention times in column 7. The results show that we can now accurately predict the retention time of these peptides within 0.5 min. This result clearly demonstrates the need for coefficients that represent the internal residues and the terminal residues of the polypeptide chain for accurate prediction.
We next predicted the peptide retention times of these same 20 peptides using experimentally derived internal coefficients (Peptide 5, Table 3). Using these values we under-predicted the retention times mainly for the peptides containing hydrophobic substitutions (Cys, Pro, Val, Tyr, Met, Ile, Leu, Phe and Trp by −4.4 min to −16.7 min) (Table 4, columns 8 and 9). These results are very similar to the results in columns 4 and 5 (Table 4), where we used weighted C-terminal coefficients to represent coefficients for internal residues. We then predicted the retention times of these peptides using a combination of internal coefficients and C-terminal carboxyl coefficients for the C-terminal residues in the 20 peptides. With this combination of coefficients, the predicted retention times are shown in column 10 and the difference between predicted and observed retention times in column 11 (Table 4). The results show that we can now accurately predict the retention time of these peptides within 0.4 min in this case. These results are quite impressive when one considers that the gradient rate for the separations is 0.25% acetonitrile/min and predictions reported in the literature generally use higher gradient rates (e.g., 0.6%–1.3% acetonitrile/min) with errors still > 4 min for many peptides. This means that, at 1% acetonitrile/min, our errors would be equivalent to 0.1 min to 0.2 min, i.e., approaching the errors in reproducibility of run to run variation (± 0.1 min to 0.2 min. in peptide retention time). The results in Table 4 clearly show that accurate prediction requires retention coefficients for the terminal residues and internal residues and a single set of coefficients cannot accurately predict peptide retention time.
3.5. Correlation versus accuracy of peptide retention time prediction
For accurate prdiction of peptide retention times, ideally a correlation of 1.0, a slope of 1.0 and an intercept of 0 is required when plotting predicted versus observed peptide retention time. Thus, the results in Table 4 are now shown graphically in Figs. 5 and 6. In Fig. 5A, predicted retention time is plotted versus observed retention time using three different scenarios to predict the 20 peptides varying at the C-terminal positions (Peptide 1). Fig. 5A, plot A, uses the C-terminal carboxyl residue coefficients for all residues in the peptide. Even though the error between predicted vs observed is large 31.6 min, the correlation coefficient between predicted and observed is 1.0. This means that we have a systematic error for prediction of the core sequence excluding the C-terminal residue. That is, the sum of the retention coefficients (ΣRc) for the sequence, G A G A G V G L G, Table 1, Peptide 1 is too large by 31.6 min (Fig. 5B, plot A). This is because the C-terminal carboxyl coefficients, though proportional, are quantitatively too large and not representative of internal values in the polypeptide chain.
Figure 5.
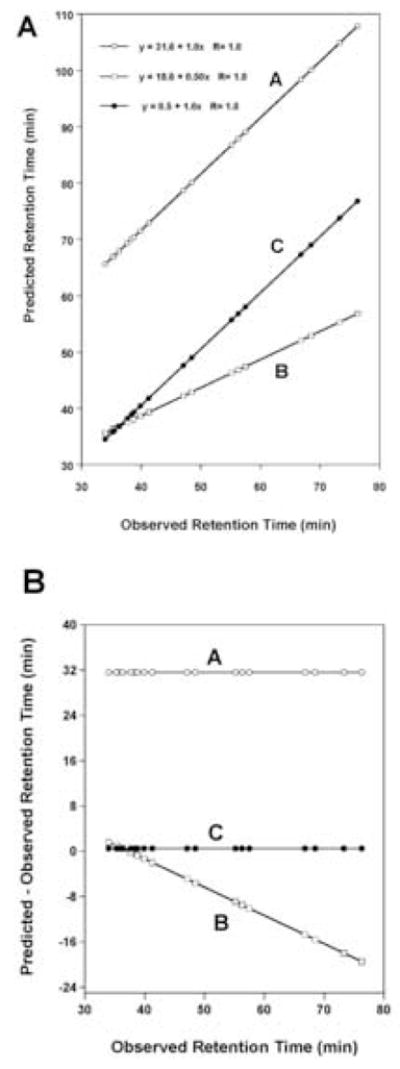
Panel A: Correlation plots of predicted retention times versus observed retention times of the data shown in Table 4 for columns 2, 4 and 6. Plot A uses the C-terminal X-carboxyl coefficients for all residues in the peptide sequence; Plot B uses the weighted C-terminal carboxyl coefficients for all residues in the peptide sequence; Plot C uses the weighted coefficients for all residues except the C-terminal residue which uses the C-terminal X-carboxyl coefficients. Panel B: Correlation plots of the difference between predicted and observed versus observed retention times. Plots A, B and C use predicted values determined as described in Panel A.
Figure 6.
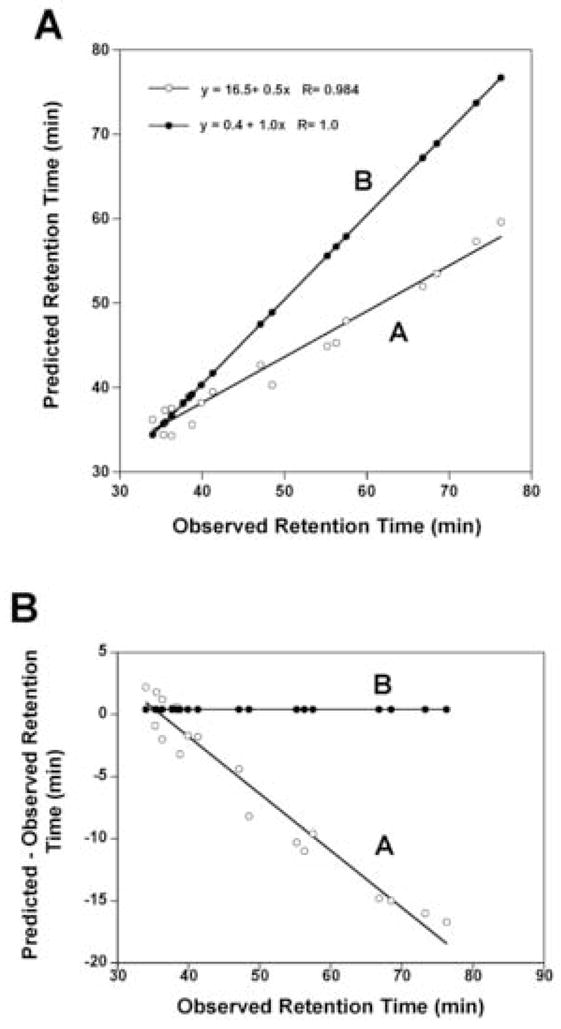
Panel A: Correlation plots of predicted retention times versus observed retention times for the data shown in Table 4 for columns 8 and 10. Plot A uses the experimentally derived internal coefficients for all residues in the sequence and Plot B uses the internal coefficients for all residues except the C-terminal residue which uses the C-terminal X-carboxyl coefficients. Panel B: Correlation plots of the difference between predicted and observed versus observed retention times. Plots A and B use predicted values determined as described in Panel A.
By introducing a weighting factor 0.5 on these coefficients we obtain a dramatic improvement in prediction. The correlation coefficient remains 1.0 (Fig. 5A, plot B) but the slope deviates from 1.0 and the intercept deviates from zero. As shown in Fig. 5B, plot B, the error in prediction increases in a linear fashion as the hydrophobicity of the peptides increases. The reason for the deviations is that we do not have the correct values for the C-terminal residue which is the only difference in sequence for the 20 peptides. Thus, when we use the weighted coefficients for the internal residues and the C-terminal coefficients for the C-terminal residue, we now predict very accurately peptide retention time and the linear equation has an intercept near zero, a slope of 1.0 and a correlation coefficient of 1.0 (Fig. 5A, plot C). The error in prediction approaches zero for all 20 peptides (Fig. 5B, plot C). Similarly, we wanted to compare our predictions using weighted coefficients for internal residues to using experimentally derived internal coefficients. In Fig. 6A, we plotted predicted retention time versus observed retention time using internal coefficients only (Peptide 5, Table 3) for all residues in the sequence of these 20 peptides varying at the C-terminal position (Peptide 1). Clearly, the internal coefficients on their own cannot accurately predict the retention times. Fig. 6A, plot A, shows that the correlation coefficient (R = 0.984) is excellent for predicted vs observed but the intercept and slope terms deviate from 0 and 1.0, respectively, and the error in prediction increases in a linear fashion as the hydrophobicity of the peptides increase (Fig. 6B, plot A). However, when we combine coefficients, i.e., use the internal coefficients for all internal residues and the C-terminal coefficients for the C-terminal residue, the error in prediction approaches zero for all 20 peptides (Fig. 6B, plot B). As shown in Fig. 6A, plot B, the correlation coefficient for predicted vs observed retention times is R = 1.0, the slope is 1.0 and the intercept close to zero. In conclusion, the internal coefficients (either derived experimentally or using weighted C-terminal coefficients) provide excellent values to represent the side-chain hydrophilicity/hydrophobicity of the internal residues in the polypeptide chain and when combined with the terminal coefficients (in this case the C-terminal coefficients), we can accurately predict the retention times of these peptides.
4. Conclusions
Our laboratory has always recognized that empirical approaches are useful to introduce correction factors to predicted peptide retention times during RP-HPLC. Certainly, one can improve correlation of predicted versus observed retention times in this manner, albeit without obtaining a quantitative biophysical understanding of the reasons for deviations between predicted and observed peptide retention times. Hence, we have always favoured a step-by-step approach to understanding peptide retention behaviour during RP-HPLC via the synthesis and application in RP-HPLC of peptides specifically designed to investigate a single aspect of peptide retention behaviour. Thus, the present study has, through RP-HPLC of model peptides, clearly shown that terminal amino acid side-chain hydrophilicity/hydrophobicity coefficients vary dramatically from each other: almost by a factor of 2 when comparing C-terminal carboxyl coefficients with α-amino coefficients (Table 3). If one is going to predict retention times of peptides, the N- and C-terminal residues and their corresponding functional groups must be taken into consideration. The C-terminal carboxyl coefficients are also the most different from the internal coefficients (Table 3) and for accurate prediction the ΣRc must include internal coefficients and terminal coefficients. Though this approach will dramatically improve prediction based on amino acid composition, it must be recognized that there will always be an inherent error in prediction due to sequence-dependent affects and the magnitude of this error is sequence dependent, i.e., the error could range from minor to very significant. The concern is what percentage of peptides from protein digests fall into the latter category. A challenging goal for future studies is to understand sequence-dependent effects and design new algorithms to improve further accuracy in prediction.
Acknowledgments
This work was supported by a grant from the National Institutes of Health (R01 GM 61855) to R.S.H. This manuscript is a tribute to and in memory of Dr. Robert Bruce Merrifield. Nobel Laureate, who died in May, 2006. Dr. Merrifield was my postdoctoral mentor from 1971–1974 when I (R.S.H.) entered the field of peptide chemistry.
Footnotes
Publisher's Disclaimer: This is a PDF file of an unedited manuscript that has been accepted for publication. As a service to our customers we are providing this early version of the manuscript. The manuscript will undergo copyediting, typesetting, and review of the resulting proof before it is published in its final citable form. Please note that during the production process errors may be discovered which could affect the content, and all legal disclaimers that apply to the journal pertain.
References
- 1.Petritis K, Kangas LJ, Ferguson PL, Anderson GA, Paša-Tolić L, Lipton MS, Auberry KJ, Strittmatter EF, Shen Y, Zhao R, Smith RD. Anal Chem. 2003;75:1039. doi: 10.1021/ac0205154. [DOI] [PubMed] [Google Scholar]
- 2.Biswas KM, DeVido DR, Dorsey JG. J Chromatogr A. 2003;1000:637. doi: 10.1016/s0021-9673(03)00182-1. [DOI] [PubMed] [Google Scholar]
- 3.Meek JL. Proc Natl Acad Sci USA. 1980;77:1632. doi: 10.1073/pnas.77.3.1632. [DOI] [PMC free article] [PubMed] [Google Scholar]
- 4.Meek JL, Rossetti ZL. J Chromatogr. 1981;211:15. [Google Scholar]
- 5.Su SJ, Grego B, Niven B, Hearn MTW. J Liq Chromatogr. 1981;4:1745. [Google Scholar]
- 6.Wilson KJ, Honegger A, St tzel RP, Hughes GJ. Biochem J. 1981;199:31. doi: 10.1042/bj1990031. [DOI] [PMC free article] [PubMed] [Google Scholar]
- 7.Browne CA, Bennett HPJ, Solomon S. Anal Biochem. 1982;124:201. doi: 10.1016/0003-2697(82)90238-x. [DOI] [PubMed] [Google Scholar]
- 8.Sasagawa T, Okuyama T, Teller DC. J Chromatogr. 1982;240:329. [Google Scholar]
- 9.Jinno K, Tanigawa E. Chromatographia. 1988;25:613. [Google Scholar]
- 10.Valko K, Bevan C, Reynolds D. Anal Chem. 1997;69:2022. doi: 10.1021/ac961242d. [DOI] [PubMed] [Google Scholar]
- 11.Plass M, Valko K, Abraham MH. J Chromatogr A. 1998;803:51. [Google Scholar]
- 12.Silva MF, Chipre LF, Raba J, Luco JM. Chromatographia. 2001;53:392. [Google Scholar]
- 13.Kaliszan R, Baczek T, Cimochowska A, Juszczyk P, Wiśniewska K, Grzonka Z. Proteomics. 2005;5:409. doi: 10.1002/pmic.200400973. [DOI] [PubMed] [Google Scholar]
- 14.Baczek T, Wiczling P, Marszall M, Heyden YV, Kaliszan R. J Proteome Res. 2005;4:555. doi: 10.1021/pr049780r. [DOI] [PubMed] [Google Scholar]
- 15.Guo D, Mant CT, Taneja AK, Parker JMR, Hodges RS. J Chromatogr. 1986;359:499. [Google Scholar]
- 16.Nice EC, Capp MW, Cooke N, O’Hare MJ. J Chromatogr. 1981;218:569. [Google Scholar]
- 17.Su SJ, Grego B, Niven B, Hearn MTW. J Liq Chromatogr. 1981;4:1745. [Google Scholar]
- 18.Wilson KJ, Honegger A, Hughes GJ. Biochem J. 1981;199:43. doi: 10.1042/bj1990043. [DOI] [PMC free article] [PubMed] [Google Scholar]
- 19.Wehr CT, Correia L, Abbot SR. J Chromatogr Sci. 1982;20:114. [Google Scholar]
- 20.Mant CT, Burke TWL, Black JA, Hodges RS. J Chromatogr. 1988;458:193. doi: 10.1016/s0021-9673(00)90564-8. [DOI] [PubMed] [Google Scholar]
- 21.Mant CT, Zhou NE, Hodges RS. J Chromatogr. 1989;476:363. doi: 10.1016/s0021-9673(01)93882-8. [DOI] [PubMed] [Google Scholar]
- 22.Mant CT, Hodges RS. In: HPLC of Biological Macromolecules. 2. Gooding KM, Regnier FE, editors. Marcel Dekker; New York: 2002. p. 433. [Google Scholar]
- 23.Lau SYM, Taneja AK, Hodges RS. J Biol Chem. 1984;259:13253. [PubMed] [Google Scholar]
- 24.Zhou NE, Mant CT, Hodges RS. Peptide Res. 1990;3:8. [PubMed] [Google Scholar]
- 25.Blondelle SE, Ostresh JM, Houghten RA, Pérez-Payá E. Biophys J. 1995;68:351. doi: 10.1016/S0006-3495(95)80194-3. [DOI] [PMC free article] [PubMed] [Google Scholar]
- 26.Purcell AW, Aguilar MI, Wettenhall REW, Hearn MTW. Peptide Res. 1995;8:160. [PubMed] [Google Scholar]
- 27.Steer DL, Thompson PE, Blondelle SE, Houghton RA, Aguilar MI. J Peptide Res. 1998;51:401. doi: 10.1111/j.1399-3011.1998.tb00638.x. [DOI] [PubMed] [Google Scholar]
- 28.Steiner V, Schär M, Börnsen KO, Mutter M. J Chromatogr. 1991;586:43. doi: 10.1016/0021-9673(91)80023-a. [DOI] [PubMed] [Google Scholar]
- 29.Houghten RA, DeGraw ST. J Chromatogr. 1987;386:223. doi: 10.1016/s0021-9673(01)94599-6. [DOI] [PubMed] [Google Scholar]
- 30.Houghten RA, Ostresh JM. BioChromatography. 1987;2:80. [Google Scholar]
- 31.Segrest JP, DeLoof H, Dohlman JG, Brouillette CG, Anantharamaiah GM. Proteins: Struc Func Gen. 1990;8:103. doi: 10.1002/prot.340080202. [DOI] [PubMed] [Google Scholar]
- 32.Pappu RV, Srinivasan R, Rose GD. Proc Natl Acad Sci USA. 2000;97:12565. doi: 10.1073/pnas.97.23.12565. [DOI] [PMC free article] [PubMed] [Google Scholar]
- 33.Shortle D. Protein Sci. 2002;11:18. doi: 10.1110/ps.ps.31002. [DOI] [PMC free article] [PubMed] [Google Scholar]
- 34.Kovacs JM, Mant CT, Osguthorpe DJ, Kwok S, Hodges RS. J Chromatogr A. 2006;1123:212. doi: 10.1016/j.chroma.2006.04.092. [DOI] [PMC free article] [PubMed] [Google Scholar]
- 35.Kovacs JM, Mant CT, Hodges RS. Biopolymers (Peptide Sci) 2006;84:298. doi: 10.1002/bip.20417. [DOI] [PMC free article] [PubMed] [Google Scholar]
- 36.Krokhin OV, Craig R, Spicer V, Ens W, Standing KG, Beavis RC, Wilkins JA. Mol Cell Proteomics. 2004;3:908. doi: 10.1074/mcp.M400031-MCP200. [DOI] [PubMed] [Google Scholar]
- 37.Krokhin OV, Ying S, Cortens JP, Ghosh D, Spicer V, Ens W, Standing KG, Beavis RC, Wilkins JA. Anal Chem. doi: 10.1021/ac060251b. (in press) [DOI] [PubMed] [Google Scholar]
- 38.Guo D, Mant CT, Taneja AK, Hodges RS. J Chromatogr. 1986;359:519. [Google Scholar]
- 39.Zhou NE, Monera OD, Kay CM, Hodges RS. Protein Pep Letters. 1994;1:114. [Google Scholar]
- 40.Monera OD, Sereda TJ, Zhou NE, Kay CM, Hodges RS. J Peptide Sci. 1995;1:319. doi: 10.1002/psc.310010507. [DOI] [PubMed] [Google Scholar]
- 41.Shibue M, Mant CT, Hodges RS. J Chromatogr A. 2005;1080:58. doi: 10.1016/j.chroma.2005.02.047. [DOI] [PMC free article] [PubMed] [Google Scholar]
- 42.Shibue M, Mant CT, Hodges RS. J Chromatogr A. 2005;1080:68. doi: 10.1016/j.chroma.2005.03.035. [DOI] [PMC free article] [PubMed] [Google Scholar]
- 43.Sereda TJ, Mant CT, Quinn AM, Hodges RS. J Chromatogr. 1993;646:17. doi: 10.1016/s0021-9673(99)87003-4. [DOI] [PubMed] [Google Scholar]