

Abstract
Ethanol, a widely abused substance, elicits evolutionarily conserved behavioral responses in a concentration-dependent manner in vivo. The molecular mechanisms underlying such behavioral sensitivity to ethanol are poorly understood. While locomotor-based behavioral genetic screening is successful in identifying genes in invertebrate models, such complex behavior-based screening has proven difficult for recovering genes in vertebrates. Here we report a novel and tractable ethanol response in zebrafish. Using this ethanol-modulated camouflage response as a screening assay, we have identified a zebrafish mutant named fantasma (fan), which displays reduced behavioral sensitivity to ethanol. Positional cloning reveals that fan encodes type 5 adenylyl cyclase (AC5). fan/ac5 is required to maintain the phosphorylation of extracellular signal-regulated kinase (ERK) in the forebrain structures, including the telencephalon and hypothalamus. Partial inhibition of phosphorylation of ERK in wild-type zebrafish mimics the reduction in sensitivity to stimulatory effects of ethanol observed in the fan mutant, whereas, strikingly, strong inhibition of phosphorylation of ERK renders a stimulatory dose of ethanol sedating. Since previous studies in Drosophila and mice show a role of cAMP signaling in suppressing behavioral sensitivity to ethanol, our findings reveal a novel, isoform-specific role of AC signaling in promoting ethanol sensitivity, and suggest that the phosphorylation level of the downstream effector ERK is a critical “gatekeeper” of behavioral sensitivity to ethanol.
Introduction
Diseases due to excessive alcohol intake are a leading cause of morbidity and mortality worldwide. While low doses of ethanol induce euphoria and disinhibition, high doses have depressant effects. Sensitivity to these acute intoxicating effects of ethanol is strongly correlated with the risk of developing alcoholism in humans (Schuckit, 2000). Safe and effective therapies for alcohol-related disorders remain limited (Hester and Miller, 2006; Assanangkornchai and Srisurapanont, 2007). Thus, elucidation of the molecular mechanisms underlying behavioral sensitivity to acute ethanol exposure may shed important light on the cause and prevention of alcoholism in susceptible individuals.
The effects of acute ethanol exposure have been studied in model organisms, including Caenorhabditis elegans (Davies et al., 2003), Drosophila (Moore et al., 1998), zebrafish (Gerlai et al., 2000), and rodents (Phillips and Shen, 1996). These studies have found remarkable similarity among ethanol responses across species. For example, analyses of the cheapdate mutant in Drosophila have indicated that cAMP signaling is necessary to suppress behavioral sensitivity to ethanol (Moore et al., 1998). Reverse genetics studies in mice have found that mutants defective in adenylyl cyclase 1 (AC1) and AC8 display enhanced sensitivity to the sedative effects of ethanol, thus corroborating the findings in Drosophila and furthering the notion that cAMP signaling plays an important role in suppressing behavioral sensitivity to ethanol (Maas et al., 2005).
Forward genetic studies in zebrafish (Driever et al., 1996; Haffter et al., 1996; Dooley and Zon, 2000; Shin and Fishman, 2002; Guo, 2004) represent an important complementary approach to uncover novel molecular mechanisms underlying behavioral sensitivity to ethanol. While high-throughput behavioral assays for ethanol sensitivity have been established (Lockwood et al., 2004), it has been difficult to recover behavioral mutants or underlying molecular lesions. The recent development of insertional mutagenesis shall help with gene cloning (Amsterdam et al., 2004); however, its lower mutagenesis efficiency compared with chemical mutagenesis hampers the recovery of mutants with desired phenotypes.
Here we report a strategy to identify behavioral mutants that are sensitive to ethanol, through the use of a novel and tractable ethanol response observed in zebrafish. Using this ethanol-modulated camouflage response as a screening assay, we isolated the fantasma (fan) mutant, which displayed reduced behavioral sensitivity to the locomotor stimulatory effect of ethanol. Positional cloning reveals that fan disrupts AC5. Expression of fan/ac5 is detectable in the forebrain, where it is required to maintain phosphorylation of extracellular signal-regulated kinase (ERK). Ethanol also affects phosphorylation of ERK in a concentration-dependent manner. Partial inhibition of phosphorylation of ERK in wild-type (WT) zebrafish reduces behavioral sensitivity to the stimulatory effect of ethanol, hence mimicking the phenotype of the fan mutant. More complete inhibition of phosphorylation of ERK in WT, strikingly, renders a stimulatory dose of ethanol sedating. Our findings reveal a novel, isoform-specific role of AC signaling in promoting ethanol sensitivity. Moreover, our results identify ERK signaling as a previously unknown downstream effector of AC in regulating behavioral sensitivity to ethanol, and suggest that the phosphorylation level of ERK is a critical regulator of the dose-dependent response to ethanol.
Materials and Methods
Zebrafish strains, husbandry, and genetic screening.
Two WT strains were used in this study: AB and Tübingen, which were obtained from Zebrafish International Resource Center. All fish were raised and kept in our fish facility at University of California, San Francisco. Fish breeding and maintenance were performed as described previously (Guo et al., 1999a). Embryos were raised in an incubator at 28°C from birth to 7 d postfertilization (dpf), and staged according to Kimmel et al. (1995).
The three-generation genetic screening was performed as previously described (Driever et al., 1996; Haffter et al., 1996). The allele designation for the fan mutant is s2000.
Mapping and positional cloning.
fan mutant fish on the AB background were crossed to Tübingen WT fish. The F1 progeny were raised to adulthood. The heterozygous F1 fish were identified by the ethanol-sensitive camouflage response test using 7 dpf F2 progeny derived from crossing between F1 fish. F2 progeny were collected and sorted into WT and mutant groups based on the ethanol-sensitive camouflage phenotype. Genomic DNA was extracted from WT or fan mutant pools of 20 larvae, and used for PCR with microsatellite Z-marker primers (http://zfin.org/cgi-bin/mapper_select.cgi). Subsequent fine mapping was performed using a panel of 2976 individual fan mutant embryos with more polymorphic Z markers from the MGH genetic map as well as additional polymorphic markers that we identified. The mutation region was narrowed down to a 21.5 kb region in the zKp60A7 (BAC clone: DKEYP-60A). A nonsense mutation was detected in the first exon of the predicted type 5 adenylyl cyclase gene through genomic sequencing. Phylogenetic analysis was performed using PHYLIP release 3.64.
In situ hybridization and immunocytochemistry.
Whole-mount in situ hybridization and immunocytochemistry were performed as previously described (Guo et al., 1999b). For immunostaining on sections, 7 dpf larvae were fixed in 4% paraformaldehyde in PB (phosphate buffer, pH 7.4) overnight at 4°C. The fixed larvae were washed twice for 30 min. each in PB and cryoprotected in 30% sucrose in PB overnight before embedding in OCT (Tissue Tek) and sectioned on a Leica Kryostat. The antibody incubation and detection procedure was done as previously described (Mueller et al., 2006). Immunostained sections of the larval brain were analyzed and designated according to the atlas of early zebrafish brain development (Mueller and Wullimann, 2005). ACTH antibody was obtained from National Hormone and Peptide Program, Harbor-UCLA Medical Center, and was used at 1:1000 dilution. Anti-phospho-ERK antibody was purchased from Cell Signaling and used at 1:1000 dilution. Anti-Hu antibody, which recognizes the Hu protein, which is specifically expressed in differentiating but immature neurons (Mueller and Wullimann, 2002), was purchased from Invitrogen and used at 1:500 dilution. Quantification of fluorescence intensity was performed using MetaMorph software to compute the ratio of integrated fluorescence intensity between phospho-ERK staining and Hu staining. Because the fluorescent signal intensity varies between experiments, the ratio of integrated intensity is only comparable within experiments, but not between experiments.
Assays to measure ethanol uptake and metabolism.
For measuring ethanol uptake, >120 larval fish were kept under light in a 90 mm Petri dish with 80 ml of blue egg water (0.12 g of CaSO4, 0.2 g of Instant Ocean Salts from Aquatic Eco-systems, 30 μl of methylene blue in 1 L of H2O) for 30 min. Subsequently 20 ml of 15% ethanol in egg water was added to achieve final ethanol concentration of 3% in the medium. At 4 min, 10 min, and 16 min time points after adding ethanol, 40 larvae were removed and thoroughly washed with deionized water through a fine mesh at 6 min, 12 min, and 18 min after ethanol treatment. They were briefly dried on a Kimwipe, and subsequently homogenized in 500 μl of cold 50 mm Tris-HCl, pH 7.5. Control larvae without ethanol treatment were prepared using the same method. The homogenates were centrifuged at 14,000 rpm (4°C for 20 min). The ethanol concentration in the supernatant was obtained using the ethanol assay kit (catalog #229-29, Diagnostic Chemicals) following the manufacturer's instructions. The volume of one larva was estimated by volume displacement as ∼1 μl.
Methods similar to those described above were used for measuring ethanol metabolism, except for the following modifications: 20 larval fish were used per condition. After an 18 min ethanol treatment, ethanol was removed by filtering through a fine mesh. Larvae were thoroughly washed with blue egg water. Larval homogenates were prepared at 0, 6, and 12 min after ethanol removal.
Ethanol-related behavioral assays.
The fan mutant was isolated in the *AB genetic background, and was backcrossed to WT *AB strain for more than five generations. To minimize influences of the genetic background and other experimental variables, behavioral analyses were performed on siblings derived from crosses between fan heterozygous fish. Since progeny derived from the heterozygous crossing were of mixed genotypes, we recorded the behavior of individual animals, followed by genotyping with the assistance of an independent observer (supplemental Fig. S13, available at www.jneurosci.org as supplemental material). All behavioral recordings were performed in a 28°C behavioral room, and the movies were analyzed using the Dynamic Image Analysis System (DIAS, Solltec) as described previously (Lockwood et al., 2004) with the following modifications: instead of using 10 animals in a group, individual larvae were used for the behavioral assays so that its genotype can be determined. Briefly, larval zebrafish were acclimated to the behavioral room, and subsequently recorded by digital video camera in a transparent viewing chamber (L × W × H: 5 × 4 × 2 cm) contained in a compartment (L × W × H: 56 × 51 × 39 cm). For 1.5% ethanol treatment, larval zebrafish were transferred to 12 ml of blue egg water and allowed to habituate for 5 min. Movies were recorded immediately after the addition of 3 ml of 7.5% ethanol solution. For 3% ethanol treatment, larval zebrafish were transferred to 9 ml of blue egg water and allowed to habituate for 5 min. Movies were recorded immediately after the addition of 6 ml of 7.5% ethanol solution. For the recovery assay, larval zebrafish were treated with intoxicating 3% ethanol for 18 min. Then they were briefly washed with ethanol-free water, and subsequently transferred into the recording chamber. Movies were recorded exactly at 1 min after removal from ethanol.
To determine the effect of inhibiting phosphorylation of ERK on ethanol-related locomotor behavior, individual larvae were pretreated with different concentrations of PD98059 for 1 h in a 50 ml Falcon tube with 12 ml of blue egg water. The larva together with blue egg water was transferred into the recording tray and allowed to habituate for 2 min in the behavioral setting. Two-minute movies were subsequently recorded for the basal locomotor activity. Movies for ethanol responses were recorded immediately after the addition of 3 ml of 7.5% ethanol solution containing the same concentration of PD98059 as in the pretreatment.
Statistic analysis.
We used SPSS 16.0 for windows to do two-way ANOVA statistical significance analysis. Melanosome dispersal assay was further tested by Dunnett's T3 pairwise comparison post hoc analysis (equal variances not assumed). For the significant difference test between two groups, we used the Student's t test assuming equal variances. Mean values for each group were plotted with error bars representing the SEM.
Results
Ethanol modulates the camouflage response by stimulating melanosome dispersal in larval zebrafish melanocytes
When exposed to ambient light, 5–7 dpf larval zebrafish became significantly lighter in color in ∼20 min. Such lightening was caused by an altered appearance of individually observable melanocytes compared with those of dark-exposed larvae (Fig. 1A,B). Systemic exposure to ethanol, at a physiologically relevant internal concentration and under light, led to robust “enlargement” of melanocytes and hence a “dark” appearance (Fig. 1C,J). Closer examination by high-resolution microscopy in vivo (Fig. 1D–I) and in culture (Fig. 1K) showed that the change of melanocyte appearance was due to movement of intracellular organelles called melanosomes. In the light, melanosomes aggregated toward the nucleus (Fig. 1E,H); in the dark (Fig. 1D,G) or in ethanol (Fig. 1F,I), melanosomes disperse throughout the cytoplasm. The main effects of ethanol (F(2,125) = 38.864, p < 0.001), interval (F(6,125) = 36.821, p < 0.001), ethanol × interval (F(12,125) = 6.490, p < 0.001) were significant. The post hoc test revealed significant effects of both 1.5% (p < 0.001) and 3% ethanol (p < 0.001) compared with 0.5% ethanol treatment, respectively. However, no significant difference was detected between 1.5% and 3% ethanol treatments (p = 0.999). These results indicate that ethanol is able to robustly disperse melanosomes, hence modifying the camouflage response in larval zebrafish. Since the camouflage response involves sensory detection and processing that in turn regulates melanocyte behavior, the mechanism whereby ethanol modifies the camouflage response remains to be understood. In this study, we focused on demonstrating the utility of this assay as a screening paradigm to identify mutants that alter ethanol-modulated behaviors similarly observable in other species.
Figure 1.
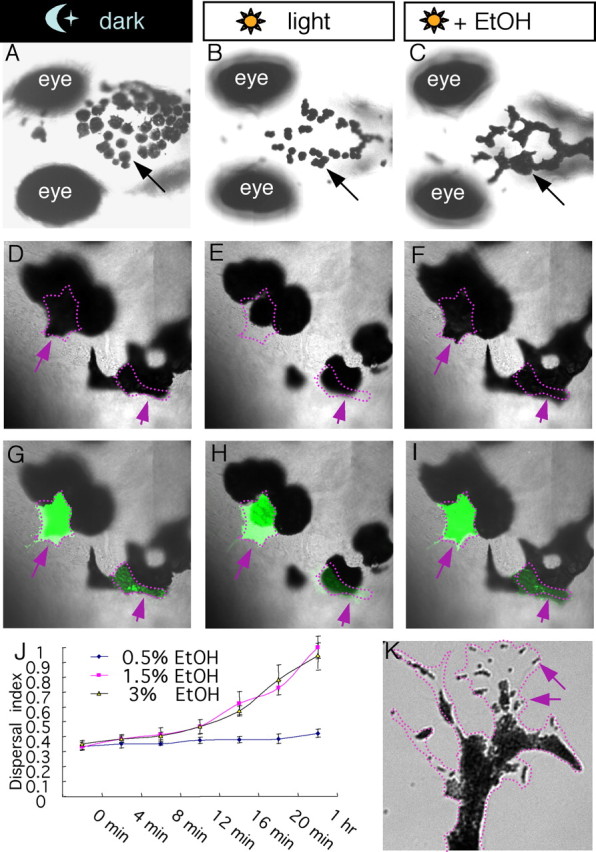
Ethanol modulates the camouflage response in larval zebrafish by stimulating melanosome dispersal. A–C, Nomarski images of 7 dpf larval zebrafish exposed to dark (A), light (B), or ethanol in light (C), showing the appearance of melanocytes on the head region. D–I, In vivo time-lapse Nomarski images (D–F) or Nomarski superimposed with fluorescence images (G–I) showing two GFP-positive melanocytes (arrows) undergoing dispersal in dark (D), aggregation in light (E), and dispersal in ethanol and light (F). J, Quantification of melanocyte dispersal upon treatment with different concentrations of ethanol. K, A snapshot from a high-magnification movie (supplemental Movie S1, available at www.jneurosci.org as supplemental material) of a cultured melanocyte, showing individual organelles inside the melanocytes, called melanosomes (arrows), undergoing aggregation.
The ethanol-modulated camouflage screen recovers the fan mutant, which does not appear “dark” in the presence of ethanol yet exhibits grossly normal morphology and neuronal patterning
We performed a genetic screen to isolate zebrafish mutants with altered sensitivity to the ethanol-modulated camouflage response. After screening ∼1200 clutches of F3 larvae (derived from ∼200 mutagenized F2 family), one mutant was isolated, which was morphologically indistinguishable from WT siblings, but did not appear “dark” in the presence of ethanol (Fig. 2A,B). We named the mutant fantasma (fan; Spanish for ghost), to reflect its ghost-like translucent appearance. Many aspects of development examined thus far appeared normal in the fan mutant (Fig. 2C–F), which grow into viable and fertile adults. Ethanol absorption and metabolism also appeared normal (Fig. 3A,B), indicating that the impaired ethanol response in the fan mutant is not due to a defect in the rate of ethanol uptake or metabolism. The mechanism by which fan affects the ethanol-modulated camouflage response was described in the supplemental text and supplemental Figures S1 and S2 (available at www.jneurosci.org as supplemental material). In this report, we characterize the role of fan in regulating locomotor behavioral sensitivity to ethanol.
Figure 2.
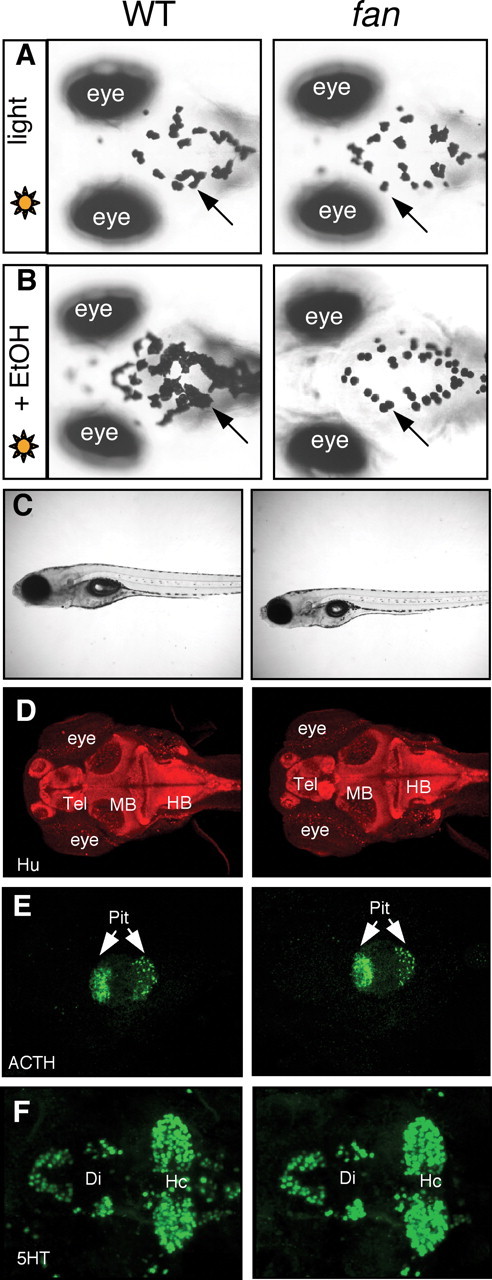
The fan mutant is insensitive to ethanol-modulated camouflage response but displays normal morphology and grossly normal neuronal patterns. A, B, Nomarski images of 7 dpf WT (left) and fan mutant (right) larval zebrafish exposed to light (A) or ethanol in light (B), showing the appearance of melanocytes on the head region. C, Images of live 7 dpf WT and the fan mutant showing normal overall morphology. D–F, Immunostaining with the pan-neuronal anti-Hu antibody (D), anti-adrenocorticotropic hormone (ACTH) (E), and anti-serotonin (5-HT) (F), showing overall normal neuronal patterns in the fan mutant.
Figure 3.
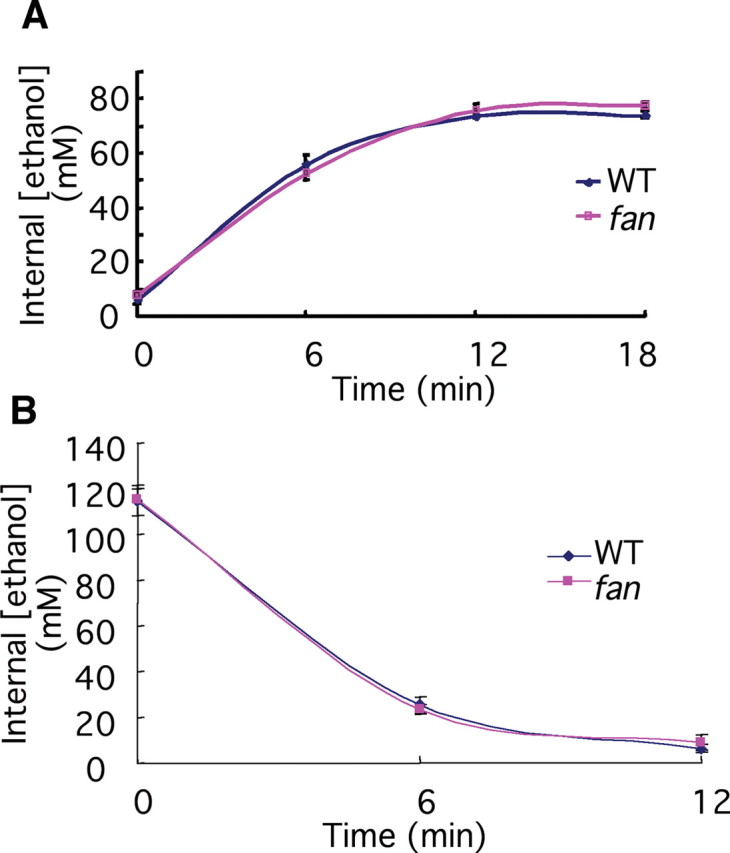
The fan mutant has normal ethanol absorption and metabolism. A, Measurement of systemic ethanol concentration at the defined latency following treatment with 3% ethanol (in the medium) in 7 dpf WT and the fan mutant. B, Measurement of systemic ethanol concentration at the defined latency following removal of ethanol in 7 dpf WT and the fan mutant, pretreated with 3% ethanol for 18 min.
The fan mutant exhibits reduced behavioral sensitivity to ethanol
Upon exposure to a low concentration of ethanol (1.5% v/v in the medium), larval zebrafish display increased locomotor activity. Exposure to a high concentration of ethanol (3% v/v in the medium), however, causes them to move slowly and eventually become sedated. The systemic concentrations of ethanol in larval zebrafish upon these treatments are comparable to what intoxicating humans experience (Lockwood et al., 2004).
The fan mutant displayed normal basal locomotor activity (Fig. 4A); however, the fan mutant gene (F(1,443) = 27.983, p < 0.001) and interval (F(11,443) = 4.347, p < 0.001) exerted significant effects on the stimulatory response to 1.5% ethanol (two-way ANOVA). Upon exposure to a stimulatory dose of ethanol (1.5% v/v in the medium), the fan mutants exhibited a significantly attenuated response compared with their WT siblings (Fig. 4B), suggesting that they are less sensitive to the stimulatory effect of ethanol. Treatment with 3% ethanol significantly decreased locomotor activity in both the fan mutants and their WT siblings (Fig. 4C). The effect of the fan gene (fan vs WT) (F(1,310) = 1.760, p = 0.186) on 3% ethanol-induced intoxication was not significant. This result suggests that the fan mutant is equally susceptible to the locomotor-depressant effects of ethanol.
Figure 4.
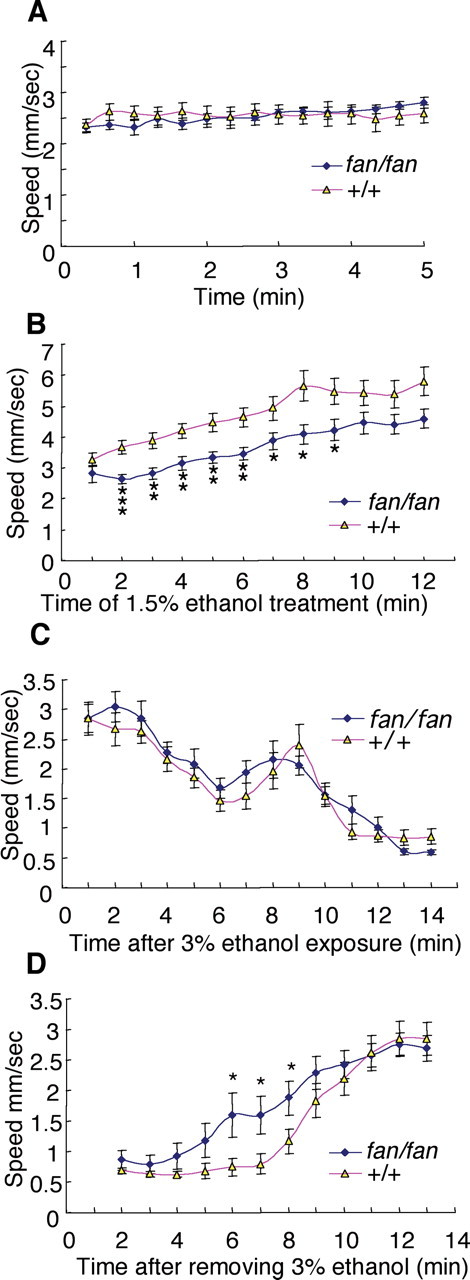
The fan mutant displays reduced behavioral sensitivity to ethanol. A, The fan mutant shows normal basal locomotor activity. B, The fan mutant is less sensitive to ethanol-evoked hyperlocomotor activity (right). *p < 0.05, **p < 0.01, ***p < 0.001, n = 28 and 35 for fan/fan and +/+, respectively. C, Locomotor activity of WT sibling and the fan mutant after treatment with 3% ethanol in the medium. Ethanol-induced hypo-locomotion is not significantly different between WT sibling and the fan mutant (n = 11 for each genotype). D, Locomotor activity of WT sibling and the fan mutant recovering from 18 min treatment with 3% ethanol in the medium. The fan mutant recovers significantly faster than WT sibling (*p < 0.05, n = 37 and 36 for fan/fan and +/+, respectively).
We next determined the sensitivity of fan mutant to the sedative effect of ethanol. Sedation was induced in the fan mutants and their WT siblings by exposure to a high concentration of ethanol (3% v/v in the medium) until all animals stopped moving (usually within ∼20 min), after which they were transferred to a fresh ethanol-free medium. Interestingly, the fan mutants exhibited signs of recovery from ethanol-induced sedation at a significantly shorter latency than their WT siblings. Signs of recovery included the ability to regain locomotor activity (Fig. 4D), as well as postural balance (data not shown). The effects of the fan gene (F(1,869) = 12.968, p < 0.001) and interval (F(11,869) = 26.744, p < 0.001) on recovery are significant; however, fan gene × interval interactions were not significant (F(11,869) = 1.227, p = 0.264). Together, our behavioral analyses show that the fan mutant has a significantly reduced sensitivity to the stimulatory effect of ethanol, and appears also to recover faster from ethanol-induced sedation.
fan encodes AC5, an isoform expressed in the brain
To identify which gene is disrupted by the fan mutation, we performed positional cloning. Genetic mapping using bulk segregant analyses located fan to linkage group (LG) 9 (Fig. 5A). Recombination analyses using ∼3000 individual mutant larvae narrowed down the molecular lesion to a ∼25 kb genomic region, which encompassed the 3′ end of protein tyrosine phosphatase-like, member b (ptplb), as well as the first 5′ exon of an ac gene. Sequencing analyses revealed a single nucleotide change from T to G (nucleotide #893 from the start codon ATG), leading to a premature stop codon (Leu298→Stop) in the first exon of the ac gene (Fig. 5B,C). The mutant ac gene encodes a severely truncated protein with no AC domain.
Figure 5.

fan disrupts type 5 adenylyl cyclase that is expressed in the brain. A, Map of the fan mutation. Bulk segregant and individual mutant recombination analyses map fan to a ∼21.5 kb region on chromosome 9, between polymorphic markers PM2 and PM6, which encompasses the 3′ exons of ptplb and 5′ first exon of an adenylyl cyclase gene. B, Sequence chromatograms showing the mutated nucleotide and amino acid in the ac5 gene of the fan mutant. C, Secondary structure diagram of the AC5 protein showing that the fan mutation leads to a truncated adenylyl cyclase protein without the adenylyl cyclase transmembrane domain 2 (M2) and both cytoplasmic enzymatic domains (C1 and C2). D, Phylogenetic analysis indicates that this adenylyl cyclase belongs to the ac5 family. E, In situ hybridization analysis shows that fan/ac5 is expressed in the brain proper in larval zebrafish. F, Quantitative RT-PCR analysis using RNAs isolated from the head or whole fish indicates that fan/ac5 is expressed in the head.
Phylogenetic analyses suggest that this AC is most homologous to the mammalian AC5 (Fig. 5D). It shares 74% overall amino acid identity with the human AC5. Within the catalytic domain, the amino acid identity reaches 92% (C1) and 90% (C2). Moreover, both the human ac5 and this zebrafish ac are located next to the ptplb gene, indicating conserved synteny. Therefore, we conclude that this zebrafish ac gene is an ortholog of the mammalian ac5.
To further verify that fan indeed encodes the zebrafish AC5 ortholog, a morpholino-modified antisense oligonucleotide was designed to interfere with the splicing of the ac5 transcript. Injection of this antisense oligonucleotide into WT phenocopied the camouflage response to ethanol observed in the fan mutant (supplemental Fig. S3, available at www.jneurosci.org as supplemental material). fan/ac5 displayed adenylyl cyclase activity when transfected into cultured HEK-293 cells (t(10) = 8.322, p < 0.001). Moreover, using a previously described method (Yoshimura and Tabakoff, 1995), we found that its AC activity can be further stimulated by the addition of ethanol in the presence of the prostaglandin E1 (PGE1) ligand (supplemental Fig. S4, available at www.jneurosci.org as supplemental material) (t(8) = 3.320, p = 0.011). These results suggest that the fan mutant disrupts a gene encoding an ethanol-responsive zebrafish AC5.
Whole-mount in situ hybridization showed low-level but detectable expression of fan/ac5 throughout the developing larvae, including the brain and heart (Fig. 5E). RT-PCR analysis further confirmed a moderately enriched expression of fan/ac5 in the head region (Fig. 5F).
fan/ac5 is required to maintain a normal level of phosphorylation of ERK in forebrain structures, including the telencephalon and hypothalamus
The downstream targets of cAMP signaling that determine the behavioral sensitivity to ethanol is not known. Since the ERK signaling cascade (Shaul and Seger, 2007) can be a downstream regulatory target of cAMP signaling in cell culture studies of proliferation and organelle dynamics (Stork and Schmitt, 2002; Deacon et al., 2005), and moreover, was affected in the fan-mutant melanocytes (see the supplemental material, available at www.jneurosci.org), we examined whether phosphorylation of ERK might be affected in the fan/ac5 mutant brain. Because phospho-ERK is dynamic and often exhibits a highly tissue-specific pattern, we resorted to immunocytochemistry to examine phospho-ERK levels in the brain.
Immunostaining of sectioned larval zebrafish brains with an antibody specific for ERK activated by dual phosphorylation at Thr-202 and Tyr-204 (phospho-ERK) (Sturgill et al., 1988; Hong et al., 2006; Zhu et al., 2008) revealed strong immunoreactivity in regions of the forebrain, including the olfactory bulb, telencephalon (pallium and subpallium), thalamic eminence (EmT), preoptic region, and hypothalamic areas, with the staining being most prominent in the telencephalon and hypothalamus (Fig. 6B,C; supplemental Fig. S5, available at www.jneurosci.org as supplemental material). Other brain regions showed relatively low phospho-ERK levels (data not shown). Such immunoreactivity in the forebrain was markedly reduced following acute treatment with the inhibitor of MEK (a MAPKK), which phosphorylates ERK (a MAPK) at these sites (Fig. 6D,E), suggesting that the immunoreactivity is specific to the phospho-ERK epitopes.
Figure 6.
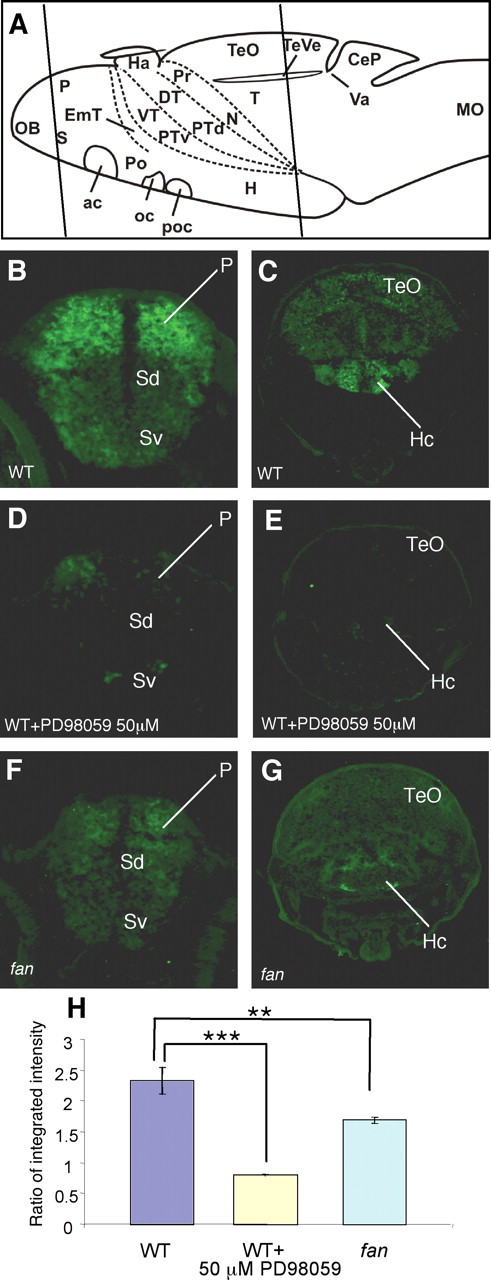
In the telencephalon and hypothalamus, fan/ac5 is required to maintain phosphorylation of ERK. A, Schemata showing anatomical regions of the larval zebrafish brain. Line 1 indicates sectioned regions shown in B, D, and F, and line 2 indicates sectioned regions shown in C, E, and G. B, C, Phospho-ERK immunoreactivity in the WT telencephalic (B) and hypothalamic (C) regions. Strong phospho-ERK staining is detected in the dorsal telencephalon (also know as the pallium) and the hypothalamus, whereas other brain regions show relatively low immunoreactivity. D, E, Phospho-ERK immunoreactivity in WT treated with 50 μm PD98059 for 1 h. Significant reduction of phospho-ERK staining is observed in both the pallium (D) and the hypothalamus (E) compared with untreated WT. F, G, Phospho-ERK immunoreactivity in the fan mutant telencephalic (F) and hypothalamic (G) regions, showing a significant reduction of immunoreactivity in both regions compared with a WT sibling. H, Quantification of immunofluorescence intensity in the pallial and hypothalamic regions in various conditions. The y-axis represents average ratio of integrated intensity between sectioned phospho-ERK and Hu immunostaining images. **p < 0.01, ***p < 0.005 (n = 15 brain sections from 3 animals in each assay condition). P, Pallium; SD, Dorsal division of subpallium; Sv, Ventral division of subpallium; TeO, tectum opticum; Hc, caudal hypothalamus.
The teleostean pallium (dorsal telencephalon) is largely composed of limbic structures such as the pallial amygdala (Dm, medial zone of dorsal telencephalic area) and hippocampus-like region (Dl, the lateral zone of the dorsal telencephalon) (Wullimann et al., 1996; Wullimann and Mueller, 2004; Northcutt, 2006). The molecular organization of the teleostean subpallium (Mueller et al., 2008) and the ascending dopaminergic system to the striatum (Rink and Wullimann, 2001) resemble the mammalian situation. The basal ganglia-related part of the subpallium is known to be important for locomotor and motivational behavior, whereas the preoptic region and hypothalamus are functionally related and together control somatic homeostasis in normal as well as stressful conditions. Since the 7-d-old zebrafish brain is not fully developed, impeding histological identification of specific brain nuclei, we combined phospho-ERK staining with an immunolabeling of the Hu protein, which is specifically expressed in differentiating but immature neurons (Mueller and Wullimann, 2002). The morphological appearance, low Hu protein expression level, and location of phospho-ERK-immunoreactive cells remote from the periventricular proliferative zones (supplemental Fig. S6, available at www.jneurosci.org as supplemental material) suggest that they are differentiated neurons in the forebrain.
Phospho-ERK immunoreactivity in both the telencephalon and hypothalamus was significantly decreased in the fan mutant (Fig. 6F–H) compared with WT siblings (Fig. 6B,C) (supplemental Fig. S5, available at www.jneurosci.org as supplemental material) (t(28) = 2.933, p = 0.007). The decrease was not as marked as what was observed in the animals treated with 50 μm PD98059 (Fig. 6D,E), suggesting a partial loss of phospho-ERK in the fan mutant brain. Since the distribution of unphosphorylated ERK is rather broad and not subject to dynamic regulation as in the case of phospho-ERK, we examined ERK protein levels by Western blot, and found no difference between WT and the fan mutant larvae (supplemental Fig. S7, available at www.jneurosci.org as supplemental material). Together, these results indicate that fan/ac5 is required for normal level of phosphorylation of ERK in forebrain structures, including the telencephalon and hypothalamus.
Acute ethanol exposure alters phosphorylation of ERK in the brain in a concentration-dependent manner
Acute exposure to ethanol is known to influence the level of phosphorylation of ERK in the mammalian brain, and different studies have found either an increase (Bachtell et al., 2002; Sharko and Hodge, 2007) or a decrease (Davis et al., 1999; Bachtell et al., 2002; Kalluri and Ticku, 2002; Tsuji et al., 2003; Chandler and Sutton, 2005; Ohrtman et al., 2006; Sharko and Hodge, 2007) of phospho-ERK upon acute ethanol exposure. To determine whether ethanol can modify phosphorylation of ERK in the zebrafish brain, we examined phospho-ERK immunoreactivity in larval zebrafish treated with ethanol. Treatment with 1.5% v/v ethanol, a stimulatory dose, increased phospho-ERK immunoreactivity in the forebrain (t(28) = 2.387, p = 0.024), while 3% v/v ethanol, a sedative dose, decreased phospho-ERK immunoreactivity (t(28) = 3.620, p = 0.001), suggesting a dose-dependent effect of ethanol on phosphorylation of ERK in the brain (supplemental Fig. S8, available at www.jneurosci.org as supplemental material).
Since the fan mutant showed a reduced level of phospho-ERK in the forebrain and a reduced sensitivity to the stimulatory effect of 1.5% ethanol, we next determined whether the increase of phospho-ERK by 1.5% ethanol required Fan/AC5. We found that treatment with 1.5% ethanol did not significantly alter phospho-ERK immunoreactivity in the fan mutant brain (supplemental Fig. S9, available at www.jneurosci.org as supplemental material) (t(30) = 1.446, p = 0.159). This result suggests that fan/ac5 is required for the increased phosphorylation of ERK in the brain induced by a stimulatory dose of ethanol.
Partial inhibition of phosphorylation of ERK reduces behavioral sensitivity to ethanol
Reduced phosphorylation of ERK in the fan/ac5 mutant brain might be the cause of the reduced sensitivity to the stimulatory effect of ethanol observed in the fan/ac5 mutant. Alternatively, it might be a mere correlation. An ideal experiment to distinguish these possibilities would be to rescue the fan/ac5 mutant behavioral phenotype by increasing phospho-ERK levels in the mutant brain. However, the lack of tools such as specific chemical agonists or conditional lines allowing specific activation of ERK in the brain precluded the possibility of carrying out such experiments at present. Therefore, we asked the question in a converse way: would inhibiting phosphorylation of ERK in WT affect behavioral sensitivity to ethanol in a way that would “phenocopy” the fan mutant? If so, it would strongly suggest that the ERK signaling impairment in the fan mutant is responsible for its altered ethanol sensitivity.
We first inhibited phosphorylation of ERK partially in the WT larvae, to mimic the partial reduction in phosphorylation of ERK observed in the fan/ac5 mutant brain. After testing various concentrations of the compound (supplemental Fig. S10, available at www.jneurosci.org as supplemental material), we found significant effects of PD98059 treatment (F(3,485) = 55.657, p < 0.001), interval (F(9,485) = 9.706, p < 0.001), and PD98059 treatment × interval interaction (F(27,485) = 4.739, p < 0.001) on the stimulatory effect of 1.5% ethanol. We also found that animals treated with 1 μm PD98059 exhibited a partial reduction in phosphorylation of ERK in the brain (t(34) = 2.099, p = 0.043) (supplemental Fig. S11, available at www.jneurosci.org as supplemental material) and normal basal locomotor activity (Fig. 7A). Upon addition of 1.5% ethanol in the medium, whereas control animals showed an ethanol-induced hyperlocomotor activity, animals pretreated with 1 μm PD98059 had a time-dependent attenuation of the response, starting at ∼7 min after ethanol exposure (Fig. 7B). The effects of 1 μm PD98059 treatment (F(1,334) = 13.967, p < 0.001) and interval (F(11,334) = 16.863, p < 0.001) were significant. Such a reduction in behavioral sensitivity to ethanol resembled the fan mutant response to 1.5% ethanol, albeit at a slower time scale, as the reduction of locomotor stimulation in the fan mutant was evident ∼2 min after ethanol exposure (Fig. 4B). This difference in time course could be due to the possibility that the magnitude of the decrement in phosphorylation of ERK and consequently ERK activity in the fan mutant was not precisely recapitulated in the larvae treated with 1 μm PD98059.
Figure 7.

Pharmacological inhibition of phosphorylation of ERK alters behavioral sensitivity to ethanol. A, C, Basal locomotor activity of PD98059-treated (blue lines) animals is not significantly different from control (red lines) (n = 15 for A, and n = 12 for C). B, Partial (1 μm PD98059) inhibition of phosphorylation of ERK reduces the locomotor stimulatory activity of 1.5% ethanol (*p < 0.05, **p < 0.01, n = 14 for each condition). D, Severe inhibition of ERK phosphorylation (with 50 μm PD98059) renders a normally stimulatory dose of ethanol sedating (**p < 0.01, ***p < 0.001, n = 12 and 15 for PD98059-treated and DMSO-treated control, respectively).
Strong inhibition of phosphorylation of ERK renders a stimulatory dose of ethanol sedating
When phosphorylation of ERK was severely inhibited by treatment with a high concentration of PD98059 (50 μm) (Fig. 6D,E), we made a striking observation. While such treatment had no effect on basal locomotor activity (Fig. 7C), it significantly depressed locomotor activity upon the addition of 1.5% ethanol in the medium, which should be a stimulatory dose in WT larvae (Fig. 7D). The results of two-way ANOVA revealed significant main effects of 50 μm PD98059 treatment (F(1,161) = 138.263, p < 0.001) and interval (F(5,161) = 4.361, p = 0.001) on the locomotor activity. Thus, strong inhibition of ERK phosphorylation rendered a stimulatory dose of ethanol sedating.
An examination of phospho-ERK immunoreactivity in animals treated with both 50 μm PD98059 and 1.5% ethanol did not reveal a further decrease compared with animals treated with 50 μm PD98059 alone (supplemental Fig. S12, available at www.jneurosci.org as supplemental material), suggesting that the observed striking behavioral effect upon addition of ethanol is not simply due to a further reduction of phospho-ERK levels by ethanol. Together, our findings suggest that the level of phosphorylation of ERK is critical for behavioral sensitivity to ethanol.
Discussion
We found that ethanol robustly modulates the innate camouflage response in larval zebrafish. Using this ethanol-sensitive camouflage response as a screening assay, we have identified the fan mutant that exhibited a reduced behavioral sensitivity to ethanol. This result has validated our hypothesis that genetic screening using the simple and tractable ethanol-sensitive camouflage response assay can uncover mutants that alter behavioral responses to ethanol, which are universally observable in many species, including humans. Positional cloning reveals that the fan mutant disrupts AC5. While previous work shows that cAMP signaling is critical to suppress behavioral sensitivity to ethanol, our result surprisingly reveals a novel and likely AC isoform-specific role of cAMP signaling in promoting behavioral sensitivity to ethanol. Finally, downstream targets of ACs that determine the sensitivity to ethanol are unknown. Through the analysis of the phosphorylation of ERK, we suggest that this signaling component acts as a downstream effector of AC5 and a critical regulator of behavioral sensitivity to ethanol.
Behavioral sensitivity to ethanol is not simply correlated with cellular cAMP levels
Through isolation and characterization of the fan mutant zebrafish, we found that disruption of cAMP signaling by mutating AC5 leads to a reduced behavioral sensitivity to ethanol, in that the mutant is less sensitive to the stimulatory effect of ethanol, and can recover faster from ethanol-induced sedation. This phenotype of the fan/ac5 mutant stands in stark contrast to the increased ethanol sensitivity observed in Drosophila mutants that are defective in cAMP signaling (Moore et al., 1998) or mouse mutants lacking AC1 and 8 (Maas et al., 2005). While we cannot categorically exclude that cAMP signaling may play a different role in mediating ethanol sensitivity in zebrafish, given its conserved action from flies to mammals, this is an unlikely scenario. Thus, our findings indicate that behavioral sensitivity to ethanol is not simply correlated with cellular cAMP levels. This conclusion is particularly important when considering the use of pharmacotherapy to target cAMP signaling to thereby modulate behavioral sensitivity to ethanol, as it uncovers the in vivo complexity of the involvement of cAMP signaling in ethanol sensitivity.
While only a single AC gene is detected in invertebrates, 10 different AC isoforms have been identified in vertebrates (Sunahara and Taussig, 2002). How different AC isoforms differentially regulate behavioral sensitivity to ethanol is an important question for future investigation. It is possible that different AC isoforms are expressed in distinct neuronal types. Even for the AC isoforms that are expressed in the same cell types, they may be coupled to distinct downstream effector molecules. We show in this study that Fan/AC5 regulates ERK signaling. At present it is not known what signaling pathways are regulated by cAMP in Drosophila or in mice downstream of AC1 or AC8.
ERK signaling as a downstream effector of AC5 in mediating behavioral sensitivity to ethanol
Our results identify ERK signaling as an important downstream effector of AC5 in mediating ethanol sensitivity. First, phosphorylation of ERK in the brain is reduced in the fan mutant. Although this decrease is mild compared with that caused by administration of the MEK inhibitor PD98059 at 50 μm, this could be due to partial compensation by other ACs that are expressed in the same cell/tissue types as AC5, or other molecules that regulate ERK signaling. Second, since both Fan/AC5 and ERK are broadly expressed in the larval brain,
Fan/AC5 is likely to be a permissive regulator of phospho-ERK levels in the brain. The distinct spatial distribution of phospho-ERK immunoreactivity may reflect spatially and temporally dynamic signaling events in the brain. Last but not least, mild inhibition of phosphorylation of ERK mimics the locomotor sensitivity to ethanol observed in the fan mutant, further supporting the notion that although AC5 leads to a moderate decrease in phosphorylation of ERK, it is nevertheless functionally significant.
The level of phosphorylation of ERK as a critical “gatekeeper” of behavioral sensitivity to ethanol
ERK signaling has been shown to play important roles in cocaine addiction in rodents (Lu et al., 2006; Girault et al., 2007). Studies in rodents also suggest that ERK signaling may underlie ethanol-induced neuroplasticity. However, effects of ethanol on ERK signaling appear complex, in that different studies have found both an increase (Bachtell et al., 2002; Sharko and Hodge, 2007) and a decrease (Davis et al., 1999; Kalluri and Ticku, 2002; Tsuji et al., 2003; Chandler and Sutton, 2005; Ohrtman et al., 2006) of brain phospho-ERK levels upon acute ethanol exposure. Such a discrepancy may be due to variations in ethanol dose, brain regions examined, age, genetic background, or other handling-related issues. In contrast to acute ethanol treatment, a consistent increase in phosphorylation of ERK is detected during ethanol withdrawal (Sanna et al., 2002; Roberto et al., 2003; Chandler and Sutton, 2005) or cue-induced reinstatement of alcohol seeking behavior in specific limbic brain regions, including the basolateral amygdala and nucleus accumbens shell (Radwanska et al., 2008; Schroeder et al., 2008). Blockade of phosphorylation of ERK is suggested to attenuate the reinforcing property of ethanol and in turn lead to a compensatory increase of ethanol intake (Hansson et al., 2008; Faccidomo et al., 2009).
In this study, we found that ethanol altered the phosphorylation status of ERK in the zebrafish forebrain in a dose-dependent manner: a stimulatory low dose of ethanol increased brain phospho-ERK, whereas a sedating high dose decreased brain phospho-ERK. Moreover, pharmacological inhibition of phosphorylation of ERK, while not affecting basal locomotor activity, has a significant impact on locomotor sensitivity to ethanol. First, partial inhibition of phosphorylation of ERK reduces the locomotor stimulatory effect of ethanol. This result suggests that an optimal level of phosphorylation of ERK is required for a full stimulatory effect of ethanol. Second, marked inhibition of phosphorylation of ERK renders a stimulatory dose of ethanol sedating. This observation suggests that phosphorylation of ERK, even at a suboptimal level (as in the fan mutant or upon treatment with 1 μm PD98059), plays a role to counteract the sedative effect of ethanol.
How does 1.5% ethanol (stimulatory dose) plus 50 μm PD98059 lead to sedation? Since the addition of ethanol does not appear to further decrease phosphorylation of ERK in the brain compared with 50 μm PD98059 treatment alone, the observed sedation is unlikely due to a further reduction in phosphorylation of ERK. Although multiple possibilities exist, we favor the model of a common downstream target (or targets), which are regulated by both phospho-ERK and ethanol. In this scenario, one may envision the role of ERK analogous to a “checkpoint” or a “gatekeeper,” the removal of which alone may not have an effect, but could have a drastic consequence in combination with other stimulus or challenge (in this case, ethanol). What might such target(s) of ERK and ethanol be in mediating the sedative effect of ethanol? Previous studies suggest that the sedative effect of ethanol is likely mediated by its ability to inhibit the activity of NMDA receptor and potentiate the activity of GABA receptors (Lovinger et al., 1989; Harris et al., 1995; Diamond and Gordon, 1997). Along these lines, it is interesting to note that the NMDA receptor complex was recently found to contain components of ERK signaling pathway (Husi et al., 2000), and phosphorylation by ERK was shown to play a role in inhibiting GABAA receptor function (Bell-Horner et al., 2006).
A model for the role of Fan/AC5 and ERK in mediating the stimulatory versus sedative effects of ethanol in zebrafish
The neurostimulatory effect of low doses of ethanol manifests as disinhibition or euphoria in humans and locomotor stimulation in animal systems (Phillips and Shen, 1996). Both the dopamine and the opioid systems are involved in mediating such stimulatory effect of ethanol (Phillips and Shen, 1996; Herz, 1997). On the other hand, the neurodepressive effect of high doses of ethanol manifests as sedation in both humans and animal systems, and is likely mediated by inhibition of NMDA receptor and potentiation of GABA receptors (Lovinger et al., 1989; Harris et al., 1995; Diamond and Gordon, 1997). How the dynamics of the action of ethanol shifts in a concentration-dependent manner is unclear.
Consistent with the established importance of ERK activation for cocaine (Lu et al., 2006) and ethanol (Hansson et al., 2008; Faccidomo et al., 2009) reinforcement in rodents, our data suggest that Fan/AC5 together with ERK are important to promote the stimulatory effect of ethanol (Fig. 8A). They may act downstream of dopamine and/or opioid receptor signaling, which are known to be important for the stimulatory effect of ethanol in rodents (Phillips and Shen, 1996; Herz, 1997). Our data also suggest that ERK signaling is critical to counteract the sedative effect of ethanol, because a blockade of phosphorylation of ERK renders a stimulatory dose of ethanol sedating (Fig. 8B). In this case, phospho-ERK may modify its targets (e.g., NMDA receptor and/or GABA receptor), rendering them resistant to the effect of ethanol thus allowing the stimulatory effect to manifest. High doses of ethanol, however, can inhibit phosphorylation of ERK, and in turn lead to modifications of NMDA and GABA receptors (Lovinger et al., 1989; Harris et al., 1995; Diamond and Gordon, 1997).
Figure 8.

A proposed model to depict the role of Fan/AC5 and phosphorylation of ERK in mediating the acute dose-dependent effect of ethanol. A, A stimulatory dose of ethanol activates target(s) (e.g., dopamine and/or opioid receptors). This activation increases intracellular cAMP through Fan/AC5. Fan/AC5 in turn promotes the phosphorylation of ERK, which acts via yet-to-be identified target(s), leading to increased neuronal activity in locomotor regulatory circuits and accordingly an increase in locomotor activity. B, A sedative dose of ethanol inhibits the phosphorylation of ERK. This inhibition abolishes the ability of phospho-ERK to counteract the effect of ethanol on the target(s) (e.g., inhibition of NMDA and/or potentiation of GABA receptors). Together this leads to decreased neuronal activity in locomotor regulatory circuits and accordingly a decrease in locomotor activity.
AC5 is evolutionarily conserved and the fan mutant zebrafish are adult viable and fertile, suggesting that ac5 may be a good candidate gene to be evaluated for its possible involvement in the pathogenesis of human alcoholism. Acute inhibition of phosphorylation of ERK has a profound effect on ethanol sensitivity without affecting basal locomotor activity, suggesting that polymorphisms in genes of the ERK signaling pathway may also contribute to susceptibility of developing alcoholism in humans.
Footnotes
This work was supported by the David and Lucile Packard Foundation, Sandler Family Foundation, and National Institutes of Health Grant AA016021. We thank Michael Munchua for fish care; B. Lau, S. Lee, and K. Krishnan for assistance with the genetic screen; Kurt Thorn and University of California, San Francisco Nikon Imaging Center for assistance with imaging; Drs. U. Heberlein, L. Jan, B. Lu, and E. Hurlock for helpful comments on the manuscript; and other members of the Guo laboratory for discussions.
References
- Amsterdam A, Nissen RM, Sun Z, Swindell EC, Farrington S, Hopkins N. Identification of 315 genes essential for early zebrafish development. Proc Natl Acad Sci U S A. 2004;101:12792–12797. doi: 10.1073/pnas.0403929101. [DOI] [PMC free article] [PubMed] [Google Scholar]
- Assanangkornchai S, Srisurapanont M. The treatment of alcohol dependence. Curr Opin Psychiatry. 2007;20:222–227. doi: 10.1097/YCO.0b013e3280fa837d. [DOI] [PubMed] [Google Scholar]
- Bachtell RK, Tsivkovskaia NO, Ryabinin AE. Alcohol-induced c-Fos expression in the Edinger-Westphal nucleus: pharmacological and signal transduction mechanisms. J Pharmacol Exp Ther. 2002;302:516–524. doi: 10.1124/jpet.102.036046. [DOI] [PubMed] [Google Scholar]
- Bell-Horner CL, Dohi A, Nguyen Q, Dillon GH, Singh M. ERK/MAPK pathway regulates GABAA receptors. J Neurobiol. 2006;66:1467–1474. doi: 10.1002/neu.20327. [DOI] [PubMed] [Google Scholar]
- Chandler LJ, Sutton G. Acute ethanol inhibits extracellular signal-regulated kinase, protein kinase B, and adenosine 3′:5′-cyclic monophosphate response element binding protein activity in an age- and brain region-specific manner. Alcohol Clin Exp Res. 2005;29:672–682. doi: 10.1097/01.alc.0000158935.53360.5f. [DOI] [PubMed] [Google Scholar]
- Davies AG, Pierce-Shimomura JT, Kim H, VanHoven MK, Thiele TR, Bonci A, Bargmann CI, McIntire SL. A central role of the BK potassium channel in behavioral responses to ethanol in C. elegans. Cell. 2003;115:655–666. doi: 10.1016/s0092-8674(03)00979-6. [DOI] [PubMed] [Google Scholar]
- Davis MI, Szarowski D, Turner JN, Morrisett RA, Shain W. n vivo activation and in situ BDNF-stimulated nuclear translocation of mitogen-activated/extracellular signal-regulated protein kinase is inhibited by ethanol in the developing rat hippocampus. Neurosci Lett. 1999;272:95–98. doi: 10.1016/s0304-3940(99)00572-8. [DOI] [PubMed] [Google Scholar]
- Deacon SW, Nascimento A, Serpinskaya AS, Gelfand VI. Regulation of bidirectional melanosome transport by organelle bound MAP kinase. Curr Biol. 2005;15:459–463. doi: 10.1016/j.cub.2004.12.074. [DOI] [PubMed] [Google Scholar]
- Diamond I, Gordon AS. Cellular and molecular neuroscience of alcoholism. Physiol Rev. 1997;77:1–20. doi: 10.1152/physrev.1997.77.1.1. [DOI] [PubMed] [Google Scholar]
- Dooley K, Zon LI. Zebrafish: a model system for the study of human disease. Curr Opin Genet Dev. 2000;10:252–256. doi: 10.1016/s0959-437x(00)00074-5. [DOI] [PubMed] [Google Scholar]
- Driever W, Solnica-Krezel L, Schier AF, Neuhauss SCF, Malicki J, Stemple DL, Stainier DYR, Zwartkruis F, Abdelilah S, Rangini Z, Belak J, Boggs C. A genetic screen for mutations affecting embryogenesis in zebrafish. Development. 1996;123:37–46. doi: 10.1242/dev.123.1.37. [DOI] [PubMed] [Google Scholar]
- Faccidomo S, Besheer J, Stanford PC, Hodge CW. Increased operant responding for ethanol in male C57BL/6J mice: specific regulation by the ERK(1/2), but not JNK, MAP kinase pathway. Psychopharmacology (Berl) 2009;204:135–147. doi: 10.1007/s00213-008-1444-9. [DOI] [PMC free article] [PubMed] [Google Scholar]
- Gerlai R, Lahav M, Guo S, Rosenthal A. Drinks like a fish: zebrafish (Danio rerio) as a behavior genetic model to study alcohol effects. Pharmacol Biochem Behav. 2000;67:773–782. doi: 10.1016/s0091-3057(00)00422-6. [DOI] [PubMed] [Google Scholar]
- Girault JA, Valjent E, Caboche J, Hervé D. ERK2: a logical AND gate critical for drug-induced plasticity? Curr Opin Pharmacol. 2007;7:77–85. doi: 10.1016/j.coph.2006.08.012. [DOI] [PubMed] [Google Scholar]
- Guo S. Linking genes to brain, behavior, and neurological diseases: what can we learn from zebrafish? Genes Brain Behav. 2004;3:63–74. doi: 10.1046/j.1601-183x.2003.00053.x. [DOI] [PubMed] [Google Scholar]
- Guo S, Wilson SW, Cooke S, Chitnis AB, Driever W, Rosenthal A. Mutations in the zebrafish unmask shared regulatory pathways controlling the development of catecholaminergic neurons. Dev Biol. 1999a;208:473–487. doi: 10.1006/dbio.1999.9204. [DOI] [PubMed] [Google Scholar]
- Guo S, Brush J, Teraoka H, Goddard A, Wilson SW, Mullins MC, Rosenthal A. Development of noradrenergic neurons in the zebrafish hindbrain requires BMP, FGF8, and the homeodomain protein Soulless/Phox2a. Neuron. 1999b;24:555–566. doi: 10.1016/s0896-6273(00)81112-5. [DOI] [PubMed] [Google Scholar]
- Haffter P, Granato M, Brand M, Mullins MC, Hammerschmidt M, Kane DA, Odenthal J, van Eeden FJM, Jiang YJ, Heisenberg CP, Kelsh RN, Furutani-Seiki M, Vogelsang E, Beuchle D, Schach U, Fabian C, Nüsslein-Volhard C. The identification of genes with unique and essential function in the development of the zebrafish, Danio rerio. Development. 1996;123:1–36. doi: 10.1242/dev.123.1.1. [DOI] [PubMed] [Google Scholar]
- Hansson AC, Rimondini R, Neznanova O, Sommer WH, Heilig M. Neuroplasticity in brain reward circuitry following a history of ethanol dependence. Eur J Neurosci. 2008;27:1912–1922. doi: 10.1111/j.1460-9568.2008.06159.x. [DOI] [PMC free article] [PubMed] [Google Scholar]
- Harris RA, Proctor WR, McQuilkin SJ, Klein RL, Mascia MP, Whatley V, Whiting PJ, Dunwiddie TV. Ethanol increases GABAA responses in cells stably transfected with receptor subunits. Alcohol Clin Exp Res. 1995;19:226–232. doi: 10.1111/j.1530-0277.1995.tb01496.x. [DOI] [PubMed] [Google Scholar]
- Herz A. Endogenous opioid systems and alcohol addiction. Psychopharmacology. 1997;129:99–111. doi: 10.1007/s002130050169. [DOI] [PubMed] [Google Scholar]
- Hester RK, Miller JH. Computer-based tools for diagnosis and treatment of alcohol problems. Alcohol Res Health. 2006;29:36–40. [PMC free article] [PubMed] [Google Scholar]
- Hong CC, Peterson QP, Hong JY, Peterson RT. Artery/vein specification is governed by opposing phosphatidylinositol-3 kinase and MAP kinase/ERK signaling. Curr Biol. 2006;16:1366–1372. doi: 10.1016/j.cub.2006.05.046. [DOI] [PMC free article] [PubMed] [Google Scholar]
- Husi H, Ward MA, Choudhary JS, Blackstock WP, Grant SG. Proteomic analysis of NMDA receptor-adhesion protein signaling complexes. Nat Neurosci. 2000;3:661–669. doi: 10.1038/76615. [DOI] [PubMed] [Google Scholar]
- Kalluri HS, Ticku MK. Ethanol-mediated inhibition of mitogen-activated protein kinase phosphorylation in mouse brain. Eur J Pharmacol. 2002;439:53–58. doi: 10.1016/s0014-2999(01)01599-0. [DOI] [PubMed] [Google Scholar]
- Kimmel CB, Ballard WW, Kimmel SR, Ullmann B, Schilling TF. Stages of embryonic development of the zebrafish. Dev Dyn. 1995;203:253–310. doi: 10.1002/aja.1002030302. [DOI] [PubMed] [Google Scholar]
- Lockwood B, Bjerke S, Kobayashi K, Guo S. Acute effects of alcohol on larval zebrafish: a genetic system for large-scale screening. Pharmacol Biochem Behav. 2004;77:647–654. doi: 10.1016/j.pbb.2004.01.003. [DOI] [PubMed] [Google Scholar]
- Lovinger DM, White G, Weight FF. Ethanol inhibits NMDA-activated ion current in hippocampal neurons. Science. 1989;243:1721–1724. doi: 10.1126/science.2467382. [DOI] [PubMed] [Google Scholar]
- Lu L, Koya E, Zhai H, Hope BT, Shaham Y. Role of ERK in cocaine addiction. Trends Neurosci. 2006;29:695–703. doi: 10.1016/j.tins.2006.10.005. [DOI] [PubMed] [Google Scholar]
- Maas JW, Jr, Vogt SK, Chan GC, Pineda VV, Storm DR, Muglia LJ. Calcium-stimulated adenylyl cyclases are critical modulators of neuronal ethanol sensitivity. J Neurosci. 2005;25:4118–4126. doi: 10.1523/JNEUROSCI.4273-04.2005. [DOI] [PMC free article] [PubMed] [Google Scholar]
- Moore MS, DeZazzo J, Luk AY, Tully T, Singh CM, Heberlein U. Ethanol intoxication in Drosophila: genetic and pharmacological evidence for regulation by the cAMP signaling pathway. Cell. 1998;93:997–1007. doi: 10.1016/s0092-8674(00)81205-2. [DOI] [PubMed] [Google Scholar]
- Mueller T, Wullimann MF. BrdU-, neuroD (nrd)- and Hu-studies reveal unusual non-ventricular neurogenesis in the postembryonic zebrafish forebrain. Mech Dev. 2002;117:123–135. doi: 10.1016/s0925-4773(02)00194-6. [DOI] [PubMed] [Google Scholar]
- Mueller T, Wullimann MF. Atlas of early zebrafish brain development. Amsterdam: Elsevier; 2005. [Google Scholar]
- Mueller T, Vernier P, Wullimann MF. A phylotypic stage in vertebrate brain development: GABA cell patterns in zebrafish compared to mouse. J Comp Neurol. 2006;494:620–634. doi: 10.1002/cne.20824. [DOI] [PubMed] [Google Scholar]
- Mueller T, Wullimann MF, Guo S. Early teleostean basal ganglia development visualized by zebrafish Dlx2a, Lhx6, Lhx7, Tbr2 (eomesa), and GAD67 gene expression. J Comp Neurol. 2008;507:245–257. doi: 10.1002/cne.21604. [DOI] [PubMed] [Google Scholar]
- Northcutt RG. Connections of the lateral and medial divisions of the goldfish telencephalic pallium. J Comp Neurol. 2006;494:903–943. doi: 10.1002/cne.20853. [DOI] [PubMed] [Google Scholar]
- Ohrtman JD, Stancik EK, Lovinger DM, Davis MI. Ethanol inhibits brain-derived neurotrophic factor stimulation of extracellular signal-regulated/mitogen-activated protein kinase in cerebellar granule cells. Alcohol. 2006;39:29–37. doi: 10.1016/j.alcohol.2006.06.011. [DOI] [PubMed] [Google Scholar]
- Phillips TJ, Shen EH. Neurochemical bases of locomotion and ethanol stimulant effects. Int Rev Neurobiol. 1996;39:243–282. doi: 10.1016/s0074-7742(08)60669-8. [DOI] [PubMed] [Google Scholar]
- Radwanska K, Wrobel E, Korkosz A, Rogowski A, Kostowski W, Bienkowski P, Kaczmarek L. Alcohol relapse induced by discrete cues activates components of AP-1 transcription factor and ERK pathway in the rat basolateral and central amygdala. Neuropsychopharmacology. 2008;33:1835–1846. doi: 10.1038/sj.npp.1301567. [DOI] [PubMed] [Google Scholar]
- Rink E, Wullimann MF. The teleostean (zebrafish) dopaminergic system ascending to the subpallium (striatum) is located in the basal diencephalon (posterior tuberculum) Brain Res. 2001;889:316–330. doi: 10.1016/s0006-8993(00)03174-7. [DOI] [PubMed] [Google Scholar]
- Roberto M, Nelson TE, Ur CL, Brunelli M, Sanna PP, Gruol DL. The transient depression of hippocampal CA1 LTP induced by chronic intermittent ethanol exposure is associated with an inhibition of the MAP kinase pathway. Eur J Neurosci. 2003;17:1646–1654. doi: 10.1046/j.1460-9568.2003.02614.x. [DOI] [PubMed] [Google Scholar]
- Sanna PP, Simpson C, Lutjens R, Koob G. ERK regulation in chronic ethanol exposure and withdrawal. Brain Res. 2002;948:186–191. doi: 10.1016/s0006-8993(02)03191-8. [DOI] [PubMed] [Google Scholar]
- Schroeder JP, Spanos M, Stevenson JR, Besheer J, Salling M, Hodge CW. Cue-induced reinstatement of alcohol-seeking behavior is associated with increased ERK1/2 phosphorylation in specific limbic brain regions: blockade by the mGluR5 antagonist MPEP. Neuropharmacology. 2008;55:546–554. doi: 10.1016/j.neuropharm.2008.06.057. [DOI] [PMC free article] [PubMed] [Google Scholar]
- Schuckit MA. Genetics of the risk for alcoholism. Am J Addict. 2000;9:103–112. doi: 10.1080/10550490050173172. [DOI] [PubMed] [Google Scholar]
- Sharko AC, Hodge C. Acute ethanol challenge modulates extracellular-signal regulated kinase phosphorylation in vivo. Alcohol Clin Exp Res. 2007;31:193A. [Google Scholar]
- Shaul YD, Seger R. The MEK/ERK cascade: from signaling specificity to diverse functions. Biochim Biophys Acta. 2007;1773:1213–1226. doi: 10.1016/j.bbamcr.2006.10.005. [DOI] [PubMed] [Google Scholar]
- Shin JT, Fishman MC. From zebrafish to human: modular medical models. Annu Rev Genomics Hum Genet. 2002;3:311–340. doi: 10.1146/annurev.genom.3.031402.131506. [DOI] [PubMed] [Google Scholar]
- Stork PJS, Schmitt JM. Crosstalk between cAMP and MAP kinase signaling in the regulation of cell proliferation. Trends Cell Biol. 2002;12:258–266. doi: 10.1016/s0962-8924(02)02294-8. [DOI] [PubMed] [Google Scholar]
- Sturgill TW, Ray LB, Erikson E, Maller JL. Insulin-stimulated MAP-2 kinase phosphorylates and activates ribosomal protein S6 kinase II. Nature. 1988;334:715–718. doi: 10.1038/334715a0. [DOI] [PubMed] [Google Scholar]
- Sunahara RK, Taussig R. Isoforms of mammalian adenylyl cyclase: multiplicities of signaling. Mol Interv. 2002;2:168–184. doi: 10.1124/mi.2.3.168. [DOI] [PubMed] [Google Scholar]
- Tsuji R, Guizzetti M, Costa LG. In vivo ethanol decreases phosphorylated MAPK and p70S6 kinase in the developing rat brain. Neuroreport. 2003;14:1395–1399. doi: 10.1097/01.wnr.0000071763.92388.41. [DOI] [PubMed] [Google Scholar]
- Wullimann MF, Mueller T. Teleostean and mammalian forebrains contrasted: evidence from genes to behavior. J Comp Neurol. 2004;475:143–162. doi: 10.1002/cne.20183. [DOI] [PubMed] [Google Scholar]
- Wullimann MF, Rupp B, Reichert H. Neuroanatomy of the zebrafish brain. Basel: Birkhauser Verlag; 1996. [Google Scholar]
- Yoshimura M, Tabakoff B. Selective effects of ethanol on the generation of cAMP by particular members of the adenylyl cyclase family. Alcohol Clin Exp Res. 1995;19:1435–1440. doi: 10.1111/j.1530-0277.1995.tb01004.x. [DOI] [PubMed] [Google Scholar]
- Zhu S, Korzh V, Gong Z, Low BC. RhoA prevents apoptosis during zebrafish embryogenesis through activation of Mek/Erk pathway. Oncogene. 2008;27:1580–1589. doi: 10.1038/sj.onc.1210790. [DOI] [PubMed] [Google Scholar]