

Abstract
Increasingly invasive bladder cancer cells lines displayed insensitivity toward a panel of dietary-derived ligands for members of the nuclear receptor superfamily. Insensitivity was defined through altered gene regulatory actions and cell proliferation and reflected both reduced receptor expression and elevated nuclear receptor corepressor 1 (NCOR1) expression. Stable overexpression of NCOR1 in sensitive cells (RT4) resulted in a panel of clones that recapitulated the resistant phenotype in terms of gene regulatory actions and proliferative responses toward ligand. Similarly, silencing RNA approaches to NCOR1 in resistant cells (EJ28) enhanced ligand gene regulatory and proliferation responses, including those mediated by peroxisome proliferator-activated receptor (PPAR) γ and vitamin D receptor (VDR) receptors. Elevated NCOR1 levels generate an epigenetic lesion to target in resistant cells using the histone deacetylase inhibitor vorinostat, in combination with nuclear receptor ligands. Such treatments revealed strong-additive interactions toward the PPARγ, VDR and Farnesoid X-activated receptors. Genome-wide microarray and microfluidic quantitative real-time, reverse transcription–polymerase chain reaction approaches, following the targeting of NCOR1 activity and expression, revealed the selective capacity of this corepressor to govern common transcriptional events of underlying networks. Combined these findings suggest that NCOR1 is a selective regulator of nuclear receptors, notably PPARγ and VDR, and contributes to their loss of sensitivity. Combinations of epigenetic therapies that target NCOR1 may prove effective, even when receptor expression is reduced.
Introduction
Manipulating the transcriptional actions of members of the nuclear receptor super-family forms a major therapeutic approach for several cancers and could prove attractive for bladder cancer in either chemoprevention or chemotherapy settings. These receptors form an adaptive homeostatic network that bind lipophilic molecules, such as steroidal-based hormones, dietary factors, fatty acids and xenobiotics, with differing affinities to exert regulatory control over a wide range of gene targets (1–3). This network is integrated at multiple levels including ligand promiscuity, as demonstrated by the vitamin D receptor (VDR) and other receptors (4,5), and mutlimerisation. VDR, peroxisome proliferator-activated receptors (PPARs), liver X receptors (LXRs) and Farnesoid X-activated receptor (FXR) preferentially form heterodimeric complexes with retinoid X receptors (RXRs), and in turn these and other receptor dimers interact with a large cohort of common and unique cofactor modifiers.
Attempts to understand nuclear receptor transcriptional control has shifted toward dissection of the intricate exchanges of coactivator and corepressors during transcription (reviewed in ref. 6). In the absence of ligand, receptor dimers are contained within large and dynamic multicomponent complexes associated with corepressors such as nuclear receptor corepressor 1 (NCOR1), silencing mediator of retinoid and thyroid hormone receptors/nuclear receptor corepressor 2 (NCOR2/SMRT), ligand-dependent nuclear receptor corepressor (LCOR) and SRA stem loop-interacting RNA-binding protein (SLIRP) (7–10) that act to repress transcriptional function. Commonly, corepressors allosterically interact with a range of enzymes, for example histone deacetylases (HDACs) (11), to bring about posttranslational modifications of histone tails and maintain a locally closed chromatin structure around response element sequences (reviewed in ref. 12). Ligand activation facilitates interaction with coactivator complexes that contain an antagonistic battery of enzymes to open up chromatin structure and initiate transactivation (reviewed in ref. 6).
The bladder must maintain homeostasis in a relatively toxic environment. Therefore, the environmental-sensing capacity of the nuclear receptor network may function in the bladder urothelium to govern proliferation and clear potential genotoxic insults. These functions may become corrupted in cancer through expression changes of both the receptors and the coactivator and corepressors, such as NCOR1. Specifically, we hypothesized that increasingly invasive bladder cancer cells may loose responsiveness to the actions of multiple receptors. We reasoned that altered expression of corepressors contributes to any loss of receptor responses and may provide a rational target for epigenetic therapies.
Materials and methods
Treatments.
1α,25DihydroxyvitaminD3 (1α,25(OH)2D3) [generous gift of Dr Milan Uskokovic (BioXell S.p.A., Milan, Italy)] and 9 cis retinoic acid were stored as 1 mM stocks in ethanol. All other ligands were purchased from Sigma–Aldrich (Bournemouth, UK) and stored in dimethyl sulfoxide as 100 mM stocks. Suberoylanilide hydroxamic acid (vorinostat) (Merck, Nutley, NJ) was stored as a 100 mM stock in dimethyl sulfoxide. All stocks were stored at −20°C.
Cell culture.
RT4 cells were maintained in McCoys 5a medium, HT-1376 in modified Eagle medium medium with non-essential amino acids, RT112 and EJ28 cells in Dulbecco's modified Eagle's medium medium (Gibco BRL, Paisely, UK), all supplemented with 100 U/ml penicillin, 100 μg/ml streptomycin and 10% fetal bovine serum (Gibco BRL). All cells were grown at 37°C in a humidified atmosphere of 5% CO2 in air. RT4 cells are well differentiated and were derived from transitional cell papilloma; RT-112 were derived from a grade 2 moderately differentiated transitional cell carcinoma; HT-1376 were derived from a grade 3 (high grade) transitional cell carcinoma and EJ28 were derived from G3 poorly differentiated bladder transitional cell carcinoma.
Proliferation assay.
Proliferation (ViaLight HS, LumiTech, Nottingham, UK) was measured as described previously (13,14). RT4 at 2 × 10³ cells per well, RT112 and EJ28 at 3 × 10³ cells per well and HT-1376 at 4 × 10³ were plated in 96-well, white-walled, tissue culture-treated plates (Fisher Scientific Ltd, Loughborough, UK). Growth media containing varying concentrations of agent was added to a final volume of 100 μl per well and plates were incubated for 96 h, with re-dosing after 48 h. Cellular adenosine triphosphate was subsequently quantified according to the manufacturers’ instructions using a microplate luminometer and expressed as a percentage of vehicle-treated control wells. Each treatment was examined in triplicate wells in triplicate experiments.
Cell cycle analysis.
Subconfluent, exponentially proliferating cultures treated with agents as indicated were harvested (both those adhering and detached), counted and 1 × 10⁶ cells were stained with propidium iodide buffer [10 μg/ml propidium iodide, 1% (wt/vol) tri-sodium citrate, 0.1% (vol/vol) Triton X-100, 100 μM sodium chloride (Sigma)]. The cell suspension was then incubated on ice, in the dark, for 30 min. Cell cycle distribution was determined using a Becton-Dickinson Flow Cytometer and CellFIT Cell-Cycle Analysis software. Each condition was examined in triplicate experiments.
Western immunoblot analysis.
Nuclear and cytoplasmic protein was prepared using the BioVision Nuclear/Cytosol Fractionation kit (Mountain View, CA, http://www.biovision.com/) as per the manufacturer's instructions. Briefly, 2 × 10⁶ cells were pelletted and the cytoplasm lysed and harvested to leave remaining nuclear pellet for lysis. Lysates underwent sodium dodecyl sulfate–polyacrylamide gel electrophoresis, transferred onto polyvinylidene difluoride membrane (Immobilon-P, Millipore, Bedford, MA) and blocked with tris buffered saline-tween containing 5% milk powder for 1 h. For detection of NCOR1, a rabbit antibody (clone ab24552, AbCam Ltd, Cambridge, UK) was diluted 1:500. For detection of PPARγ, mouse monoclonal antibody (clone sc-7273) was diluted 1/2000. For detection of VDR, a rabbit antibody (clone MAB1360, Chemicon, Europe, http://www.millipore.com/) was diluted 1:2000. For detection of SLIRP a rabbit polyclonal antibody (clone AB51523, Abcam) was diluted 1:2000. The secondary antibodies sheep anti-rabbit-horseradish peroxidase conjugate (clone ab6795, AbCam Ltd, Cambridge, UK) and goat anti-mouse (clone no. ab20043) were diluted 1:10 000. Proteins were detected using enhanced chemiluminescence (Amersham, Amersham, UK) and autoradiography. Membranes were washed and incubated with a 1/10 000 dilution of either a primary mouse monoclonal nucleolin antibody (clone 13541, Abcam) or a mouse monoclonal antibody to α-tubulin (Sigma, B-5-1-2). An anti-mouse-horseradish peroxidase secondary antibody (clone NA931, Amersham) was used at 1:2000, and signals developed with enhanced chemiluminescence and autoradiography as above.
Manipulation of NCOR1 levels.
RT4 cells were stably transfected with pcDNA3-NCOR1 (15) and pcDNA3 (generous gift of Dr Johnson Liu, Mount Sinai School of Medicine) using FuGENE® 6 (Roche Diagnostics, UK, http://www.roche.com/) at an optimized ratio of Fugene to plasmid DNA of 3:1. Briefly, 5 × 10⁵ cells were transfected with 1 μg per well of either pcDNA3-NCOR1 or pcDNA3. Two days posttransfection, cells were split into medium containing G418 (660 μg/ml) for 2 weeks of selection. Individual colonies were isolated to screen for NCOR1 expression by quantitative real-time, reverse transcription–polymerase chain reaction (Q-RT–PCR) and western immunoblot analysis, expanded and frozen prior to subsequent analyses.
NCOR1 levels were transiently reduced in EJ28 cells using silencing RNA (siRNA) approaches. A total of 100 nM siRNA targeted toward NCOR1 (M-003518-01, Dharmacon, http://www.dharmacon.com/) was transfected into EJ28 cells using Lipofectamine2000 (Invitrogen, http://www.invitrogen.com/) at a 1:1 ratio for 48 h prior to western immunoblot, Q-RT–PCR and proliferation assays.
Real-time RT–PCR messenger RNA profiling of single-gene targets (Q-RT–PCR).
Total RNA was isolated from mid-exponential cells using Tri-reagent (Sigma-Aldrich, UK) and the complementary DNA prepared using random hexamers (Promega, http://www.promega.com/) both according to the manufacturers' instructions. Relative expression of specific messenger RNAs (mRNAs) was quantified using the ABI PRISM 7700 Sequence Detection System (Applied Biosystems, http://www3.appliedbiosystems.com/) according to the manufacturers' instructions. Reactions were either multiplexed with VIC-labeled probe for 18S ribosomal RNA (PE Biosystems, Warrington, UK) using pre-optimized primer and probe sequences (VDR, NCOR1, NCOR2/SMRT, TRIP15/Alien) (13,14) or were provided from Applied Biosystems, Assay-on-Demand (RARα, β, RXRα, PPARα, δ, γ, LXRα, β, FXR, LCOR, RCOR, SLIRP). Relative expression of each target gene, in each cell line, compared with RT4 cells was calculated using the equation 2−δδCt, where the δCt = Ct of the target gene minus Ct of the 18S and δδCt = the difference in the δCt in the target cell compared with RT4 cells. To exclude potential bias due to transforming data, all statistics were performed with δCt values. Measurements were carried out a minimum of three times each in triplicate wells for each condition.
Gene expression profiling
Microfluidic quantitative real-time, reverse transcription–polymerase chain reaction approaches.
Simultaneous quantitative comparison of multiple gene transcripts was undertaken on the custom-designed TaqMan® Low Density Array as given in supplementary data and Table I (available at Carcinogenesis Online) (ABI 7900HT Fast Real-Time PCR System). The full list of gene targets is divided into nine functional groups whose expression together reflects nuclear receptor-signaling capacity. These are (i) cell surface transporters; (ii) nuclear receptors; (iii) nuclear receptor cofactors; (iv) histone modifiers; (v) metabolic enzymes; (vi) cell death regulators; (vii) transcription factors; (viii) cell cycle regulators and (ix) signal transduction components.
Triplicate RNA samples from both RT4 pNCOR #7 and RT4 pcDNA #6 cells at different passage numbers and each treated plus or minus with lithocholic acid (LCA) (10 μM, 6 h) were each measured in duplicate on each array. Total RNA was extracted using Tri-Reagent (Sigma) as per the manufacturer's instructions and reverse transcribed to complementary DNA and quantified using the one-step QuantiTect Probe RT–PCR kit (Qiagen, http://www1.qiagen.com/) directly on arrays. Data were normalized to the internal control 18S and the pNCOR samples calibrated to the pcDNA samples using the δδCT method as described above.
Statistical analysis was performed using TIGR MultiExperiment Viewer 4.0, MeV (freely available at www.tm4.org); fold change values, obtained comparing treated and untreated pNCOR1 δCts versus pcDNA δCts, were compared using a one-sample t-test. Vectors containing gene expression values were tested against the predicted mean of 1 that indicates no changes in gene expression with cutoff (P < 0.01).
Microarray analyses of gene expression.
A MIAME compliant protocol was adopted to examine genome-wide changes in gene expression patterns in 1.5 × 10⁶ mid-exponential EJ28 cells treated with either LCA (100 μM), vorinostat (0.8 μM), the combination or vehicle control (ethanol) for 6 h. Total RNA was extracted as above and purified as per the manufacturer's instructions using DNAse treatment and column purification and processed to generate purified and fragmented biotin-labeled copy RNA (cRNA) prior to hybridization. Each treatment was undertaken in triplicate and analyzed on triplicate chips. Fifteen micrograms of cRNA was hybridized to Human genome U133 set (Affymetrix, UK, http://www.affymetrix.com/). Variations between the experiments were normalized using quantile normalization. After the normalization step, a student t-test (P < 0.01) was used to find genes significantly regulated by the treatments. Arrays results were analyzed using dChip software (http://biosun1.harvard.edu/complab/dchip/). Comparing treated samples versus negative control yielded this analysis.
Network analyses of the statistically significant gene changes.
Networks that related to the patterns of altered gene expression were analyzed using GeneGo software (http://www.genego.com/). Algorithms were used to identify subnetworks that centered on transcription factors whose target genes were enriched in the gene list, ranked by Z-score.
Statistical analysis.
All analyses were conducted using the Student's t-test. The combination of the individual mean effects for each compound acting alone was the ‘predicted’ combined inhibition. The mean ‘observed’ combined inhibition was then compared with this value using the Student's t-test. Classification of the inhibitory effects was as follows: strong-additive effects were those with an observed value significantly greater than the predicted value, additive effects were those in which the observed value did not significantly differ from the predicted value and subadditive effects were those in which the observed value was significantly less than the predicted value (13,14,16).
Results
Increased NCOR1 associates with increased cellular invasiveness suppressed antiproliferative responsiveness toward ligand.
Preliminary studies in RT4, RT112, HT-1376 and EJ28 established proliferation and invasion capacities. A dual chamber modified Matrigel assay demonstrated that high-grade cell lines HT-1376 and EJ28 displayed rapid and significant invasion within 24 h, whereas the papillary-derived cell line RT4 showed no invasion at 24 h. Additionally, wound-healing assays confirmed that HT-1376 and EJ28 rapidly ‘heal’ a circular wound in a confluent monolayer culture. RT112 showed slower but active healing, and RT4 failed to demonstrate healing within 24 h (supplementary data, Figure 1A and B are available at Carcinogenesis Online). Thus, the cell lines were ordered by increasing invasiveness of RT4, RT112, HT-1376 and EJ28. Mid-exponential proliferating cultures revealed that RT4, RT112 and HT-1376 were equivalent with ∼70% of cells in G1 and 15% in G2/M. EJ28 cells differed with an equivalent proportion in G2/M but a reduced level of cells in G1 (58%) and more in S-phase (28% versus ∼15% in the other three cell lines) and reflects the invasive phenotype.
Initially, we undertook a Q-RT–PCR profile of high-affinity (VDR, RARA, RARB and RXRA) and low-affinity (PPARA, PPARD, PPARG, LXRA, LXRB and FXR) nuclear receptors and corepressors (NCOR1, NCOR2/SMRT, LCOR, RCOR, TRIP15/Alien and SLRIP). In this comparison, expression levels were normalized to the least invasive cell line RT4 (Figure 1). In RT112, there was a clear increase in expression of VDR and LXRA [5.2 and 4.3, respectively (P < 0.05)]. All other receptors in RT112 cells were modestly elevated up to 2-fold, except FXR, which was significantly reduced. HT-1376 cells only displayed modest, but significant, elevation of LXRA (P < 0.05), and EJ28 cells displayed significant elevation of LXRB only (P < 0.05). Most other receptors were significantly reduced in HT-1376 and EJ28 cells (P < 0.05) (Figure 1A).
Fig. 1.

Expression of nuclear receptor and corepressors in bladder cancer cell lines. Panel (A): nuclear receptor mRNA levels measured by Q-RT–PCR in RT112, HT-1376 and EJ28 compared with the levels in RT4 cells, which were arbitrarily set to 1. Total mRNA was isolated from triplicate cultures in mid-exponential phase, reverse transcribed and the target genes amplified according to the Materials and Methods. Each data point represents the mean of three separate experiments amplified in triplicate wells ±SEM (*P < 0.01). Panel (B): cytoplasmic (C) and nuclear (N) proteins were isolated from mid-exponential cultures from RT4, RT112, HT-1376 and EJ28 cells and resolved by sodium dodecyl sulfate–polyacrylamide gel electrophoresis and probed with antibody to VDR and PPARγ. Representative blots are shown with the position of the proteins indicated on the left. Blots were subsequently stripped and reprobed for nucleolin. Panel (C): corepressor mRNA was measured as in Panel (A). Panel (D): proteins were isolated from mid-exponential cultures from RT4, RT112, HT-1376 and EJ28 cells and resolved by sodium dodecyl sulfate–polyacrylamide gel electrophoresis and probed with antibody to NCOR1 and SLIRP. Representative blots are shown with the position of the proteins indicated on the left. Blots were subsequently stripped and reprobed for either α-tubulin or nucleolin.
Total protein expression was measured and mostly reflected the mRNA patterns. VDR protein was highest in RT112 cells and comparable between RT4 and HT-1376, with equal distribution between the nuclear and cytoplasmic fractions. EJ28 cells had lower VDR levels and exclusively nuclear expression. Reduced expression for PPARα was seen in all cell lines that broadly reflected the mRNA patterns (data not shown). PPARγ expression levels in both nuclear and cytoplasm fractions were also highest in RT112, with comparable nuclear expression found only in RT4 cells. The other two cells had reduced PPARγ expression, following the mRNA patterns, and in EJ28, expression was exclusively nuclear (Figure 1B). Total FXR protein appeared weak in RT4 cells and reduced in the other cell models (data not shown) and reflected low mRNA levels in all models except RT4.
Of the six corepressors, it was noticeable that NCOR1 was elevated significantly in RT112 and EJ28 (P < 0.05), whereas NCOR2/SMRT and TRIP15/Alien levels were broadly equivalent across the cell lines. LCOR, RCOR and SLIRP were significantly reduced in RT112, HT-1376 and EJ28 cells compared with RT4 cells (Figure 1C). Protein expression of two corepressors, NCOR1 and SLIRP reflected the mRNA patterns (Figure 1D). SLIRP expression was reduced in all cells compared with RT4 and NCOR1 was elevated in RT112 and EJ28 cells. NCOR1 levels in HT-1376 cells displayed elevated protein but equivalent mRNA compared with RT4 cells.
Subsequently, the antiproliferative responses of the four cell lines toward nine nuclear receptor ligands and the HDAC inhibitor vorinostat were measured, using a 96-well-based liquid proliferation assay. We previously established in this assay a linear relationship over several log orders between cell number and liberated adenosine triphosphate levels (13,14). The dose required to inhibit cell proliferation by 50% (ED50) values for each ligand were interpolated from the dose–response curves (Figure 2, Table I and supplementary Figure 2 available at Carcinogenesis Online).
Fig. 2.

Individual sigmoidal proliferation response curves toward a panel of nuclear receptor ligands and vorinostat. Panels (A and B): RT4 and EJ28 bladder cancer cells were plated into 96-well plates and treated with DHA (RXR), eicosapentaenoic acid (PPARα), ETYA (PPARγ), 22-HC (LXRα,β), GW3965 (LXRα,β), CDCA (FXR) LCA (VDR/FXR) and the HDAC inhibitor vorinostat (Vorin.) over a range of concentrations. After 96 h, with a redose after 48 h, proliferation was measured according to Materials and Methods and expressed as a percentage of untreated controls. Each data point represents the mean value of three separate experiments each undertaken in triplicate wells.
Table I.
Ligand ED50 values in bladder cancer cell lines
| Target | Ligand | ED50 | RT4 | RT112 | HT-1376 | EJ28 |
| VDR | 1α,25(OH)2D3 | nM | 70 | 20 | na | na |
| VDR/FXR | LCA | μM | 10 | 40 | na | na |
| RXRα | 9cisRA | nM | na | na | na | na |
| DHA | μM | 20 | 60 | 60 | 80 | |
| PPARα | EPA | μM | 50 | 50 | 80 | 100 |
| PPARγ | ETYA | μM | 4.5 | 12 | 20 | 70 |
| FXR | CDCA | μM | 12.5 | na | na | na |
| LXRα/β | GW3965 | μM | 30 | 60 | 60 | 80 |
| 22-HC | μM | 20 | 25 | 60 | 80 | |
| HDACs | Vorinostat | μM | 1.5 | 1 | 1.0 | 1.5 |
The four bladder cancer cell lines are arranged in their order of invasiveness. Parallel cultures from mid-exponentially proliferating cells of RT4, RT112, HT-1376 and EJ28 were exposed to the indicated ligands and proliferation measured (Materials and Methods). Titration studies generate dose–response curves from which the estimated dose required to inhibit proliferation by 50% (ED50) was interpolated. na, not achieved.
For all receptor ligands, the cells displayed a spectrum of suppressed responsiveness that reflected the invasive capacities of the cells and, to an extent, receptor expression. The high sensitivity of RT112 cells toward 1α,25(OH)2D3 (ED50 20 nM) correlates with elevated VDR mRNA and protein. Similar spectrums were observed with the VDR–FXR ligand LCA. RT4 cells were acutely inhibited by LCA (ED50 10 μM), whereas the response in RT112 cells was right shifted (ED50 40 μM) and was lost in HT-1376 and EJ28. Also, there was a loss of cellular response to chenodeoxycholic acid (CDCA) (FXR ligand) in RT112, HT-1376 and EJ28 compared with RT4 (ED50 12.5 μM) and reflects the common decreased expression of FXR mRNA and protein levels. In contrast, the ED50 toward vorinostat in all cells was ∼1 μM.
These receptor expression profiles are not completely predictive, notably for LXR and PPAR ligands. LXRA and LXRB were readily expressed in all cells, but the most invasive cell lines displayed a common loss of sensitivity to the cognate ligands with elevated ED50 values. Similarly, all cells had broadly equivalent PPARA but displayed altered responsiveness to eicosapentaenoic acid. ED50 values for the PPARγ ligand 5,8,11,14-eicosatetraenoic acid (ETYA) differ among the four cell lines ranging from 20 μM (HT-1376) to 70 μM (EJ28) and yet these cells had comparable levels of PPARγ. Furthermore for certain compounds (e.g. eicosapentaenoic acid and 22HC), low doses significantly stimulated RT112 proliferation (supplementary Figure 2A is available at Carcinogenesis Online), suggesting further corruption of signaling. Together, these data suggest that receptor expression contributes toward the cellular responses, but is not an exclusive indicator. In parallel, we investigated the possibility that the elevated levels of NCOR1 can contribute to determine final sensitivity to ligand.
Nuclear receptor ligand responses are enhanced by both modulation of NCOR1 expression and cotreatment with the HDAC inhibitor vorinostat.
We manipulated NCOR1 levels in RT4 and EJ28 cells to investigate its contribution to receptor signaling as measured by gene regulatory and proliferation responses. Overexpression of NCOR1 in RT4 cells recapitulated the expression spectrum seen within the four parental cell lines. NCOR1 is undetectable in RT4 cells (and RT4 pcDNA #6) and strongly detected in EJ28 cells (and RT4 pNCOR1 #7) (Figure 3A). A siRNA approach in EJ28 cells clearly reduced NCOR1 levels (Figure 3B).
Fig. 3.

Modulation of NCOR1 expression in bladder cancer cells. Panel (A): the expression of NCOR1 was measured in stably selected RT4 clones, according to the Materials and Methods, in nuclear and cytoplasmic fractions in RT4 pNCOR #7 cells compared with RT4 pcDNA #6. Representative blots are shown with the position of the proteins indicated on the left. Blots were subsequently stripped and reprobed for nucleolin. Panel (B): EJ28 cells were either mock transfected or treated with scrambled RNA (ScRNA) and siRNA toward NCOR1. Representative blots are shown with the position of the proteins indicated on the left. Blots were subsequently stripped and reprobed for nucleolin.
Ligand treatments in RT4 pcDNA #6 and RT4 NCOR #7 cells with 1α,25(OH)2D3 (VDR), ETYA (PPARγ), CDCA (FXR) and LCA (VDR–FXR) were undertaken. These revealed that the responses toward 1α,25(OH)2D3 were not significantly altered by increased NCOR1, whereas antiproliferative sensitivity toward ETYA, CDCA and LCA was significantly reduced (P < 0.0001), representative data are shown in Figure 4A. For example, we examined the effect of the RT4 ED50 dose of LCA (10 μM) on proliferation of RT4 pcDNA #6. This resulted in 39% ± 2.7 (mean ± SEM) of respective control level proliferation, whereas the same dose in RT4 NCOR #7 resulted in 82% ± 3.0 (mean ± SEM) of untreated control cell proliferation. Forced overexpression of NCOR1 also significantly reduced the cellular sensitivity toward vorinostat (P < 0.001). Parallel studies in EJ28 cells, with NCOR1 siRNA, identified a reciprocal, enhanced, antiproliferative sensitivity, toward 1α,25(OH)2D3 and ETYA (P < 0.0001), and LCA (P < 0.001), but neither CDCA nor vorinostat (Figure 4B).
Fig. 4.
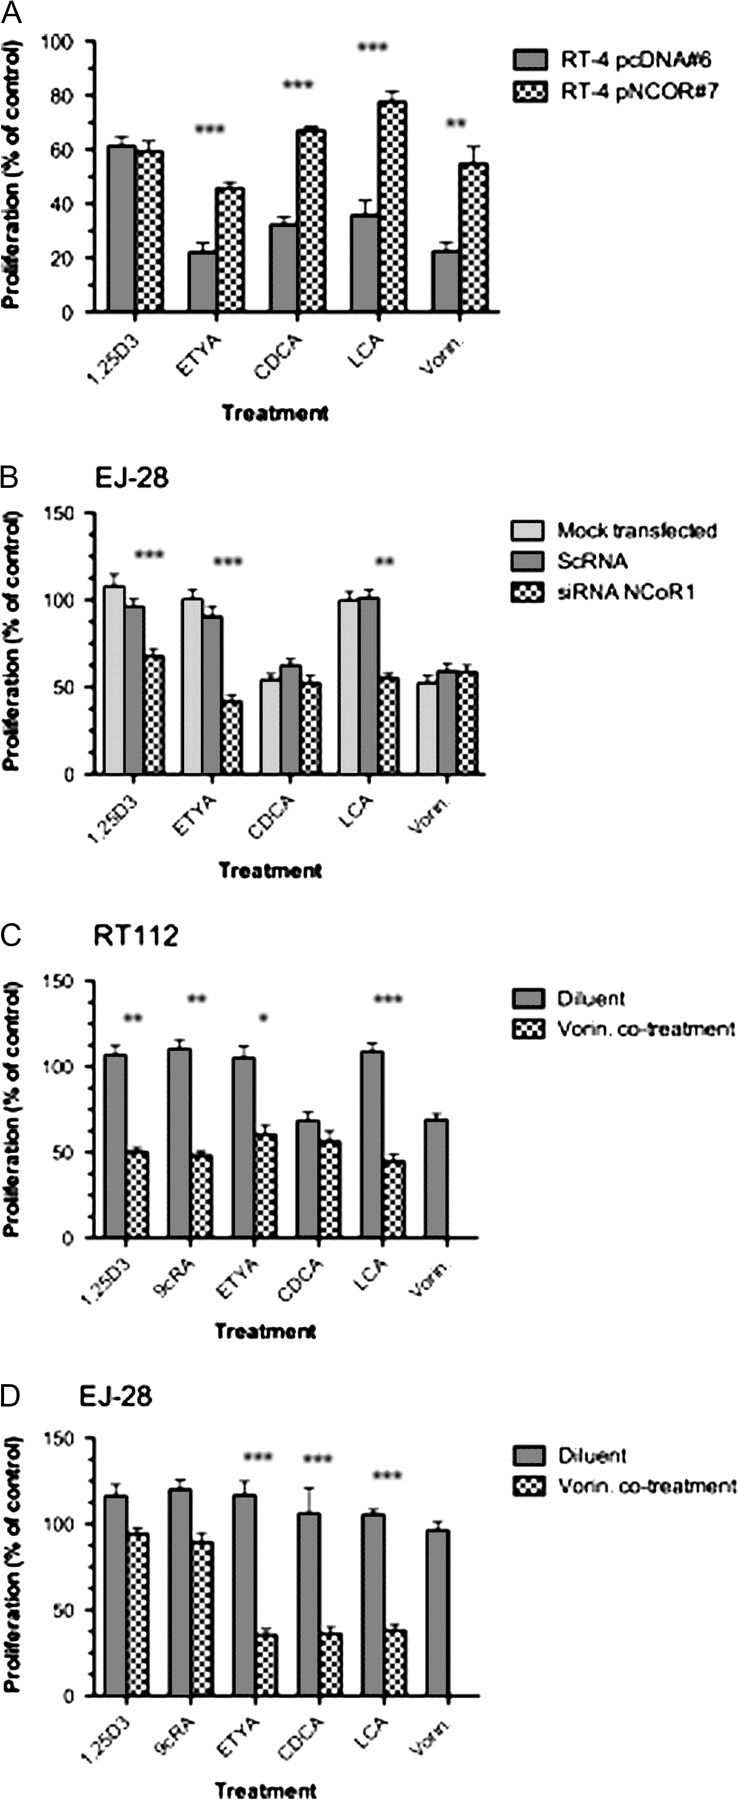
Modulation of responsiveness to a panel of nuclear receptor ligands by targeting NCOR1 expression and activity. Panel (A): antiproliferative responses of RT4 pNCOR #7 were compared with RT4 pcDNA #6 clones with the indicated treatments. After 96 h, with a redose after 48 h, proliferation was measured according to Materials and Methods and expressed as a percentage of untreated controls. Each data point represents the mean value of three separate experiments each undertaken in triplicate wells, and significant differences are indicated (**P < 0.01, ***P < 0.001). Panel (B): antiproliferative responses of EJ28 cells in either mock transfected, scrambled RNA (ScRNA) or siRNA with the indicated treatments. After transfection and 48 h exposure to treatment proliferation was measured according to Materials and Methods and expressed as a percentage of untreated controls. Each data point represents the mean value of three separate experiments each undertaken in triplicate wells, and significant differences are indicated (**P < 0.01, ***P < 0.001). RT112 cells (Panel C) and EJ28 cells (Panel D) were treated with minimally active doses of the indicated nuclear receptor ligands, the HDAC inhibitor vorinostat and the combination. The doses were calculated from the individual agent response curves to be the ED25 values as follows: RT112—1α,25(OH)2D3 (10 nM), 9 cis retinoic acid (9cRA) (100 nM), ETYA (9 μM) CDCA (90 μM) LCA (20 μM), vorinostat (0.3 μM); EJ28—1α,25(OH)2D3 (100 nM), 9 cis retinoic acid (100 nM), ETYA (30 μM) CDCA (100 μM) LCA (100 μM), vorinostat (0.8 μM). Proliferation was measured after 96 h, with re-dosing after 48 h. Strong-additive interactions are indicated where the observed combined inhibition is significantly greater than the predicted combined value (*P < 0.05, **P < 0.01, ***P < 0.001). All experiments were carried out in three independent times with triplicate wells.
We reasoned that the elevated levels of NCOR1 lead to increased levels of associated HDACs at target gene promoter regions. We targeted this epigenetic lesion with minimally active dose required to inhibit cell proliferation by 25% ligand doses combined with an ED25 dose of vorinostat. In RT4 cells, all combinations were subadditive (data not shown), which reflected the robust receptor expression and lower levels of NCOR1. RT112 and EJ28 cells yielded strong-additive interactions with multiple ligands, including ETYA and LCA, cotreated with vorinostat (P < 0.05) (Figure 4C and D). Cell cycle analyses in EJ28 cells revealed after 72 h that only the combination of LCA plus vorinostat increased both G1 and G2M populations and a concomitant and significant reduction in S-phase from 28.2% ± 3.5 (±SEM) to 7.4 ± 2.1 (P < 0.05). In RT4 cells, no additive effect on the cell cycle was observed.
Both modulation of NCOR1 expression and cotreatment with the HDAC inhibitor vorinostat result in similar transcriptional responses.
To define more precisely the impact of NCOR1 expression on transcriptional choices, we undertook supervised and unsupervised gene-profiling experiments. Specifically, we measured the LCA responses in RT4 cells with elevated NCOR1 and EJ28 cells cotreated with vorinostat.
A microfluidic quantitative real-time, reverse transcription–polymerase chain reaction approach compared the basal- and LCA-regulated expression in RT4 pcDNA #6 and RT4 pNCOR1 #7 cells. Forty-six gene targets (of the 95 genes examined) were significantly changed in RT4 pNCOR1 #7 compared with RT4 pcDNA #6 cells. Of these targets, 37 were repressed (supplementary data and Table II are available at Carcinogenesis Online) and enriched for known PPARs and VDR targets, including CYP24 (17), SULT2A1 (18), ABCA1 (19,20), CDKN1A (encodes p21(waf1/cip1)) (21) and CDKN1B (encodes p27(kip1)) (22–24). NCOR2/SMRT, a known VDR target gene (25), was also repressed. Increased NCOR1 expression significantly repressed several nuclear receptors (THRB, LXRA, LXRB, PPARA and PPARG) and coactivators (PPARGC1A, NCOA4, NCOA3). Interestingly, the increase in LXRs, associated with elevated NCOR1, reflects parallel-elevated expression of these receptors in EJ28 and RT112 compared with RT4 cells.
Subsequently, we examined LCA responses with the RT4 ED50 dose (10 μM, 6 h) in RT4 pcDNA #6 and RT4 NCOR #7 to identify NCOR1-dependent differential effects. Thirty and 17 genes were significantly and uniquely regulated in RT4 pcDNA #6 and RT4 NCOR #7, respectively, and only 12 gene targets were in common (supplementary data and Table II are available at Carcinogenesis Online). The significant and unique upregulated targets in RT4 pcDNA #6 included a cohort of nuclear receptors (e.g. LXRB, FXR, RXRA), coactivators factors (e.g. CREBBP/CBP, CRSP6/TRAP80) and histone modifiers (HDAC2, HDAC6, HDAC7A, HDAC10, AOF2/LSD1, CARM1). In combination with these were a range of upregulated nuclear receptor targets, associated with induction of mitotic restraint, programmed cell death and xenobiotic clearance (CDKN1A, CDKN1B, IGFBP3, IGFBP5, CASP4, SULT2A1). In contrast, the unique targets upregulated in RT4 NCOR #7 included compliments of nuclear receptors (ESR1, LXRA, LXRB, GCR/NR3C1) and histone modifiers (HDAC1, HDAC3, SUV39H1, PADI4), cell surface transporters (e.g. ABCA1) and metabolic enzymes (AKR1C3, PTGS2/COX2). The common targets included the metabolic enzyme (ALOX5), cell cycle regulators (CCNE1, CDK5) and signal transduction components (EGFR) (supplementary data and Table II are available at Carcinogenesis Online).
GeneGo software tools were used to mine these data in an unbiased manner and searched for enrichment of shared transcription factors (supplementary data and Table III are available at Carcinogenesis Online). Comparison of basal expression profiles between RT4 pNCOR1 #7 and RT4 pcDNA #6 cells revealed the most significantly altered transcription factor network was focused around hepatocyte nucleur factor 4α (HNF4α), and also contained p53 and PPARγ as adjacent hubs (supplementary Figure 3A is available at Carcinogenesis Online). The most enriched network in LCA-treated RT4 pcDNA #6 cells was, again, a network centered on HNF4α (supplementary Figure 3B is available at Carcinogenesis Online). In contrast, following LCA treatment of RT4 pNCOR1 #7, the networks most enriched were centered on specifity protein (SP)-1 and SP-3.
A subsequent microarray analysis in EJ28 cells in response to the strong-additive cotreatment of LCA (100 μM) plus vorinostat (0.8 μM) revealed that LCA alone after 4 h resulted in no significant changes in gene expression, reflecting the resistant nature of EJ28 cells. Vorinostat treatment significantly regulated a unique cohort of 18 genes, nine of which were downregulated. The cotreatment of agents significantly and uniquely regulated 83 genes, 55 of which were downregulated (supplementary data and Table IV are available at Carcinogenesis Online), including genes known to be either elevated in malignancy or associated with increased proliferation, such as ADNP, CDC5L, FUS, NRAS. Similarly, other positively regulated targets limit proliferative signals and promote differentiation such as ZNF277. Again, these data were mined via GeneGo tools to reveal, surprisingly, that the most enriched network centered, again, on HNF4α conjoined with EGFR (supplementary data and Table III and Figure 3C are available at Carcinogenesis Online).
The most upregulated gene target following LCA plus vorinostat, in the HNF4α network, was ZNF277, a zinc finger protein that promotes differentiation (26) and the most downregulated gene target was BCDIN3/MEPCE, an enzyme that promotes transcriptional elongation (27,28). We validated the regulation of these gene targets in EJ28 cells with NCOR1 knockdown to test the ability of NCOR1 levels to control the capacity of LCA, signaling through VDR, to regulate either an HNF4α network or an HNF4α-like network. These studies revealed that knockdown of NCOR1 resulted in LCA treatment significantly upregulating ZNF277 and downregulating BCDIN3/MEPCE (Figure 5). These findings indicate that both knockdown of NCOR1 and vorinostat cotreatment had similar effects and are suggestive of the significance of NCOR1 expression as a functional indicator of the responsiveness toward HDAC-centered therapies.
Fig. 5.

Regulation by LCA of target genes on an HNF4α-like network in EJ28 cells. Cells were mock transfected or treated with scrambled RNA (ScRNA) and siRNA toward NCOR1 and then exposed to LCA (100 μM, 4 h). Total mRNA was isolated from triplicate cultures in mid-exponential phase, reverse transcribed and the target genes amplified according to the Materials and Methods. Each data point represents the mean of three separate experiments amplified in triplicate wells ±SEM *P < 0.05, ***P < 0.001.
Discussion
The current study demonstrates that bladder cancer cell lines express a broad cohort of energetic and dietary-sensing nuclear receptors including both high-affinity receptors, such as VDR and RARα, and those which sense and metabolize more abundant dietary lipids and bile acids such as PPARs and LXRs. Nuclear receptors act as an adaptive homeostatic network in several tissues to sense environmental dietary and xenobiotic lipophilic compounds and sustain the cell, for example, through the diurnal patterns of fast and feeding (reviewed in refs 29,30). Specifically dietary-derived fatty acids, and bile acids cycle rapidly in response to dietary intake and work hormonally to co-ordinate multiple aspects of tissue function in response to changing energetic status. The ED50 doses obtained with RT4 cells for LCA and CDCA reflect the serum bile acid levels in humans (31). The altered expression, for example of VDR, PPARs, LXRs and FXR, in increasingly invasive bladder cell models suggests these functions are targeted for disruption. Supportively, animal and epidemiological studies indicate that either initiaton or progression of bladder cancer relates to altered intake of micro- and macronutrients, many of which are sensed by the nuclear receptor network (32–34).
We pursued the hypothesis that loss of ligand responsiveness arises due to the combination of reduced receptor and increased corepressors that function to attenuate receptor function. Of course, this does not exclude a role for loss of coactivator function to limit receptor function, and this may well be coincident with corepressor expression changes.
We identified that NCOR1, of six corepressors examined, was elevated in cells with attenuated antiproliferative receptor responses. Importantly, from a diagnostic perspective, we demonstrated in increasingly invasive bladder cancer cell lines an reduced receptor (e.g. VDR and PPARγ) and increased NCOR1 expression. Elevated NCOR1 protein in HT-1376 compared with RT4 cells, where the mRNA levels in the two cells appeared equivalent, may suggest other posttranslational mechanisms for the stabilization of NCOR1 levels. An important role for NCOR1 to govern multiple receptor responses was confirmed with three approaches: overexpressing NCOR1 in RT4 cells reduced receptor sensitivity and gene regulatory actions; knockdown of NCOR1 in EJ28 cells enhanced receptor sensitivity and gene regulatory actions and targeting the epigenetic lesion, resulting from a deregulated NCOR1 complex, with the HDAC inhibitor vorinostat very significantly enhanced antiproliferative receptor sensitivity in cell lines with elevated NCOR1 (RT112 and EJ28) and significantly altered the genome-wide transcriptional responses.
The precise relationships between ligand, receptor and NCOR1 are obscured by ligand promiscuity and diversity of signaling capacity. LCA is perceived by both FXR and VDR (4) and similarly CDCA may exert its effects by FXR, pregnane X receptor (PXR) and upregulate PPARγ (35). Similarly, both bile acids are sensed by cell surface receptor such as GPBAR1/TGR5 (36) and indirectly activate EGFR (37). These data may explain several potential differences between manipulating NCOR1 levels and cotreatment with vorinostat. In RT4 cells, with detectable FXR mRNA expression, CDCA and LCA, but not 1α,25(OH)2D3, signaling is reduced by overexpression of NCOR1 suggesting a FXR-dependent route. EJ28 cells express reduced levels of FXR mRNA and protein (data not shown) and reducing NCOR1 expression does not enhance the CDCA response. Instead, siRNA toward NCOR1 in EJ28 cells enhanced 1α,25(OH)2D3 signaling and supports a more prominent role for VDR to sense both 1α,25(OH)2D3 and LCA in these cells. A role for cell surface receptors is also suggested. LCA treatment of both clones upregulated EGFR. Similarly, in silico network analysis of LCA and vorinostat treatment of EJ28 cells supported a role for an HNF4α and EGFR network (supplementary Figure 3 is available at Carcinogenesis Online).
To define more clearly the ability of NCOR1 to govern receptor transcriptional actions, we undertook supervised and unsupervised gene-profiling approaches using the VDR–FXR ligand LCA as a model ligand input. Overexpression of NCOR1 in RT4 cells resulted in basal suppression of known PPARα/γ and VDR target genes, associated with antiproliferative behavior (CDKN1A, CDKN1B, BAX, CASP4). This was not a global event as other established target genes for these receptors were either sustained or even elevated, for example G0S2 (38).
The elevation of NCOR1 also leads LCA to induce transcriptomes that were, to an extent, antagonistic. Treatment of RT4 pcDNA #6 cells with physiological relevant doses of LCA (10 μM) regulated PPARBP, a coactivator for PPARs and FXR (39,40), whereas this was absent in RT4 NCOR #7 cells and instead the PPAR co-activator PPARGC1A was suppressed and LCA induced AKR1C3, which is known to break down natural ligands of PPARγ (41). Similarly, LCA treatment in RT4 pcDNA #6 cells induced CARM1, a nuclear receptor coactivator, whereas the same treatment in RT4 NCOR #7 cells upregulated PADI4, which is able to deaminate arginines and limits the ability of CARM1 (42). Unique transcriptomes were also modulated in EJ28 cells treated with LCA alone and in combination with vorinostat. These data suggest that NCOR1 can alter, in a dose-dependent manner, both the transcriptional magnitude and choice of gene targets for nuclear receptors.
To develop this concept further, we undertook in silico network analyses and identified a significantly enriched LCA-dependent HNF4α-like transcriptome in both RT4 and EJ28 cells, which was modulated by NCOR1 knockdown and HDAC cotreatment, respectively. HNF4α is a master transcriptional regulator in the liver, a key hepatic regulator of FXR and has the capacity to synthesize, sense and store bile acids (reviewed in ref. 43). However, HNF4α mRNA was only weakly detected in either basal- or LCA-treated RT4 cells. It was neither detected in the other three cell lines nor increased in EJ28 following knockdown of NCOR1 and then subsequently treated with LCA.
Together, these data support the concept that corepressor levels can act to change the signaling capacity of nuclear receptors. Specifically, in the case of LCA signaling, modulation of NCOR1 expression and activity converges through VDR and FXR in RT4 cells and VDR in EJ28 cells. The common effects are to regulate an ‘HNF4α-like’ transcriptional network. It is interesting to note that in other systems, HNF4α has been shown to co-operate with receptors including PXR to regulate gene transcription (44), to exert tumor suppressive effects (45) and SNPs of PPARγ and HNF4α combine to determine disease susceptibility in diabetes (46). While the current findings are suggestive of a tumor suppressive role for HNF4α in bladder cancer, the precise actions remain to be defined. It is possible that the network identified is phenotypically similar to HNF4α networks in other tissues. Thus, HNFα in hepatocytes is a master nuclear receptor that governs a differentiation and environmental-sensing network. In other tissues such as the bladder, a similar network may function but the regulator function is taken over by other nuclear receptors.
Corepressor expression, localization and isoforms have emerged as critical to determine the ability of nuclear receptors, to regulate target gene promoters and transcriptional outputs. Our previous findings have established elevated corepressor levels in breast and prostate cancer cells, compared with normal counterparts, leading to receptor attenuation and gene silencing (13,14,16,47). These findings suggest that elevated NCOR1 acts to attenuate and disrupt the actions of dietary-sensing nuclear receptors during bladder cancer progression and invasion and is in keeping with altered energetic status of cancer cells, as proposed by Warburg in the 1930’s [and summarized later (48)]. Cancer cells derive their energy increasingly from anaerobic glycolysis. The current study reveals that epigenetic events, mediated by increased NCOR1 expression, act to distort the transcriptional capacity of multiple nuclear receptors involved with the sensing and storing of energy and may contribute to the switch to aerobic glycolysis. This epigenetic lesion may be exploited, selectively and sensitively, by oral or intravesical therapies centered HDAC inhibitors used to potentiate the actions of ligands for either PPARs, VDR or FXR, where receptor expression is reduced (47,49).
Supplementary materials
Supplementary data, Tables I–IV and Figures 1–3 can be found at http://carcin.oxfordjournals.org/
Funding
NCI Cancer Center Support Grant to the Roswell Park Cancer Institute (CA016056).
Acknowledgments
M.J.C. acknowledges the support of NucSys, a European Community FP6-funded consortium aimed at the dissection and mathematical modeling of nuclear receptor responses to nutritional signals in health and disease, the Biotechnology and Biological Sciences Research Council Agri-Foods panel and the National Cancer Research Institute South of England Prostate Collaborative.
Conflict of Interest Statement: None declared.
Glossary
Abbreviations
- CDCA
chenodeoxycholic acid
- ED50
dose required to inhibit cell proliferation by 50%
- ETYA
5,8,11,14-eicosatetraenoic acid
- FXR
Farnesoid X-activated receptor
- 22-HC
22-hydroxycholesterol
- HDAC
histone deacetylase
- HNF4α
hapatocyte nucleur factor
- LCA
lithocholic acid
- LCOR
ligand-dependent nuclear receptor corepressor
- LXR
liver X receptor
- mRNA
messenger RNA
- NCOR1
nuclear receptor corepressor 1
- NCOR2/SMRT
silencing mediator of retinoid and thyroid hormone receptors/nuclear receptor corepressor 2
- PPAR
peroxisome proliferator-activated receptor
- Q-RT–PCR
quantitative real-time, reverse transcription–polymerase chain reaction
- Q-RT–PCRM
microfluidic quantitative real-time, reverse transcription–polymerase chain reaction
- RXR
retinoid X receptor
- siRNA
silencing RNA
- SLIRP
SRA stem loop-interacting RNA-binding protein
- VDR
vitamin D receptor
- 1α,25(OH)2D3
1α,25dihydroxyvitaminD3
References
- 1.Crescioli C, et al. Human bladder as a novel target for vitamin D receptor ligands. J. Clin. Endocrinol. Metab. 2005;90:962–972. doi: 10.1210/jc.2004-1496. [DOI] [PubMed] [Google Scholar]
- 2.Shen SS, et al. Expression of estrogen receptors-alpha and -beta in bladder cancer cell lines and human bladder tumor tissue. Cancer. 2006;106:2610–2616. doi: 10.1002/cncr.21945. [DOI] [PubMed] [Google Scholar]
- 3.Kassouf W, et al. Inhibition of bladder tumor growth by 1,1-bis(3′-indolyl)-1-(p-substitutedphenyl)methanes: a new class of peroxisome proliferator-activated receptor gamma agonists. Cancer Res. 2006;66:412–418. doi: 10.1158/0008-5472.CAN-05-2755. [DOI] [PubMed] [Google Scholar]
- 4.Makishima M, et al. Vitamin D receptor as an intestinal bile acid sensor. Science. 2002;296:1313–1316. doi: 10.1126/science.1070477. [DOI] [PubMed] [Google Scholar]
- 5.Shaw N, et al. Retinoic acid is a high affinity selective ligand for the peroxisome proliferator-activated receptor beta/delta. J. Biol. Chem. 2003;278:41589–41592. doi: 10.1074/jbc.C300368200. [DOI] [PubMed] [Google Scholar]
- 6.Rosenfeld MG, et al. Sensors and signals: a coactivator/corepressor/epigenetic code for integrating signal-dependent programs of transcriptional response. Genes Dev. 2006;20:1405–1428. doi: 10.1101/gad.1424806. [DOI] [PubMed] [Google Scholar]
- 7.Chen JD, et al. A transcriptional co-repressor that interacts with nuclear hormone receptors. Nature. 1995;377:454–457. doi: 10.1038/377454a0. [DOI] [PubMed] [Google Scholar]
- 8.Fernandes I, et al. Ligand-dependent nuclear receptor corepressor LCoR functions by histone deacetylase-dependent and -independent mechanisms. Mol. Cell. 2003;11:139–150. doi: 10.1016/s1097-2765(03)00014-5. [DOI] [PubMed] [Google Scholar]
- 9.Li J, et al. Both corepressor proteins SMRT and N-CoR exist in large protein complexes containing HDAC3. EMBO J. 2000;19:4342–4350. doi: 10.1093/emboj/19.16.4342. [DOI] [PMC free article] [PubMed] [Google Scholar]
- 10.Hatchell EC, et al. SLIRP, a small SRA binding protein, is a nuclear receptor corepressor. Mol. Cell. 2006;22:657–668. doi: 10.1016/j.molcel.2006.05.024. [DOI] [PubMed] [Google Scholar]
- 11.Fischle W, et al. Enzymatic activity associated with class II HDACs is dependent on a multiprotein complex containing HDAC3 and SMRT/N-CoR. Mol. Cell. 2002;9:45–57. doi: 10.1016/s1097-2765(01)00429-4. [DOI] [PubMed] [Google Scholar]
- 12.Kouzarides T. Chromatin modifications and their function. Cell. 2007;128:693–705. doi: 10.1016/j.cell.2007.02.005. [DOI] [PubMed] [Google Scholar]
- 13.Khanim FL, et al. Altered SMRT levels disrupt vitamin D(3) receptor signalling in prostate cancer cells. Oncogene. 2004;23:6712–6725. doi: 10.1038/sj.onc.1207772. [DOI] [PubMed] [Google Scholar]
- 14.Banwell CM, et al. Altered nuclear receptor corepressor expression attenuates vitamin d receptor signaling in breast cancer cells. Clin. Cancer Res. 2006;12:2004–2013. doi: 10.1158/1078-0432.CCR-05-1218. [DOI] [PubMed] [Google Scholar]
- 15.Wang J, et al. ETO, fusion partner in t(8;21) acute myeloid leukemia, represses transcription by interaction with the human N-CoR/mSin3/HDAC1 complex. Proc. Natl Acad. Sci. USA. 1998;95:10860–10865. doi: 10.1073/pnas.95.18.10860. [DOI] [PMC free article] [PubMed] [Google Scholar]
- 16.Rashid SF, et al. Synergistic growth inhibition of prostate cancer cells by 1 alpha,25 Dihydroxyvitamin D(3) and its 19-nor-hexafluoride analogs in combination with either sodium butyrate or trichostatin A. Oncogene. 2001;20:1860–1872. doi: 10.1038/sj.onc.1204269. [DOI] [PubMed] [Google Scholar]
- 17.Vaisanen S, et al. Spatio-temporal activation of chromatin on the human CYP24 gene promoter in the presence of 1alpha,25-dihydroxyvitamin D(3) J. Mol. Biol. 2005;350:65–77. doi: 10.1016/j.jmb.2005.04.057. [DOI] [PubMed] [Google Scholar]
- 18.Chatterjee B, et al. Vitamin D receptor regulation of the steroid/bile acid sulfotransferase SULT2A1. Methods Enzymol. 2005;400:165–191. doi: 10.1016/S0076-6879(05)00010-8. [DOI] [PubMed] [Google Scholar]
- 19.Hodgkinson CP, et al. Microarray analysis of peroxisome proliferator-activated receptor-gamma induced changes in gene expression in macrophages. Biochem. Biophys. Res. Commun. 2003;308:505–510. doi: 10.1016/s0006-291x(03)01416-5. [DOI] [PubMed] [Google Scholar]
- 20.Wagner BL, et al. Promoter-specific roles for liver X receptor/corepressor complexes in the regulation of ABCA1 and SREBP1 gene expression. Mol. Cell. Biol. 2003;23:5780–5789. doi: 10.1128/MCB.23.16.5780-5789.2003. [DOI] [PMC free article] [PubMed] [Google Scholar]
- 21.Saramaki A, et al. Regulation of the human p21(waf1/cip1) gene promoter via multiple binding sites for p53 and the vitamin D3 receptor. Nucleic Acids Res. 2006;34:543–554. doi: 10.1093/nar/gkj460. [DOI] [PMC free article] [PubMed] [Google Scholar]
- 22.Fukuchi J, et al. Antiproliferative effect of liver X receptor agonists on LNCaP human prostate cancer cells. Cancer Res. 2004;64:7686–7689. doi: 10.1158/0008-5472.CAN-04-2332. [DOI] [PubMed] [Google Scholar]
- 23.Huang YC, et al. Vitamin D(3) receptor/Sp1 complex is required for the induction of p27(Kip1) expression by vitamin D(3) Oncogene. 2004;23:4856–4861. doi: 10.1038/sj.onc.1207621. [DOI] [PubMed] [Google Scholar]
- 24.Liu JJ, et al. Expression of survivin and bax/bcl-2 in peroxisome proliferator activated receptor-{gamma} ligands induces apoptosis on human myeloid leukemia cells in vitro. Ann. Oncol. 2005;16:455–459. doi: 10.1093/annonc/mdi077. [DOI] [PubMed] [Google Scholar]
- 25.Dunlop TW, et al. The genes of the coactivator TIF2 and the corepressor SMRT are primary 1alpha,25(OH)(2)D(3) targets. J. Steroid Biochem. Mol. Biol. 2004;89–90:257–260. doi: 10.1016/j.jsbmb.2004.03.079. [DOI] [PubMed] [Google Scholar]
- 26.Liang H, et al. Chromosomal mapping and genomic organization of an evolutionarily conserved zinc finger gene ZNF277. Genomics. 2000;66:226–228. doi: 10.1006/geno.2000.6198. [DOI] [PubMed] [Google Scholar]
- 27.Krueger BJ, et al. LARP7 is a stable component of the 7SK snRNP while P-TEFb, HEXIM1 and hnRNP A1 are reversibly associated. Nucleic Acids Res. 2008;36:2219–2229. doi: 10.1093/nar/gkn061. [DOI] [PMC free article] [PubMed] [Google Scholar]
- 28.Jeronimo C, et al. Systematic analysis of the protein interaction network for the human transcription machinery reveals the identity of the 7SK capping enzyme. Mol. Cell. 2007;27:262–274. doi: 10.1016/j.molcel.2007.06.027. [DOI] [PMC free article] [PubMed] [Google Scholar]
- 29.Evans RM. The nuclear receptor superfamily: a rosetta stone for physiology. Mol. Endocrinol. 2005;19:1429–1438. doi: 10.1210/me.2005-0046. [DOI] [PubMed] [Google Scholar]
- 30.Carlberg C, et al. An integrated biological approach to nuclear receptor signaling in physiological control and disease. Crit. Rev. Eukaryot. Gene Expr. 2006;16:1–22. doi: 10.1615/critreveukargeneexpr.v16.i1.10. [DOI] [PubMed] [Google Scholar]
- 31.Everson GT. Steady-state kinetics of serum bile acids in healthy human subjects: single and dual isotope techniques using stable isotopes and mass spectrometry. J. Lipid Res. 1987;28:238–252. [PubMed] [Google Scholar]
- 32.Birt DF, et al. Influence of dietary fat on spontaneous lesions of Syrian golden hamsters. J. Natl Cancer Inst. 1983;71:401–406. [PubMed] [Google Scholar]
- 33.Riboli E, et al. Diet and bladder cancer in Spain: a multi-centre case-control study. Int. J. Cancer. 1991;49:214–219. doi: 10.1002/ijc.2910490212. [DOI] [PubMed] [Google Scholar]
- 34.Steinmaus CM, et al. Diet and bladder cancer: a meta-analysis of six dietary variables. Am. J. Epidemiol. 2000;151:693–702. doi: 10.1093/oxfordjournals.aje.a010264. [DOI] [PubMed] [Google Scholar]
- 35.Goodwin B, et al. Identification of bile acid precursors as endogenous ligands for the nuclear xenobiotic pregnane X receptor. Proc. Natl Acad. Sci. USA. 2003;100:223–228. doi: 10.1073/pnas.0237082100. [DOI] [PMC free article] [PubMed] [Google Scholar]
- 36.Maruyama T, et al. Identification of membrane-type receptor for bile acids (M-BAR) Biochem. Biophys. Res. Commun. 2002;298:714–719. doi: 10.1016/s0006-291x(02)02550-0. [DOI] [PubMed] [Google Scholar]
- 37.Fang Y, et al. Bile acids induce mitochondrial ROS, which promote activation of receptor tyrosine kinases and signaling pathways in rat hepatocytes. Hepatology. 2004;40:961–971. doi: 10.1002/hep.20385. [DOI] [PubMed] [Google Scholar]
- 38.Zandbergen F, et al. The G0/G1 switch gene 2 is a novel PPAR target gene. Biochem. J. 2005;392:313–324. doi: 10.1042/BJ20050636. [DOI] [PMC free article] [PubMed] [Google Scholar]
- 39.Ge K, et al. Transcription coactivator TRAP220 is required for PPAR gamma 2-stimulated adipogenesis. Nature. 2002;417:563–567. doi: 10.1038/417563a. [DOI] [PubMed] [Google Scholar]
- 40.Pineda Torra I, et al. Identification of DRIP205 as a coactivator for the Farnesoid X receptor. J. Biol. Chem. 2004;279:36184–36191. doi: 10.1074/jbc.M405126200. [DOI] [PubMed] [Google Scholar]
- 41.Desmond JC, et al. The aldo-keto reductase AKR1C3 is a novel suppressor of cell differentiation that provides a plausible target for the non-cyclooxygenase-dependent antineoplastic actions of nonsteroidal anti-inflammatory drugs. Cancer Res. 2003;63:505–512. [PubMed] [Google Scholar]
- 42.Daujat S, et al. Crosstalk between CARM1 methylation and CBP acetylation on histone H3. Curr. Biol. 2002;12:2090–2097. doi: 10.1016/s0960-9822(02)01387-8. [DOI] [PubMed] [Google Scholar]
- 43.Thomas C, et al. Targeting bile-acid signalling for metabolic diseases. Nat. Rev. Drug Discov. 2008;7:678–693. doi: 10.1038/nrd2619. [DOI] [PubMed] [Google Scholar]
- 44.Tirona RG, et al. The orphan nuclear receptor HNF4alpha determines PXR- and CAR-mediated xenobiotic induction of CYP3A4. Nat. Med. 2003;9:220–224. doi: 10.1038/nm815. [DOI] [PubMed] [Google Scholar]
- 45.Lucas B, et al. HNF4alpha reduces proliferation of kidney cells and affects genes deregulated in renal cell carcinoma. Oncogene. 2005;24:6418–6431. doi: 10.1038/sj.onc.1208794. [DOI] [PubMed] [Google Scholar]
- 46.Black MH, et al. Evidence of interaction between PPARG2 and HNF4A contributing to variation in insulin sensitivity in Mexican Americans. Diabetes. 2008;57:1048–1056. doi: 10.2337/db07-0848. [DOI] [PMC free article] [PubMed] [Google Scholar]
- 47.Campbell MJ, et al. A role for the PPARgamma in cancer therapy. PPAR Res. 2008;2008:314974. doi: 10.1155/2008/314974. [DOI] [PMC free article] [PubMed] [Google Scholar]
- 48.Warburg O. On the origin of cancer cells. Science. 1956;123:309–14. doi: 10.1126/science.123.3191.309. [DOI] [PubMed] [Google Scholar]
- 49.Campbell MJ, et al. The vitamin D receptor as a therapeutic target. Expert Opin. Ther. Targets. 2006;10:735–748. doi: 10.1517/14728222.10.5.735. [DOI] [PubMed] [Google Scholar]
Associated Data
This section collects any data citations, data availability statements, or supplementary materials included in this article.