Abstract
The assessment of acupuncture-induced effects on brain function is crucial. Ultrasound-assisted brain function monitoring and bioelectrical methods as well as near infrared spectroscopic procedures and functional magnetic resonance investigations form the basis for the latest scientific examination methods for acupuncture research. The laserneedle acupuncture, which was examined scientifically for the first time in Graz, represents a new painless and non-invasive acupuncture method. In this way, individual combinations of acupuncture points can be stimulated simultaneously according to traditional Chinese medicine. In the context of double-blind studies, effects in the brain could be demonstrated in a reproducible manner for the first time. This second part of the short review article summarizes some of the centrally measured effects of acupuncture obtained at the Medical University of Graz within the last 10 years.
Keywords: complementary medicine, integrative medicine, laserneedle acupuncture, traditional Chinese medicine
Introduction
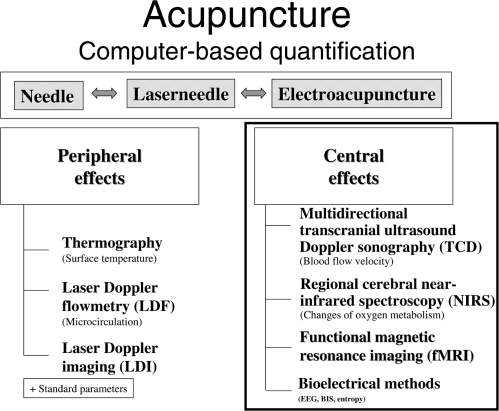
Using needle, laserneedle or electrical stimulation and modern biomedical techniques, changes in peripheral and cerebral activities can be quantified (1–8). This second part of the review lecture deals with central effects of acupuncture. The methods used therefore can be seen in Fig. 1, right panel.
Figure 1.
High-tech biomedical methods for computer-controlled quantification of peripheral (first part of this review article) and cerebral effects of acupuncture.
Similar to the first part of the review article, in all investigations described in this article, the test persons were informed about the procedure and gave their consent and were not under the influence of medication at the time of measurement. The studies were approved by the Ethics Committee of the Medical University of Graz.
Multidirectional Transcranial Ultrasound Doppler Sonography (TCD)
Cerebral blood flow velocity can be registered with compact ultrasound systems using the Doppler principle. Transmission frequencies usually lie between 1 and 20 MHz in vascular diagnostics or during monitoring (9). Low frequencies have a high penetration depth but low sonic reflection of blood cells, whereas high transmission frequencies have a lower penetration depth but better sonic reflection (10). Ultrasound waves are mechanic, matter-bound density waves with frequencies of >20 KHz. These are produced by electric alternating voltage being applied to piezoelectric crystals (‘transducer’). The waves propagate in biologic tissue (with the exception of bone) at a nearly constant speed (∼1550 m s−1) (11). The waves are totally or partially reflected and weakened by scattering and absorption at biologic-acoustic border regions. Ultrasound waves of low intensity (<10 mW cm−2; diagnostics) are considered to be harmless (11).
For intracranial TCD vascular monitoring, spectrum analysis is generally required due to the weak reflection of Doppler signals. A pulse curve above the zero line shows the course of blood flow to the probe in basal cerebral arteries, whereas the opposite is usually true for extracranial vessels. This curve was selected for reasons of definition, since the important intracranial vessel, the middle cerebral artery (MCA), shows the direction to the temporally applied ultrasound probe.
Branches of the MCA can usually be investigated at a depth of 3–4 cm, the media main trunk usually lies at a depth of 5.5–6.5 cm. Blood flow velocity in the internal carotid artery (distal part at a depth of 60–65 mm) as well as in the MCA can be determined by transtemporal entry. With increasing depth of measurement volumina, a part belonging to the anterior cerebral artery (ACA) can be also determined. If the ultrasound probe is turned slightly in the dorsal and caudal direction, the origin of the posterior cerebral artery (PCA) can be reached at a depth of 65–75 mm.
Registration of blood flow profiles in the ophthalmic artery (OA) was performed with a probe, applied lateral to the cornea on the closed bulb of the eye. Reduction in transmission energy should be achieved as far as possible, in order to avoid direct exposure to sonic waves of the lens (12). A signal from the OA is registered at a depth of 40–50 mm by a probe turned slightly in the central direction.
The foramen magnum offers a further path of entry for ultrasound measurements. Dependent upon anatomical variations, the basilar artery (BA) lies at a depth between 70 and 110 mm (12). The vertebral artery (VA) and the BA show blood flow directed away from the probe (3).
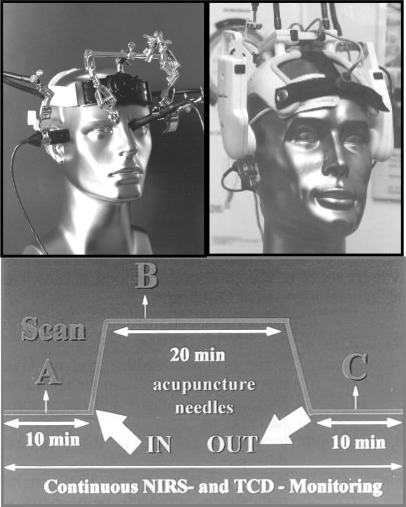
Here, we would like to note that several new developments in this field of research regarding the probe holder construction have been made, which can be applied in scientific studies with acupuncture specific monitoring (Fig. 2).
Figure 2.
High-tech helmet constructions for measuring cerebral effects of acupuncture. Measuring procedure (A, before; B, during and C after acupuncture). Modified from (20).
These new constructions have made it possible to perform simultaneous and continuous measurements of blood flow velocity in several larger vessels (e.g. MCA and OA) (13–15). Figure 2 (right upper panel) shows the construction (16) with which simultaneous and continuous flow profiles can be determined at eight different depths and represents the scientific instrument used in our first guiding acupuncture study performed in 1997 (17).
In the following, changes in TCD parameters under the influence of acupuncture in healthy volunteers are presented. Transcranial Doppler sonography was performed with three instruments (Multi Dop T, Multi Dop X4 and Smart Dop by DWL Electronic Systems GmbH, Sipplingen, Germany). We used 2 and 4 MHz probes applied with a new set-up and computer-controlled probes, which were integrated in a probe holder device (Fig. 2, left upper panel).
In addition to measuring blood flow velocity in the MCA, ACA, PCA, BA and VA, transorbital registrations were also performed. Here, the smallest intensity was used that yielded assessable signals (maximum 20 mW cm−2). Flow profiles of the supratrochlear artery (STA), the inner end branch of the OA, were measured transorbitally. This vessel is considerably constant and isolated and can be localized without directly exposing the bulbus to ultrasonic waves (18).
Monitoring of the STA was performed by applying an ultrasound probe with a special holder to the medial corner of the eye in a slightly medial and parietal direction and without pressure. The angle and position of the probe was altered under acoustic control until the largest possible signal amplitude could be achieved. In addition, alterations in flow velocities in the MCA were determined simultaneously and continuously in several studies.
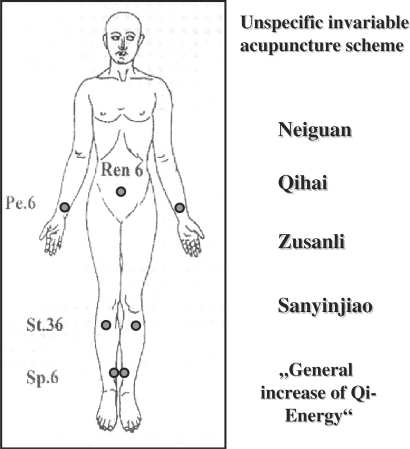
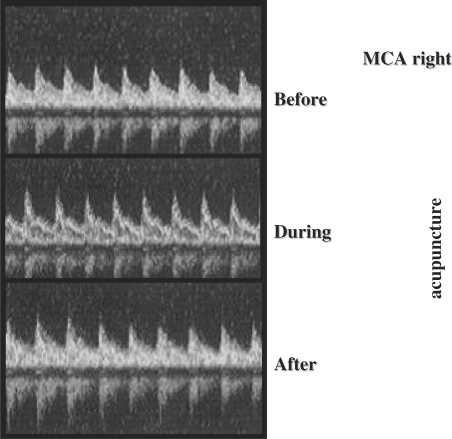
Mean blood flow velocity (vm) has proved to be an important parameter. Figure 2 schematically shows the measurement profile and phases of evaluation of the first published studies done by our research group (17,19–21). The acupoints used in these studies are shown in Fig. 3. Figure 4 shows a typical result of a significant increase of mean blood flow velocity in the MCA during manual needle acupuncture stimulation (17, 20, 21).
Figure 3.
The acupuncture pattern consisted of points that—according to TCM—lead to a general increase of Qi energy in the brain. Modified from (20).
Figure 4.
The blood flow profiles changed during and after acupuncture. The blood flow velocity increased on average by about 13%. Modified from (17).
Altogether, a total of 12 volunteers (mean age: 35.2 ± 4.4 years; 26–41 years) were examined using this first acupuncture-specific transcranial sonographic study (17,20,21). Four test persons were female, eight were male. The test subjects were positioned, relaxed on a bed before starting the procedure. Then the TCD measurement setup was positioned. After a 10 min resting period, an unspecific, constant acupuncture scheme was selected for all 12 test persons (Fig. 3). According to traditional Chinese medicine (TCM), this acupuncture scheme mobilizes the ‘general supply of energy’. In order to increase these possible effects, the needle at acupoint Qihai (Ren 6, CV 6) was additionally treated with moxibustion for 3 min.
The single acupoints were located using a point selecter (Pointoselect plus by Schwa-Medico, Gießen, Germany). After exact localization, the acupoints were punctured in a vertical and deep manner with single use needles. Acupuncture-specific De-Qi sensations were triggered in each case. The needles remained in place for 20 min without any further stimulation. After removing the needles, a concluding phase of 10 further minutes followed.
Data were evaluated with analysis of variance (one-way repeated-measure ANOVA) before, during, and after acupuncture. The TCD measurement data in this study were evaluated with vm in the right MCA. In addition, post hoc analysis (Tukey test) was performed (SigmaStat and SigmaPlot, Jandel Scientific Corp., Erkrath, Germany).
The results from the TCD parameters 10 min before, during (measuring time: 2 min after applying the needles) and 10 min after acupuncture showed a significant (P < 0.01; Tukey test) difference in vm during acupuncture compared to the phase before acupuncture. It is also interesting that the flow velocities during the control period after acupuncture yield higher values than prior to investigation (17,19–21).
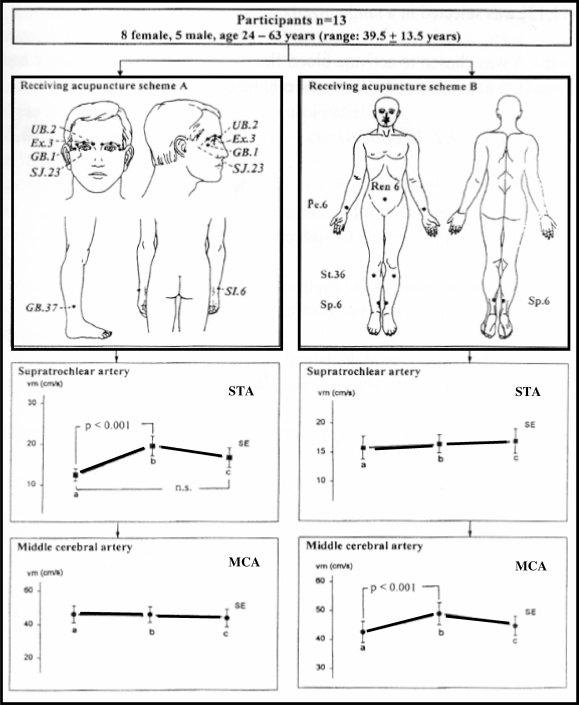
In a cross-over study design, 13 healthy volunteers aged between 24 and 63 years (mean age ± SD: 39.5 ± 13.5 years) were examined (22). Different acupuncture schemes and testing conditions were used on the same test person (Fig. 5).
Figure 5.
A cross-over study carried out on healthy volunteers is of particular significance. In the process, needles were inserted into the same test subject—once in the eye acupuncture pattern (A) and once with the pattern that increases the blood flow velocity in the middle cerebral artery (B). In the first examination with the eye pattern (left panels), the blood flow velocity increased in the STA, and in the other examination (right panels) it increased in the MCA. Modified from (22).
When using the optic scheme (Fig. 5A) a significant increase in blood flow velocity in the STA occurred, whereas the flow velocity in the MCA remained nearly unchanged. In reverse, scheme B led to a significant increase in flow velocity in the MCA with nearly unchanged flow profile patterns in the STA. Several cross-over studies were performed and confirmed the initial results of selective changes in cerebral perfusion after acupuncture (3,6–8,15,19). This meant that placebo trials could be avoided to a certain degree. The technique and study designs demonstrated that acupuncture produces specific and reproducible effects on the brain and eye but cannot explain the underlying mechanism (22).
In a further study, 27 healthy volunteers, (14 females, 13 males) with a mean age of 25.2 ± 4.1 ( ± SD) years (21–38 years) were examined (23). Seven eye-specific acupoints were tested on all volunteers in two different measurement series [laserneedle acupuncture (see part I of this review article) and needle acupuncture]. The acupuncture scheme consisted of two acupoints according to TCM: Zanzhu (UB.2; location: at the medial end of the eyebrow, vertically above the inner corner of the eye at the foramen of the supraorbital nerve. Needling: vertical 0.5–0.8 cun) and Yuyao (Ex.3; location: at the middle of the eyebrow vertically above the pupil; needling: oblique 0.3–0.5 cun). In addition, two ear acupoints (eye and liver: needling: oblique 0.3 cun), two eye-specific Korean hand acupuncture points (E2: needling: vertical 0.1–0.2 cun) and one acupoint from Chinese hand acupuncture (Yan Dian: location: at the ulnar side of the middle joint of the thumb; needling: oblique 0.2 cun) were stimulated (24–26). The different acupuncture methods were combined, since preliminary studies showed that the selection of these points led to increased effects in the measured cerebral parameters (15,19).
Three different types of needles (body: 0.25 × 25 mm, Huan Qiu, Suzhou, China; ear: 0.2 × 13 mm, European Marco Polo Comp., Albi, France; hand: 0.1 × 8 mm, Sooji-Chim, Korea) were used. Stimulation was done with simultaneous rotating and thrusting movements of medium intensity.
A 10 min resting period was taken after applying the monitoring sensors. Then, either laserneedle stimulation was activated or acupuncture needles were inserted and stimulated for 20 s. Thereafter, all lasers were either activated for 10 min or the inserted needles remained untouched in all test persons. The maximum amplitude of vm was used for analysis at this time. Two minutes after deactivation or removal of the needles a further control measurement was performed. Selection of which method was to be performed first was randomized. Each test person underwent laserneedle acupuncture as well as needle acupuncture. The resting time between each single examination was 20–30 min.
The results yielded a significant increase in vm in the OA during laserneedle acupuncture (P = 0.01) and needle acupuncture (P < 0.001). At the same time, non-significant changes in vm in the MCA were evident. Mean arterial blood pressure did not change significantly during laserneedle acupuncture or needle acupuncture. The maximum amplitude of vm was achieved in the OA with a time shift of 10–30 s after the initial stimulus in needle acupuncture was set, and with a delay of 20–60 s after starting laser stimulation.
Regional Cerebral Near-Infrared Spectroscopy (NIRS)
Because of its non-invasive approach the NIRS method allows the evaluation of cerebral oxygenation through the intact skull and is of great in importance in acupuncture research (5).
Different instrumental components are used in acupuncture research (27). One system applied in the field of research is the NIRO 300 (Hamamatsu Photonics, Hamamatsu, Japan). In addition to the already known parameters including changes in oxyhemoglobin (ΔO2Hb), deoxyhemoglobin (ΔHHb), complete hemoglobin (ΔcHb = ΔO2Hb + ΔHHb) and oxidized cytochrome aa3 (ΔCtOx) in micromoles determined by Lambert-Beer's principle, tissue oxygenation or TOI (Tissue Oxygenation Index) is determined in percentage. The absorption spectrometer measures the difference in optical densities at sequential measuring times during four selective wavelengths in the near-infrared range (four laserdiodes: ∼760, 820, 850 and 910 nm).
Only absolute changes in chromophore can be determined (micromolar), however not the level (absolute concentration) at which these changes (positive or negative direction) occur. The measurement value is zero as long as no changes in chromophore concentration take place (27).
The INVOS 5100 Oximeter (Somanetics Corp., Troy, USA) was also used in various acupuncture studies (5–8). Here, regional cerebral oxygen saturation (rSO2) was calculated in percent from the proportion of oxygenated and deoxygenated hemoglobin. Normal values lie between 60 and 80% (27).
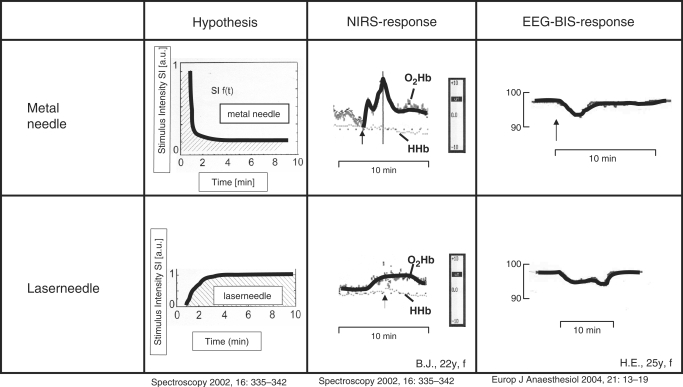
Figure 6 shows the hypothetically supposed function curves of stimulus intensity dependent upon the supposed duration of treatment. This diagram gains in value due to the actually measured, specific cerebral data regarding the changes in O2Hb and HHb shown on the right. The trend of the O2Hb parameter monitored by NIRS during laserneedle stimulation is nearly plateau-like. During manual metal needle stimulation, however, the O2Hb curve shows a sharp increase and a sharp decrease back to a value higher than the initial level.This is also the case in other parameters [e.g. bispectral analysis (BIS) of the electroencephalogram (EEG)] (6,7,28).
Figure 6.
This diagram shows stimulus intensity as a function of time. On the left, the hypotheses and on the right side real measured cerebral responses of NIRS parameters and bioelectric responses are shown. Note the difference between the metal needle and laserneedle. Metal needle shows a short-term increase and laserneedle a continuous increase like a plateau. Modified from (28,29).
Summarizing studies (5–7,29–32) documented a total of 328 measurements on 88 healthy volunteers (50 females, 38 males) at a mean age of 25.7 ± 4.0 ( ± SD) years (19–38 years).
A maximum of seven acupoints in different measurement series (needle acupuncture and laserneedle acupuncture) were investigated on the volunteers. The acupuncture schemes include two acupoints from TCM: Zanzhu (UB.2; needling: vertical 0.5–0.8 cun) and Yuyao (Ex.3; needling: slanted 0.3–0.5 cun). In addition, two ear acupoints (eye and liver; needling: slanted 0.3 cun), two specific eye acupoints according to Korean hand acupuncture (E2; needling: vertical 0.1–0.2 cun) and one acupoint from Chinese hand acupuncture (Yan Dian; needling: slanted 0.2 cun) were included in the study (24,29).
In addition, possible responses in NIRS parameters resulting from needling and stimulation of a placebo point (location: lateral radius 6 cun above the horizontal fold at the wrist exactly on the radial edge, lateral from the lung meridian) were investigated. The different acupuncture schemes were applied alone or in combined manner, since preliminary studies showed different effects on measurement parameters dependent upon which acupoint combinations were selected (e.g. blood flow velocity in the ophthalmic artery) (6–8).
A 10 min resting period was made after applying the near-infrared sensors at the frontal area of the head. Then, either laserneedle stimulation was activated or acupuncture needles were applied and stimulated for 20 s. Thereafter, all laserneedles were activated for 10 min or the needles were left undisturbed on the volunteer. During this time period, the maximum amplitude of ΔO2Hb and ΔHHb (phase during acupuncture) were analyzed. A control measurement (phase 5 min after acupuncture) was performed 5 min after deactivation or removal of the needles. Which technique was to be performed first and the sequence of stimulation (body, ear, hand and combination) was selected at random. The resting period between each of the measurements was at least 30 min.
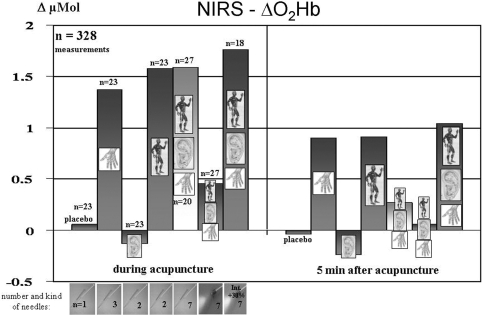
Figure 7 shows the mean values of the maximum changes in parameter O2Hb during acupuncture and 5 min after manual needle acupuncture or laserneedle acupuncture.
Figure 7.
Changes of oxyhemoglobin in the sense of increases are demonstrated in this diagram. Modified from (29,31,32).
Needling and stimulation of the placebo point did not lead to marked changes in cerebral NIRS parameters during or 5 min after acupuncture. The combination of Korean hand acupuncture (E2) and Chinese hand acupuncture (Yan Dian) as well as TCM body acupuncture [Zhanzhu (UB.2) and Yuyao (Ex.3)] and combined body, ear and hand acupuncture lead to a marked increase in O2Hb and a simultaneous decrease in HHb. This effect is still present 5 min after removing the needles or deactivating laserneedle stimulation. One case of minimal contrary behavior in O2Hb and HHb is present when needling or performing laser stimulation at both ear points (eye and liver). Standard monitoring parameters such as blood pressure did not show any significant changes during all types of acupuncture or combined acupuncture methods.
Functional Magnetic Resonance Imaging (fMRI)
Functional magnetic resonance experiments are based on the indirect representation of neuronal activity and the resulting metabolic and circulatory changes, particularly the relative changes in concentration of oxygenated and deoxygenated hemoglobin. This method has been successfully used to investigate changes in cerebral activity during acupuncture (4). The fMRI for investigating laserneedle acupuncture has only been used in a few studies (6,7,33). Based on the following observations some results should be shown exemplarily.
An acupuncture scheme comprising bilateral visual distant acupoints [Hegu (LI.4), Zusanli (St.36), Kunlun (UB.60), Zhiyin (UB.67)] was investigated (33).
The test persons were unable to determine whether the laserneedles were activated or deactivated during fMRI investigation. The fMRI study was based on a block design with alternating 2 min resting conditions (‘R’) and 2 min laserneedle activation (‘A’). The experiment began with ‘R’ followed by the laserneedle condition (‘A’). A total of three ‘R’ and three ‘A’ intervals were registered. Thus, each fMRI data recording period took 12 min.
Functional MRI data was analyzed and evaluated with SPM 99 (Statistical Parametric Mapping)—software (SPM 99, Welcome Department of Imaging Neuroscience, London, England). All images from the test persons were newly arranged and the first picture was taken as reference using ‘Sinc-interpolation’. Functional images were normalized spatially with a standard brain, thereafter they were smoothed with 6 mm Gauss-Kernel (33).
The activated voxels were determined with a contrast between the activated condition and the resting condition. Changes under the level P < 0.05 (correction for multiple comparisons with regard to the spatial extent of the performed activation) were considered to be significant. The activated regions were located using the Tailairach's atlas (33).
One result of the fMRI study showed significant changes in cerebral activity in the occipital and frontal regions during stimulation of visual acupoints (33).
Bioelectrical Brain Function Methods
Non-invasive bioelectrical neuromonitoring is gaining more and more attention in anesthesia and critical care. The bispectral index (BIS) is an important numerical descriptor of the EEG and is mainly used for assessing depth of anesthesia (28).
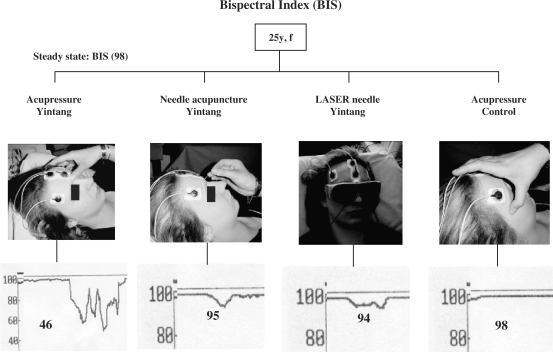
We found in healthy awake volunteers that acupressure at Yintang (Ex.1) results in statistically significant and clinically relevant reductions in BIS, while needle acupuncture, laserneedle acupuncture and acupressure at a control point result in statistically significant but clinically unimportant reductions (Fig. 8) (28). The results also highlight the electroencephalographic similarities of acupressure induced sedation and anesthesia (6,7,28).
Figure 8.
Acupressure was performed at a control point (right) and the BIS showed values of about 98. Laserneedle acupuncture at Yintang resulted in BIS of 94. Needle acupuncture at Yintang showed BIS of 95. Acupressure at Yintang (left) reduced the BIS to a value of 46. Modified from (28).
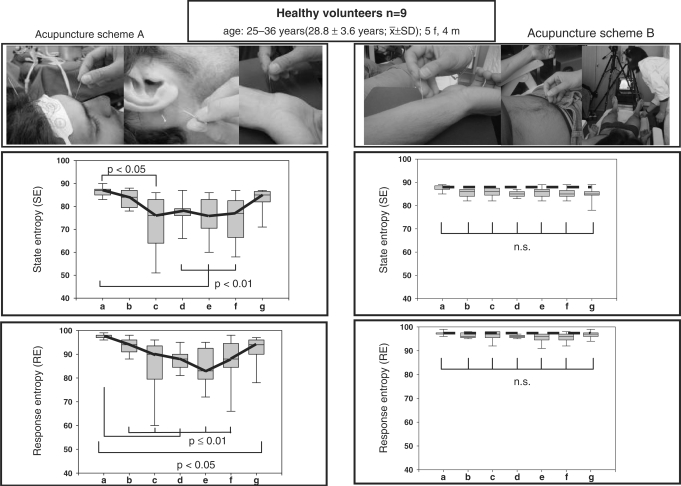
EEG entropy is also a new parameter that is used for quantification of depth of anesthesia. For the first time, the new method of entropy in EEGs was applied in an acupuncture study, and evidence regarding an acupuncture scheme consisting of ‘sedative acupoints’ compared to an acupuncture scheme that is considered to activate energy was validated (34). The study was conducted in a group of healthy volunteers (n = 9) to determine whether manual needle acupuncture and laser acupuncture stimulations applied to two groups of acupuncture points (sedative versus enhancement of energy) have effects on either state entropy (SE) or response entropy (RE) or both.
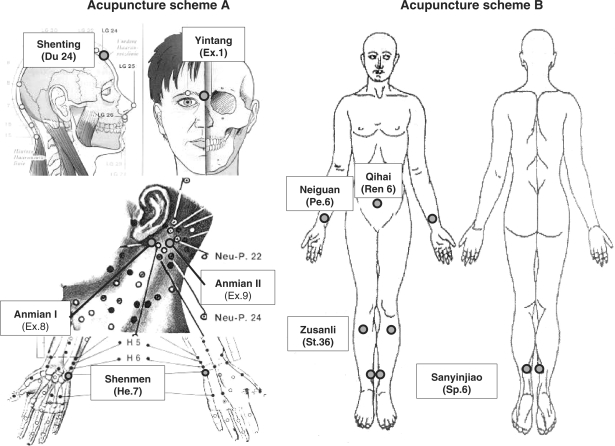
Two different acupuncture schemes were tested on different days using the same volunteer (Fig. 9). The first scheme (A) contained so-called sedative points and included the following acupuncture points in detail: Shenting (Du 24), Yintang (Ex.1), Sedative point 1 (Ex.8, Anmian I), Sedative point 2 (Ex.9, Anmian II) and Shenmen (He.7). Points Shenting and Yintang and their cerebral effects are described comprehensively in the scientific literature (35). Sedative point 1 is located at the median point of the connecting line between SJ 17 (Yi Feng) and Yi Ming (Ex.7). Sedative point 2 lies at the median point of the connection line between GB.20 (Feng Chi) and Yi Ming (Ex.7). The main indication for the latter two points is sleeplessness.
Figure 9.
Two different acupuncture schemes were tested on different days on the same volunteer. The first scheme contained so-called sedative points and scheme B consisted of points, which according to TCM should support the general increase of Qi. Modified from (34).
Scheme two (B) consists of points, which according to TCM should support the ‘general availability of Qi-energy’ (Fig. 9, right): Neiguan (Pe.6), Qihai (Ren 6), Zusanli (St.36) and Sanyinjiao (Sp.6). This scheme has been investigated by our study group a number of times and also leads to an increase in blood flow velocity of the MCA (6–8,15,17,19–22).
Measurement of entropy during needle and laserneedle acupuncture performed in this study showed that the brain plays a key role in acupuncture. Several preliminary investigations regarding this topic showed that acupressure can induce major effects in brain-specific neuromonitoring. For the first time, this study design could prove that two different acupuncture schemes can influence different parameters in the brain. The so-called ‘sedation point scheme’ (A) showed a significant decrease in both entropy parameters (RE + SE), which can be interpreted as a sedation effect in the EEG (Fig. 10). In the same volunteer, a different acupuncture scheme (B), which according to TCM leads to a general increase in Qi-energy, did not yield this effect. Moreover, several preliminary tests showed that the latter scheme leads to a significant increase in blood flow velocity in the MCA (17,19–22). In addition, this study (34) proves that laserneedle acupuncture is needle equivalent regarding the values of entropy described and has an important ranking as a painless method of acupuncture.
Figure 10.
Box-plot illustration of entropy parameters showed no significant differences using scheme B. In contrast, the sedation scheme A induced significant reductions in both entropy parameters. Modified from (34).
Conclusion
Bioengineering assessment of acupuncture can give evidence-based insight into different effects in the brain (4–8,36). Although we have measured similar effects of needle and laserneedle acupuncture, it cannot be concluded that the results are based on the same basic mechanisms. Therefore, further studies would be necessary to investigate the anatomy and function structure of different acupoints and conducting pathways.
Acknowledgements
The author thanks Ms Lu Wang, MD LA for performing acupuncture and Ms Ingrid Gaischek, MSc for her valuable support in data registration and analysis (both Research Unit of Biomedical Engineering in Anesthesia and Intensive Care Medicine, Medical University of Graz). Some studies were supported partly by the Zukunftsfonds of the Styrian Government (project 4071).
References
- 1.Litscher G. Bioengineering assessment of acupuncture, part 1: thermography. Crit Rev Biomed Eng. 2006;34:1–22. doi: 10.1615/critrevbiomedeng.v34.i1.10. [DOI] [PubMed] [Google Scholar]
- 2.Litscher G. Bioengineering assessment of acupuncture, part 2: monitoring of microcirculation. Crit Rev Biomed Eng. 2006;34:273–94. doi: 10.1615/critrevbiomedeng.v34.i4.10. [DOI] [PubMed] [Google Scholar]
- 3.Litscher G. Bioengineering assessment of acupuncture, part 3: ultrasound. Crit Rev Biomed Eng. 2006;34:295–326. doi: 10.1615/critrevbiomedeng.v34.i4.20. [DOI] [PubMed] [Google Scholar]
- 4.Litscher G. Bioengineering assessment of acupuncture, part 4: functional magnetic resonance imaging. Crit Rev Biomed Eng. 2006;34:327–45. doi: 10.1615/critrevbiomedeng.v34.i4.30. [DOI] [PubMed] [Google Scholar]
- 5.Litscher G. Bioengineering assessment of acupuncture, part 5: cerebral near infrared spectroscopy. Crit Rev Biomed Eng. 2006;34:439–57. doi: 10.1615/critrevbiomedeng.v34.i6.10. [DOI] [PubMed] [Google Scholar]
- 6.Litscher G, Schikora D. Laserneedle-acupuncture. Science and practice. Lengerich, Berlin, Bremen: Pabst Science Publishers; 2005. [Google Scholar]
- 7.Litscher G, Schikora D. Lasernadel-Akupunktur. Wissenschaft und Praxis. Lengerich, Berlin, Bremen: Pabst Science Publishers; 2004. (German) [Google Scholar]
- 8.Litscher G. Wissenschaftliche Grundlagen der Akupunktur. In: In: Bahr F, Bushe-Centmayer K, Dorfer L, Jost F, Litscher G, Suwanda S, et al., editors. Das große Buch der klassischen Akupunktur. Lehrbuch und Atlas. München: Elsevier Urban & Fischer; 2006. pp. 1–109. (German) [Google Scholar]
- 9.Bartels E. Color-coded duplex ultrasonography of the cerebral vessels. Atlas and manual. Stuttgart, New York: Schattauer; 1999. [Google Scholar]
- 10.Stöhr M, Riffel B, Pfadenhauer K. Neurophysiologische Untersuchungsmethoden in der Intensivmedizin. Berlin, Heidelberg: Springer; 1991. (German) [Google Scholar]
- 11.Marshall M. Praktische Doppler-Sonographie. 2. Auflage. Berlin, Heidelberg: Springer; 1996. (German) [Google Scholar]
- 12.Widder B. Doppler- und Duplexsonographie der hirnversorgenden Arterien. 5. Auflage. Berlin, Heidelberg: Springer; 1999. (German) [Google Scholar]
- 13.Litscher G, Yang NH, Schwarz G, Wang L. Computerkontrollierte Akupunktur: Eine neue Konstruktion zur simultanen und kontinuierlichen Erfassung der Blutflussgeschwindigkeit in der A. supratrochlearis und der A. cerebri media. Biomed Tech. 1999;44:58–63. doi: 10.1515/bmte.1999.44.3.58. (German) [DOI] [PubMed] [Google Scholar]
- 14.Litscher G, Wang L, Yang NH, Schwarz G. Ultrasound-monitored effects of acupuncture on brain and eye. Neurol Res. 1999;21:373–7. doi: 10.1080/01616412.1999.11740946. [DOI] [PubMed] [Google Scholar]
- 15.Litscher G, Cho ZH, editors. Computer-Controlled Acupuncture®. Lengerich Berlin Düsseldorf Riga Scottsdale Wien Zagreb: Pabst Science Publishers; 2000. [Google Scholar]
- 16.Litscher G. A mulitifunctional helmet for noninvasive neuromonitoring. J Neurosurg Anesthesiol. 1998;10:116–9. doi: 10.1097/00008506-199804000-00009. [DOI] [PubMed] [Google Scholar]
- 17.Litscher G, Schwarz G, Sandner-Kiesling A, Hadolt I. Transkranielle Doppler-Sonographie – Robotergesteuerte Sonden zur Quantifizierung des Einflusses der Akupunktur. Biomed Tech. 1997;42:116–22. doi: 10.1515/bmte.1997.42.5.116. (German) [DOI] [PubMed] [Google Scholar]
- 18.Keller H, Baumgartner G, Regli F. Carotisstenosen und -okklusionen. Diagnose durch perkutane Ultraschall-Doppler-Sonographie an der A. supraorbitalis oder A. supratrochlearis. Dtsch med Wschr. 1973;98:1691–8. doi: 10.1055/s-0028-1107110. (German) [DOI] [PubMed] [Google Scholar]
- 19.Litscher G. High-Tech Akupunktur®. Lengerich Berlin Düsseldorf: Pabst Science Publishers; 2001. (German) [Google Scholar]
- 20.Litscher G, Schwarz G, Sandner-Kiesling A, Hadolt I, Eger E. Effects of acupuncture on the oxygenation of cerebral tissue. Neurol Res. 1998;20 (Suppl 1):S28–32. doi: 10.1080/01616412.1998.11740605. [DOI] [PubMed] [Google Scholar]
- 21.Litscher G, Schwarz G, Sandner-Kiesling A, Hadolt I. Robotic transcranial Doppler sonography probes, & acupuncture. Int J Neurosci. 1998;95:1–15. doi: 10.3109/00207459809000645. [DOI] [PubMed] [Google Scholar]
- 22.Litscher G, Wang L, Yang NH, Schwarz G. Computer-controlled acupuncture. Quantification and separation of specific effects. Neurol Res. 1999;21:530–4. doi: 10.1080/01616412.1999.11740970. [DOI] [PubMed] [Google Scholar]
- 23.Litscher G, Schikora D. Neue Konzepte in der experimentellen Akupunkturforschung - computerkontrollierte Laserpunktur (CCL) mit der Laserneedle-technik. Europ Ztschr f Akupunktur. Der Akupunkturarzt/Aurikulotherapeut. 2002;3:18–27. (German) [Google Scholar]
- 24.Litscher G. Computer-based quantification of traditional chinese-, ear- and Korean hand acupuncture: needle-induced changes of regional cerebral blood flow velocity. Neurol Res. 2002;24:377–80. doi: 10.1179/016164102101200177. [DOI] [PubMed] [Google Scholar]
- 25.König G, Wancura I. Neue Chinesische Akupunktur. Lehrbuch und Atlas der Akupunkturpunkte. Wien München Bern: Wilhelm Maudrich; 1989. (German) [Google Scholar]
- 26.Yoo TW. Koryo hand therapy - Korean hand acupuncture. Seoul: Eum Yang Mek Jin Publishing Co; 2001. [Google Scholar]
- 27.Litscher G, Schwarz G, editors. Transcranial cerebral oximetry. Lengerich Berlin Düsseldorf Riga Scottsdale (USA) Wien Zagreb: Pabst Science Publishers; 1997. [Google Scholar]
- 28.Litscher G. Effects of acupressure, manual acupuncture, & laserneedle acupuncture on EEG bispectral index (BIS) and spectral edge frequency (SEF) in healthy volunteers. Europ J Anaesthesiol. 2004;21:13–9. doi: 10.1017/s0265021504001036. [DOI] [PubMed] [Google Scholar]
- 29.Litscher G, Schikora D. Near-infrared spectroscopy for objectifying cerebral effects of needle and laserneedle acupuncture. Spectroscopy. 2002;16:335–42. [Google Scholar]
- 30.Litscher G, Schikora D. Nahinfrarot-spektroskopische Untersuchungen zur Nadel- und Lasernadelakupunktur. AKU Akupunktur Theorie und Praxis. 2002;3:140–6. (German) [Google Scholar]
- 31.Litscher G. NIR spectroscopy explores the mysteries of acupuncture. Spectroscopy Europe. 2005;17:8–14. [Google Scholar]
- 32.Litscher G. NIR spectroscopy explores the mysteries of acupuncture. Spectroscopy Asia. 2005;1:8–14. [Google Scholar]
- 33.Litscher G, Rachbauer D, Ropele S, Wang L, Schikora D, Fazekas F, et al. Acupuncture using laser needles modulates brain function: first evidence from functional transcranial Doppler sonography and functional magnetic resonance imaging. Lasers Med Sci. 2004;19:6–11. doi: 10.1007/s10103-004-0291-0. [DOI] [PubMed] [Google Scholar]
- 34.Litscher G. Electroencephalogram-entropy and acupuncture. Anesth Analg. 2006;102:1745–51. doi: 10.1213/01.ane.0000217188.71710.47. [DOI] [PubMed] [Google Scholar]
- 35.Litscher G. Shenting and Yintang: quantification of cerebral effects of acupressure, manual acupuncture, and laserneedle acupuncture using high-tech neuromonitoring methods. Med Acup. 2005;16:24–9. [Google Scholar]
- 36.Lewith GT, White PJ, Pariente J. Investigating acupuncture using brain imaging techniques: the current state of play. Evid Based Complement Alternat Med. 2005;2:315–9. doi: 10.1093/ecam/neh110. [DOI] [PMC free article] [PubMed] [Google Scholar]
- 37.Litscher G. Bioengineering assessment of acupuncture, part 6: Monitoring- Neurophysiology. Crit Rev Biomed Eng. 2007;35:1–39. doi: 10.1615/critrevbiomedeng.v35.i1-2.10. [DOI] [PubMed] [Google Scholar]


