Abstract
Cardiac myosin binding protein C (cMyBP-C), bound to the sarcomere's myosin thick filament, plays an important role in the regulation of muscle contraction. cMyBP-C is a large multidomain protein that interacts with myosin, titin, and possibly actin. Mutations in cMyBP-C are the most common known cause of heritable hypertrophic cardiomypathies. Phosphorylation of cMyBP-C plays an essential role in the normal cardiac function. cMyBP-C (142 kDa) has 81 serine and 73 threonine residues presenting a major challenge for unequivocal identification of specific phosphorylation sites. Top-down mass spectrometry, which directly analyzes intact proteins, is a powerful technique to universally observe and quantify protein posttranslational modifications without a priori knowledge. Here, we have extended top-down electron capture dissociation mass spectrometry to comprehensively characterize mouse cMyBP-C expressed in baculovirus. We have unambiguously identified all of the phosphorylation sites in the truncated (28–115 kDa) and full-length forms of cMyBP-C (142 kDa) and characterized the sequential phosphorylations, using a combination of top-down and middle-down (limited proteolysis) MS approach, which ensures full sequence coverage. Unit mass resolution and high mass accuracy (<5 ppm) have been achieved for a 115-kDa protein (the largest protein isotopically resolved to date). Remarkably, we discovered that truncations in recombinant proteins, even a seemingly minor one, can dramatically alter its phosphorylation state, which is significant because truncated recombinant proteins are routinely substituted for their full-length forms in crystal structure and functional studies. Our study provides direct evidence of alterations in the posttranslational state between the truncated and full-length recombinant proteins, which can lead to variations in structure and function.
Keywords: electron capture dissociation, hypertrophic cardiomypathy
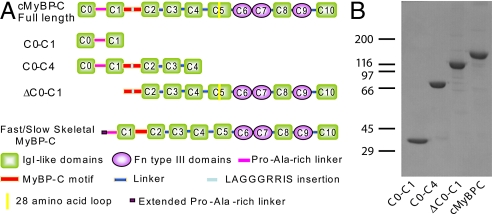
Cardiac myosin binding protein C (cMyBP-C), located in the sarcomere's thick filament, plays an important role in the regulation of cardiac contraction and maintenance of myosin filament structure (1–5). Mutations in cMyBP-C are widely recognized as the most common cause of many heritable hypertrophic cardiomypathies in which the heart is hypertrophied, hypercontractile, and susceptible to electric and mechanic failure (6). cMyBP-C is a large multidomain protein including 8 IgI-like domains and 3 fibronectin (Fn) type III-like domains, numbered from the N terminus as domains C0-C10 (Fig. 1). cMyBP-C is specific to cardiac muscle owing to an additional IgI domain at the N terminus (C0), insertion of 28 residues within the IgI (C5) domain and a 9-aa-residue insert within the MyBP-C motif compared with fast/slow skeletal MyBP-C (1, 2). The C terminus of cMyBP-C binds to the thick filament backbone via interactions with myosin and titin primarily through C7-C10 (2, 7). The C1-C2 region of MyBP-C also has been shown to bind to myosin S2 segment (8) and appears to interact with actin thin filament (9).
Fig. 1.
Baculovirus expressed cMyBP-C constructs. (A) Schematic representation of the 11 domains (8 IgI and 3 Fn) of cMyBP-C, full-length, and truncated forms compared with fast/slow skeletal MyBP-C. (B) SDS/PAGE analysis of full-length and truncated cMyBP-C stained with Coomassie Blue. Molecular weight standards (× 10−3) are indicated on the left.
Phosphorylation of cMyBP-C is believed to play an essential role in the regulation of cardiac function (1, 3, 10), likely by accelerating cross-bridge cycling rates and increasing both the rates and strength of contraction (11, 12). In this regard, cMyBP-C phosphorylation is significantly decreased during the development of heart failure and pathologic hypertrophy (10). More recently, it has been reported that cMyBP-C phosphorylation is cardioprotective when mouse hearts were subjected to ischemia and reperfusion injury (13). cMyBP-C is differentially phosphorylated at multiple sites by cAMP-dependent protein kinase A (PKA), protein kinase C (PKC) and Ca2+-calmodulin-activated kinase (10, 14). PKA potentially phosphorylates Ser-273, Ser-282, and Ser-302 in response to β-adrenergic stimulation (14), whereas PKC likely only phosphorylates Ser-273 and Ser-302 (15). PKA-mediated phosphorylation of cMyBP-C increases the proximity of myosin heads to actin (16), increases cross-bridge flexibility and its extension from the backbone of the thick filament toward actin, and changes cross-bridge orientation (17). PKA phosphorylation also controls the interaction of the regulatory domain of cMyBP-C with the S2 segment of myosin (18). There are other potential phosphorylation sites in cMyBP-C as suggested in recent proteomic studies on canine and rat hearts (19, 20). cMyBP-C has 81 serine and 73 threonine residues presenting a major challenge to fully characterize its phosphorylation state and identify specific physiologically relevant phosphorylation sites.
Biomolecular mass spectrometry (MS) (21) is the only technique that can universally provide information about protein posttranslational modifications (PTMs) without a priori knowledge (22–26). In contrast to the conventional “bottom-up” MS approach where proteins of interest are digested with an enzyme before MS analysis providing only partial coverage of the protein sequence with loss of connectivity between modified peptides from disparate regions of the protein (23, 27, 28), a “top-down” MS approach is extremely attractive for characterization of complex PTMs in proteins of 10 to 200 kDa (22, 25, 29–39). The top-down MS approach directly analyzes intact protein, allowing simultaneous observation and quantification of all possible protein modifications, and subsequently fragments the protein ions of interest in the mass spectrometer to locate the modification site(s) with full sequence coverage (25, 29, 30, 36). Moreover, the top-down MS approach is especially attractive for quantitatively determining the relative abundance of protein species with specific modifications, since the ionization efficiency of intact proteins is much less affected by the presence of modifying groups in comparison with peptides (22, 25, 35). The efficiency and sequence coverage in top-down analyses have been greatly improved with the recently developed tandem mass spectrometry (MS/MS) technique of electron capture dissociation (ECD) (40). ECD generates fragment-ion-rich data and is complementary to well-developed energetic dissociation methods such as collisionally activated dissociation (CAD) (41). More importantly, ECD is nonergodic (40, 42), which makes it especially suitable for localization of labile PTMs in peptides and proteins (25) (43–45).
Here, we extended top-down high-resolution ECD MS to comprehensively characterize mouse cMyBP-C (142 kDa) expressed in baculovirus and locate its possible phosphorylation sites together with a middle-down (38) MS approach with limited proteolysis. Remarkably, we discovered that all 3 truncated forms of recombinant cMyBP-C studied have dramatically different phosphorylation states even with a seemingly minor truncation compared with the full-length protein. Truncated recombinant proteins are routinely used to substitute the full-length forms in crystal structure (46) and functional studies (47). Our study provides direct evidence of alterations in posttranslational states between truncated and full-length recombinant proteins, which can lead to variations in their structure and function.
Results
Construction of the Recombinant cMyBP-C.
The full-length (C0-C10) and 3 truncated forms (C0-C1, C0-C4, and ΔC0-C1) of cMyBP-C were expressed in a baculovirus expression system (Fig. 1A). All of the constructs were designed with the FLAG epitope at the N terminus and purified on an anti-FLAG M2 agarose column. The relative sizes and purities of expressed proteins were confirmed by SDS/PAGE with Coomassie Blue staining (Fig. 1B). The amino acid sequence of the full-length recombinant cMyBP-C and the corresponding domains are shown in Fig. S1. The expressed cMyBP-C protein contains a total of 1,280 aa with a 10-aa N-terminal FLAG-tag epitope positioned right after the first methionine, and followed by the mouse cMyBP-C native sequence. Hence the putative phosphorylation sites in endogenous mouse cMyBP-C, i.e., Ser-273, Ser-282, and Ser-302, correspond to Ser-283, Ser-292, and Ser-312, respectively, in this recombinant cMyBP-C.
Truncated cMyBP-C C0-C1 Is Prevailingly Unphosphorylated.
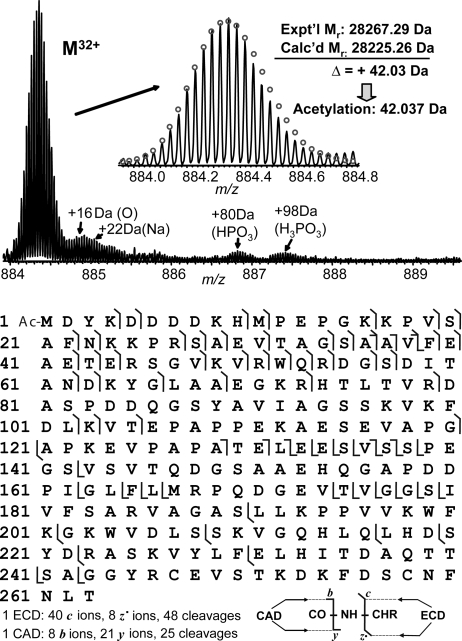
ESI/FTMS analysis of one truncated cMyBP-C, C0-C1, indicates that the most abundant molecular weight of the major component is 28,267.29, which is 42.03 Da higher than the predicted molecular weight of 28,225.26 from the DNA sequence (Fig. 2Upper). This mass discrepancy matched with an acetylation (42.037 Da), which was further confirmed by MS/MS and localized to the N terminus (Fig. 2 Lower). One ECD spectrum generated 40 c and 8 z• fragment ions representing 48 cleavages, and one CAD spectrum generated 8 b and 21 y ions representing 25 cleavages (Fig. 2 Lower). ECD and CAD are highly complementary, providing 71 of a total of 262 bond cleavages. Only trace phosphorylation (<5%) with a mass increase of 80 Da (HPO3) was observed for C0-C1. Other trace components were also observed, likely because of an oxidation (+16 Da), a sodium adduct (+22 Da), and a noncovalent adduct of phosphoric acid (+98 Da).
Fig. 2.
High resolution ESI/FTMS analysis of cMyBP-C C0-C1 expressed in baculovirus. (Upper) ESI/FTMS spectrum of C0-C1 intact protein ions (M32+), suggesting C0-C1 is acetylated and prevailingly unphosphorylated. (Lower) Fragmentation map from 1 ECD and 1 CAD spectra of C0-C1 matched with assignments to the DNA-predicted sequence of C0-C1 with an N-terminal acetylation.
Truncated cMyBP-C C0-C4 Is Phosphorylated at Ser-292, Ser-312, and Ser-484.
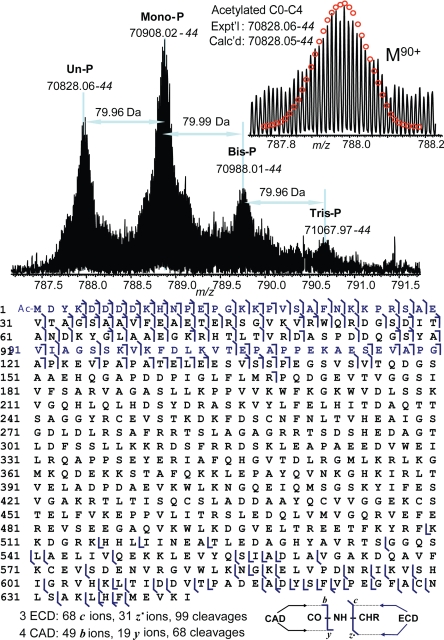
High resolution ESI/FTMS analysis of C0-C4 showed mono-, bis-, and tris-phosphorylations (Fig. 3Upper) with the relative percentages of un-, mono-, bis-, and tris-phosphorylated forms of 32%, 47%, 15% and 6%, respectively. Hence, the combined phosphorylated species comprised 68% of the total cMyBP-C population. The accurate molecular weight observed for unphosphorylated C0-C4 is 70,828.06, which matched to the DNA-predicted sequence with an acetylation (<1 ppm). ECD and CAD were directly applied to C0-C4, which localized the acetylation to the N terminus. The sum of 3 ECD spectra performed on 3 isolated charge states of C0-C4 yielded 68 c ions, and 31 z• ions, representing 99 cleavages. Four CAD spectra performed on 4 isolated charge states produce a total of 49 b ions and 19 y ions representing 68 cleavages. Both ECD and CAD generated fragments close to the C and N termini, providing 138 cleavages of 641 inter-residue bonds. No phosphorylation was detected in the first 168 aa from the N terminus and the first 133 aa from the C terminus. Therefore, MS/MS data narrow the phosphorylation sites to the Pro-169-Phe-509 sequence. A middle-down MS approach with limited Glu-C, Asp-N and Lys-C proteolysis was applied to C0-C4 to further locate the phosphorylation sites. A peptide generated from Asp-N proteolysis, D[274–315]E, shows mono- and bis-phosphorylations, whereas no tris-phosphorylated peptide was detected (Fig. S2A), ECD of the monophosphorylated D[274–315]E localized the 2 phosphorylation sites to Ser-292 and Ser-312 with partial phosphorylation occupancy (25) (Fig. S2B), suggesting that phosphorylation at these 2 sites occurs concurrently. Another peptide from Asp-N proteolysis, D[468–494]K, was also monophosphorylated, and ECD unambiguously localized the phosphorylation site to Ser-484, an unknown site (Fig. S3). Monophosphorylations were detected for peptides, D[274–292]S from Asp-N proteolysis, A[267–296]E, A[267–311]D, A[298–329]E from Glu-C proteolysis and K[367–491]K from Lys-C proteolysis, which verified phosphorylation sites at Ser-292 and Ser-312. In summary, the middle-down MS/MS with 1 Glu-C, 2 Asp-N, and 1 Lys-C proteolysis (Table S1) combined with top-down MS/MS data provide full sequence coverage for C0-C4, which unambiguously localized 3 phosphorylation sites to Ser-292, Ser-312, and Ser-484. A putative phosphorylation site, Ser-283, was not phosphorylated in C0-C4.
Fig. 3.
High resolution ESI/FTMS analysis of C0-C4 expressed in baculovirus. (Upper) ESI/FTMS spectrum of C0-C4 intact protein ions (M90+), suggesting C0-C4 is acetylated and mono-, bis-, and tris-phosphorylated. Un-P, mono-P, bis-P, and tris-P stand for the un-, mono-, bis-, and tris-phosphorylated C0-C4. (Lower) Fragmentation map from 3 ECD and 4 CAD spectra of C0-C4 matched with assignments to the DNA-predicted sequence of C0-C4 with an N-terminal acetylation.
Truncated cMyBP-C ΔC0-C1 Is Not Phosphorylated at Ser-283, Ser-292, and Ser-312.
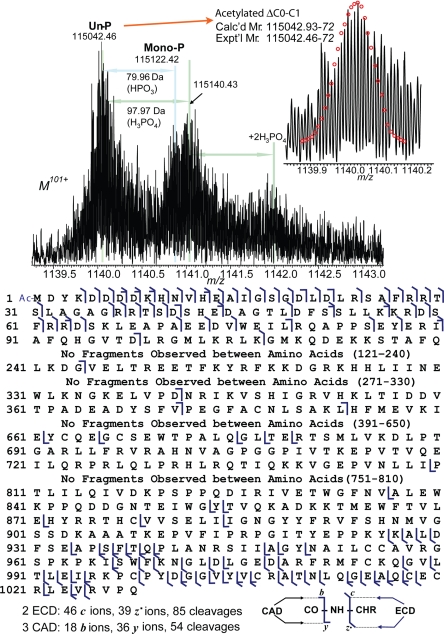
High resolution ESI/FTMS analysis of the truncated cMyBP-C, ΔC0-C1, yielded a unit resolution mass spectrum suggesting mono- and trace bis-phosphorylation and noncovalent adducts of phosphoric acid (Fig. 4Upper). The relative percentages of un-, mono-, and bis-phosphorylated forms are 70%, 24%, and 6%, respectively. The phosphorylated species comprised only 30% of the total cMyBP-C population. The accurate molecular weight obtained for the unphosphorylated ΔC0-C1 is 115,042.46-72, which matched exactly with the acetylated ΔC0-C1 (Calc'd 115,042.93-72, 4 ppm). ECD and CAD were performed on this 115-kDa protein, which localized the acetylation to the N terminus (Fig. 4 Lower). Two ECD spectra (Fig. S4) yielded 45 c ions, and 39 z• ions, representing 85 cleavages. Three CAD spectra produce 19 b ions and 36 y ions representing 54 cleavages. Very large fragment ions were observed such as b383 and y377. Combined ECD and CAD provide 115 cleavages of 1,027 inter-residue bonds. No phosphorylation was detected in the N-terminal 107 aa, which contains the putative phosphorylation sites, Ser-283, Ser-292, and Ser-312. No further efforts were made to locate the low abundance phosphorylation site in ΔC0-C1.
Fig. 4.
High resolution ESI/FTMS analysis of ΔC0-C1 expressed in baculovirus. (Upper) ESI/FTMS spectrum of ΔC0-C1 intact protein ions (M101+), suggesting ΔC0-C1 is acetylated and monophosphorylated. (Lower) Fragmentation map from 3 ECD and 4 CAD spectra of ΔC0-C1 matched with assignments to the DNA-predicted sequence of ΔC0-C1 with an N-terminal acetylation.
Full-Length cMyBP-C C0-C10 Is Phosphorylated at Ser-283, Ser-292, and Ser-312.
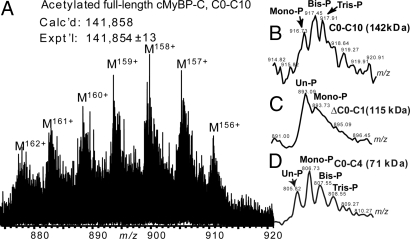
ESI/FTMS analysis of the full-length cMyBP-C yielded a measured molecular weight of 141,854 ± 13, compared with the theoretical value of 141,858 for the acetylated full-length protein, C0-C10 (Fig. 5A). The molecular ions were not resolved isotopically for full-length cMyBP-C due to its large size, which is beyond the resolving power of our 7T LTQ/FT. However, the low resolution MS data (Fig. 5B) detected by the LTQ clearly indicates that the full-length cMyBP-C mainly presented as mono-, bis-, and tris-phosphorylated forms. The mono-, bis-, and tris-phosphorylated species made up >90% of the entire cMyBP-C population. A comparison was made between the molecular ions of the full-length cMyBP-C (Fig. 5B) and the truncated cMyBP-C, ΔC0-C1 (Fig. 5C), and C0-C4 (Fig. 5D), which suggests a dramatic difference in the phosphorylation states of these 3 proteins. Full-length cMyBP-C mainly presented as the phosphorylated form, whereas ΔC0-C1 as the unphosphorylated form. The abundances of phosphorylated species in C0-C4 are much lower than that of full-length protein.
Fig. 5.
Comparison of ESI/MS spectra of full-length and truncated cMyBP-C. (A) High resolution ESI/FTMS spectrum of full-length cMyBP-C expressed in baculovirus. (B–D) Low resolution ESI/LTQMS spectrum of full-length cMyBP-C, C0-C10 (142 kDa) and truncated cMyBP-C, ΔC0-C1 (115 kDa), and C0-C4 (71 kDa). Un-P, mono-P, bis-P, and tris-P represent the un-, mono-, bis-, and tris-phosphorylated molecular ions, respectively.
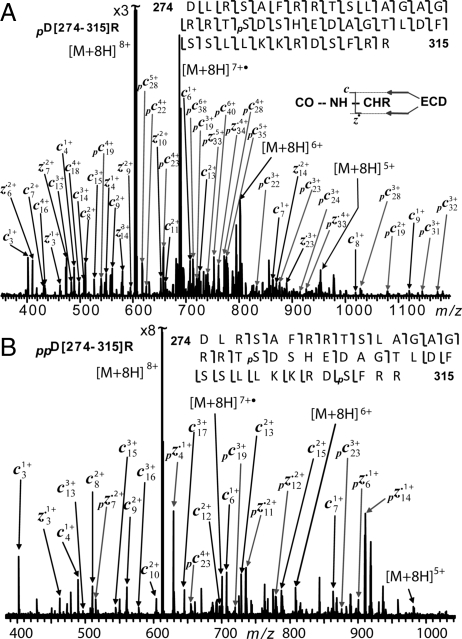
We have directly applied top-down MS/MS to this 142-kDa full-length cMyBP-C. Two CAD spectra produced 28 b ions and 14 y ions representing 42 cleavages. Two ECD spectra yielded 36 c ions and 23 z• ions representing 59 cleavages, which confirmed an N-terminal acetylation. Middle-down MS with limited proteolysis was applied to full-length cMyBP-C to locate the phosphorylation sites. One peptide resulting from Asp-N digestion D[274–315]R presented as the un-, mono-, bis-, and tris-phosphorylated forms (Fig. S5). ECD was performed on the monophosphorylated D[274–315]R (pD[274–315]R); 41 of 41 bonds were cleaved for this 42-aa peptide (Fig. 6A), which unambiguously identified Ser-292 as the phosphorylation site in this monophosphorylated D[274–315]R. The ECD spectrum of the bisphosphorylated D[274–315]R (ppD[274–315]R) identified 2 phosphorylation sites as Thr-291/Ser-292 and Ser-312 (Fig. 6B). This indicates that Ser-292 is the first site phosphorylated and Ser-312 the second. Mono- and bis-phosphorylations were detected for peptides, D[272–301]L, D[274–296]E (Fig. S6A), D[274–301]L and D[274–310]S from Asp-N proteolysis (Table S2). ECD of monophosphorylated D[274–296]E (p[274–296]E) confirms Ser-292 as the phosphorylation site (Fig. S6B). Moreover, ECD of bis-phosphorylated D[274–296]E unambiguously localized 2 phosphorylation sites to Ser-283 and Ser-292 (Fig. S6C). Only monophosphorylations were observed for peptides D[297–315]R, D[302–315]R from Asp-N proteolysis and K[309–356]K from Lys-C proteolysis. ECD of monophosphorylated D[302–315]R confirmed the phosphorylation site at Ser-312 (Fig. S7). In summary, the combined 3 Asp-N, 1 Glu-C, and 1 Lys-C proteolysis data (Table S2) and top-down MS/MS data localized 3 phosphorylation sites as Ser-283, Ser-292 and Ser-312 with full sequence coverage. Our data clearly indicate sequential phosphorylations within these 3 phosphorylation sites as Ser-292 being phosphorylated first, Ser-312 second, and Ser-283 third.
Fig. 6.
Identification of phosphorylation sites from limited Asp-N proteolysis of full-length cMyBP-C. (A) ECD spectrum of monophosphorylated D[274–315]R (pD[274–315]R) localizing Ser-292 as the phosphorylation site. (B) ECD spectrum of bisphosphorylated D[274–315]R (ppD[274–315]R) localizing Ser-292 and Ser-312 as the phosphorylation sites. The identified phosphorylation sites and the phosphorylated c/z• fragmentation ions are labeled with a “p.”
Discussion
Altered Phosphorylation State in Truncated Versus Full-Length cMyBP-C.
We present here the complete sequence characterization of full-length and truncated forms of cMyBP-C and identification of phosphorylation sites, using a combination of top-down and middle-down high-resolution mass spectrometry. The phosphorylation state observed for full-length baculovirus- expressed cMyBP-C resembles that of endogenous cMyBP-C (10). As reportedly by Robbins and coworkers, under basal conditions, cMyBP-C purified from wild-type mouse heart is mainly comprised of mono-, bis-, and tris-phosphorylated species (>90%).
Unexpectedly, none of the truncated cMyBP-C forms shows the same phosphorylation patterns as the full-length protein. An apparent difference was observed at the molecular ion level where the combined mono-, bis-, and tris-phosphorylated species in C0-C1, C0-C4, ΔC1-C2, and full-length comprised ≈5%, 68%, 30% and >90%, respectively, of their total ion population. The phosphorylation patterns in C0-C1 and ΔC1-C2 are dramatically different from those in C0-C4 and full-length cMyBP-C, whereas the overall phosphorylation level in the full-length protein is much higher than that of C0-C4.
Moreover, the identified phosphorylation sites in truncated proteins are also different from that of full-length cMyBP-C. We have identified the phosphorylation sites in full-length cMyBP-C as Ser-283, Ser-292, and Ser-312, which were identified as substrates for PKA (14). Furthermore, our data suggests a sequential phosphorylation among Ser-283, Ser-292 and Ser-312: the phosphorylation of Ser-292 occurs before phosphorylation of Ser-312 and Ser-283. Likely, the phosphorylation of Ser-292 located on a cardiac-specific loop LAGARRTS (in alignment with LAGGRRIS in the human sequence) represents the major regulatory phosphorylation site of MyBP-C for PKA and induces a conformational change that makes the other sites accessible by protein kinases (14). In contrast, none of the Ser-283, Ser-292 and Ser-312 sites was phosphorylated in ΔC1-C2. The phosphorylation sites in C0-C4 were localized to Ser-292, Ser-312, and Ser-484 with no apparent phosphorylation order as Ser-292 and Ser-312 were phosphorylated concurrently.
As the putative phosphorylation sites are located in the MyBP-C motif connecting C1 and C2 domains, it is conceivable that only trace phosphorylation was shown on truncated cMyBP-C C0-C1 (28 kDa) completely, which lacks MyBP-C motif. However, ΔC1-C2 (115 kDa), containing C2-C10 domains plus the cMyBP-C motif, exhibits a dramatic differences in its phosphorylation state compared with the full-length protein. It is likely that the truncation of the C0-C1 domain causes the neighboring cMyBP-C motif to adopt different folding, which in turn alters its phosphorylation state. The cMyBP-C motif appears to play a crucial functional role in the protein as it is conserved among various species and isoforms (14). Surprisingly, the phosphorylation state of C0-C4 is also different from the full-length protein despite the fact that C0-C4 has the entire N-terminal region and the MyBP-C motif is located in the middle of this sequence. Only 2 phosphorylation sites were observed in the cMyBP-C motif region for C0-C4 (Ser-292 and Ser-312), whereas 3 phosphorylation sites were observed for the full-length protein (Ser-283, Ser-292, and Ser-312). A highly abundant phosphorylation site (Ser-484) was identified for C0-C4, which was not present in the full-length cMyBP-C. Together, these differences in phosphorylation state suggest that the truncated forms adopted distinct protein folding and structural conformations. cMyBP-C is believed to play an important role in the regulation of contraction via the phosphorylation-dependent binding of its N-terminal C1-C2 region to myosin S2 domain (8, 14, 18, 48). Hence, the alterations in phosphorylation state could lead to variations in function between truncated and full-length cMyBP-C.
Top-Down High-Resolution ECD MS for Characterization of Large Proteins.
Here, we demonstrate that a 7T Fourier transform (FT) MS resolved proteins as large as 115 kDa with unit mass resolution, which is the largest protein isotopically resolved to date. A 9.4T FTMS has been used to achieve a unit resolution for a 112-kDa protein, as described in ref. 49. With unit resolution, high mass accuracy could be obtained (<5 ppm), as demonstrated here, which allows for identification of any possible PTMs including deamidation (35, 50). Here, we have also extended top-down ECD MS to a 140-kDa protein for characterization of its phosphorylation state, which is far larger than reported for a 45-kDa protein (30). Top-down ECD generates very rich fragmentation ions around the C and N termini, which unambiguously provides direct information about phosphorylation in the area covered.
However, the limitation for top-down analysis of large proteins is the difficulty to obtain larger fragments that cover the middle region of the proteins because of the increasing complexity of the tertiary structure (36). The largest fragments we observed are b383 and y377 from a CAD spectrum of ΔC0-C1 (115 kDa). Therefore, we have used a middle-down MS (38) with limited proteolysis, which generates larger peptides of 3–20 kDa rather than the typical peptides of 1–2 kDa in the conventional bottom-up approach. This middle-down MS approach provides information complementary to top-down MS analyses, because the peptides can be generated from any part of the proteins. Nevertheless, the recovery of peptides from limited proteolysis is typically unpredictable with 40–90% sequence coverage. Here, we have to use multiple types of proteolysis (Asp-N, Glu-C, and Lys-C) and different experimental settings to obtain full sequence coverage for both C0-C4 (71 kDa) and full-length cMyBP-C (142 kDa). In contrast to the bottom-up approach, the middle-down MS approach is able to generate larger peptides that contain multiple PTMs. For example, here a 4-kDa peptide D[274–315]R from limited Asp-N proteolysis of full-length cMyBP-C contained 3 phosphorylation sites, Ser-283, Ser-292, and Ser-312, which allowed us to directly characterize the sequence of phosphorylation among these sites.
As demonstrated, ECD MS provides great advantage and simplicity for localizing phosphorylation sites and characterizing sequential phosphorylations. Here, ECD MS unambiguously identified 3 phosphorylation sites in full-length cMyBP-C (142 kDa) of its total 81 Ser and 73 Thr residues and revealed a sequential phosphorylation of Ser-292 (first), Ser-312 (second), and Ser-283 (third). This is in agreement with a previous mutational analysis by Gautel et al. (14) that phosphorylation of Ser-292 by PKA is required before the 2 other sites are phosphorylated. However, despite substantial efforts involving construction of 4 site-directed mutants and 1 deletion mutant, their study did not provide any information for the sequence of phosphorylation between Ser-283 and Ser-312, which was quickly identified here by our ECD MS experiments.
In conclusion, we demonstrated the power of high-resolution top-down MS for deciphering the complex PTMs in cMyBP-C, a protein that is an important regulator of myocardial function and has also been implicated in diseases such as hypertrophic cardiomyopathy. Top-down MS provides a “bird's eye” view of all of the protein forms present and their relative abundances (38), thus allowing a direct comparison of the truncated and full-length forms of cMyBP-C. We have comprehensively characterized 3 truncated cMyBP-C forms (28–115 kDa) with unit resolution and high mass accuracy (<5 ppm). The combined top-down and middle-down MS data provided full sequence coverage for this 142-kDa cMyBP-C and precisely localized all of the phosphorylation sites. Our data demonstrated that truncations in recombinant protein can dramatically alter its phosphorylation state, presumably because of changes in structure, but which in turn could alter its function.
Methods
Expression and Purification.
DNA sequences encoding full-length or truncated cMyBPC proteins were PCR amplified from a clone containing the full-length mouse cMyBP-C sequence (courtesy of Dr. P.A. Powers, University of Wisconsin, Madison, WI). The sequence-verified PCR products were cloned into pFastBac1 transfer plasmid (Invitrogen). All expressed proteins contain an 11-aa N-terminal FLAG-tag epitope followed by the cMyBP-C native sequence. The resulting vectors encoding truncated and full-length forms of cMyBP-C were used for site-specific transposition of an expression cassette into bacmid. Baculovirus strains were prepared according to manufacturer instructions. High titer viral stocks were used to infect Sf9 cells monolayers (2.2 × 10⁷ cells per 15-cm plate). Cells were collected 80–96 h postinfection. Recombinant MyBP-C proteins were purified on anti-FLAG M2 agarose columns (Sigma).
Limited Asp-N, Glu-C, and Lys-C Proteolysis.
For Lys-C, Glu-C, and Asp-N proteolysis, 50–100 μg of cMyBP-C (in 10 mM Tris·HCl, pH 8.0, 0.1 M NaCl, 0.2 mM DTT) were added to the prepared Lys-C/Asp-N/Glu-C enzyme solution (Sigma) with a ratio between 1: 50 and 1:100 (wt/wt) of enzyme to protein. The resulting solution was incubated for 1–2 h at 37 °C and quenched with 2–3 μL of acetic acid.
Mass Spectrometry Analysis.
All intact cMyBP-C proteins and proteolytic products (20–100 μg) were desalted by an offline reverse phase protein trap (Michrom Bioresources) or by ultra-filtration using microcon centrifugal filter devices (Millipore). The samples were introduced to the mass spectrometer via an automated chip-based nanoESI source, the Triversa NanoMate (Advion BioSciences) with a spray voltage of 1.2–1.6 kV versus the inlet of the mass spectrometer, resulting in a flow of 50–200 nL/min. Intact protein molecular ions were analyzed using a 7T linear trap/FTICR (LTQ FT Ultra) hybrid mass spectrometer (Thermo Scientific). Individual charge states of the protein molecular ions were first isolated and then dissociated by ECD, using 2–3% “electron energy” and a 25–70-ms duration time with no delay. CAD was performed on isolated charge states with 15–20% collision energy. Up to 3,000 transients were averaged per spectrum to ensure high quality ECD/CAD spectra. All FTICR spectra were processed with Manual Xtract Software (FT programs 2.0.1.0.6.1.4, Xcalibur 2.0.5; Thermo Scientific), using a signal-to-noise threshold of 1.5 and fit factor of 60% and validated manually. The resulting monoisotopic mass lists were further searched with in-house “Ion Assignment” software. The Mr values reported in the study are all most abundant masses unless otherwise stated and the mass difference (in units of 1.00235 Da) between the most abundant isotopic peak and the monoisotopic peak is denoted in italics after each Mr value. For quantitative analysis, the top 10 most abundant isotopic peak heights were integrated to calculate the relative abundance of the intact protein.
Supplementary Material
Acknowledgments.
We thank Lin Li and Huseyin Guner for assistance in data analysis. This work was supported by the Wisconsin Partnership Fund for a Healthy Future, an American Heart Association Scientist Development Grant Grant (to Y.G.), and National Institutes of Health Grant R37 HL82900 (to R.M.).
Footnotes
The authors declare no conflict of interest.
This article is a PNAS Direct Submission. N.L.K. is a guest editor invited by the Editorial Board.
This article contains supporting information online at www.pnas.org/cgi/content/full/0813369106/DCSupplemental.
References
- 1.Winegrad S. Myosin binding protein C, a potential regulator of cardiac contractility. Circ Res. 2000;86:6–7. doi: 10.1161/01.res.86.1.6. [DOI] [PubMed] [Google Scholar]
- 2.Flashman E, Redwood C, Moolman-Smook J, Watkins H. Cardiac myosin binding protein C—Its role in physiology and disease. Circ Res. 2004;94:1279–1289. doi: 10.1161/01.RES.0000127175.21818.C2. [DOI] [PubMed] [Google Scholar]
- 3.de Tombe PP. Myosin binding protein C in the heart. Circ Res. 2006;98:1234–1236. doi: 10.1161/01.RES.0000225873.63162.c4. [DOI] [PubMed] [Google Scholar]
- 4.Zoghbi ME, Woodhead JL, Moss RL, Craig R. Three-dimensional structure of vertebrate cardiac muscle myosin filaments. Proc Natl Acad Sci USA. 2008;105:2386–2390. doi: 10.1073/pnas.0708912105. [DOI] [PMC free article] [PubMed] [Google Scholar]
- 5.Moss RL, Razumova M, Fitzsimons DP. Myosin crossbridge activation of cardiac thin filaments-Implications for myocardial function in health and disease. Circ Res. 2004;94:1290–1300. doi: 10.1161/01.RES.0000127125.61647.4F. [DOI] [PubMed] [Google Scholar]
- 6.Spirito P, Seidman CE, McKenna WJ, Maron BJ. Medical progress—The management of hypertrophic cardiomyopathy. N Engl J Med. 1997;336:775–785. doi: 10.1056/NEJM199703133361107. [DOI] [PubMed] [Google Scholar]
- 7.Freiburg A, Gautel M. A molecular map of the interactions between titin and myosin-binding protein C-Implications for sarcomeric assembly in familial hypertrophic cardiomyopathy. Euro J Biochem. 1996;235:317–323. doi: 10.1111/j.1432-1033.1996.00317.x. [DOI] [PubMed] [Google Scholar]
- 8.Kunst G, et al. Myosin binding protein C, a phosphorylation-dependent force regulator in muscle that controls the attachment of myosin heads by its interaction with myosin S2. Circ Res. 2000;86:51–58. doi: 10.1161/01.res.86.1.51. [DOI] [PubMed] [Google Scholar]
- 9.Razumova MV, et al. Effects of the N-terminal domains of myosin binding protein-C in an in vitro motility assay—Evidence for long-lived cross-bridges. J Biol Chem. 2006;281:35846–35854. doi: 10.1074/jbc.M606949200. [DOI] [PubMed] [Google Scholar]
- 10.Sadayappan S, et al. Cardiac myosin-binding protein-C phosphorylation and cardiac function. Circ Res. 2005;97:1156–1163. doi: 10.1161/01.RES.0000190605.79013.4d. [DOI] [PMC free article] [PubMed] [Google Scholar]
- 11.Stelzer JE, Dunning SB, Moss RL. Ablation of cardiac myosin-binding protein-C accelerates stretch activation in murine skinned myocardium. Circ Res. 2006;98:1212–1218. doi: 10.1161/01.RES.0000219863.94390.ce. [DOI] [PubMed] [Google Scholar]
- 12.Stelzer JE, Patel JR, Walker JW, Moss RL. Differential roles of cardiac myosin-binding protein C and cardiac troponin I in the myofibrillar force responses to protein kinase a phosphorylation. Circ Res. 2007;101:503–511. doi: 10.1161/CIRCRESAHA.107.153650. [DOI] [PubMed] [Google Scholar]
- 13.Sadayappan S, et al. Cardiac myosin binding protein C phosphorylation is cardioprotective. Proc Natl Acad Sci USA. 2006;103:16918–16923. doi: 10.1073/pnas.0607069103. [DOI] [PMC free article] [PubMed] [Google Scholar]
- 14.Gautel M, Zuffardi O, Freiburg A, Labeit S. Phosphorylation switches specific for the cardiac isoform of myosin binding protein-C—a modulator of cardiac contraction. EMBO J. 1995;14:1952–1960. doi: 10.1002/j.1460-2075.1995.tb07187.x. [DOI] [PMC free article] [PubMed] [Google Scholar]
- 15.Mohamed AS, Dignam JD, Schlender KK. Cardiac myosin-binding protein C (MyBP-C): Identification of protein kinase A and protein kinase C phosphorylation sites. Arch Biochem Biophys. 1998;358:313–319. doi: 10.1006/abbi.1998.0857. [DOI] [PubMed] [Google Scholar]
- 16.Colson BA, et al. Protein kinase A-mediated phosphorylation of cMyBP-C increases proximity of myosin heads to actin in resting myocardium. Circ Res. 2008;103:244–251. doi: 10.1161/CIRCRESAHA.108.178996. [DOI] [PMC free article] [PubMed] [Google Scholar]
- 17.Weisberg A, Winegrad S. Alteration of myosin cross bridges by phosphorylation of myosin-binding protein C in cardiac muscle. Proc Natl Acad Sci USA. 1996;93:8999–9003. doi: 10.1073/pnas.93.17.8999. [DOI] [PMC free article] [PubMed] [Google Scholar]
- 18.Gruen M, Prinz H, Gautel M. CAPK-phosphorylation controls the interaction of the regulatory domain of cardiac myosin binding protein C with myosin-S2 in an on-off fashion. Febs Lett. 1999;453:254–259. doi: 10.1016/s0014-5793(99)00727-9. [DOI] [PubMed] [Google Scholar]
- 19.Yuan C, et al. Myosin binding protein C is differentially phosphorylated upon myocardial stunning in canine and rat hearts—Evidence for novel phosphorylation sites. Proteomics. 2006;6:4176–4186. doi: 10.1002/pmic.200500894. [DOI] [PubMed] [Google Scholar]
- 20.Yuan C, et al. Quantitative comparison of sarcomeric phosphoproteomes of neonatal and adult rat hearts. Am J Physiol Heart Circ Physiol. 2008;295:H647–H656. doi: 10.1152/ajpheart.00357.2008. [DOI] [PMC free article] [PubMed] [Google Scholar]
- 21.McLafferty FW, Fridriksson EK, Horn DM, Lewis MA, Zubarev RA. Biochemistry—Biomolecule mass spectrometry. Science. 1999;284:1289–1290. doi: 10.1126/science.284.5418.1289. [DOI] [PubMed] [Google Scholar]
- 22.Pesavento JJ, Mizzen CA, Kelleher NL. Quantitative analysis of modified proteins and their positional isomers by tandem mass spectrometry: Human histone H4. Anal Chem. 2006;78:4271–4280. doi: 10.1021/ac0600050. [DOI] [PubMed] [Google Scholar]
- 23.Mann M, Jensen ON. Proteomic analysis of post-translational modifications. Nat Biotechnol. 2003;21:255–261. doi: 10.1038/nbt0303-255. [DOI] [PubMed] [Google Scholar]
- 24.Pesavento JJ, Bullock CR, Leduc RD, Mizzen CA, Kelleher NL. Combinatorial modification of human histone H4 quantitated by two-dimensional liquid chromatography coupled with top down mass spectrometry. J Biol Chem. 2008;283:14927–14937. doi: 10.1074/jbc.M709796200. [DOI] [PMC free article] [PubMed] [Google Scholar]
- 25.Zabrouskov V, Ge Y, Schwartz J, Walker JW. Unraveling molecular complexity of phosphorylated human cardiac troponin I by top down electron capture dissociation/electron transfer dissociation mass spectrometry. Mol Cell Proteomics. 2008;7:1838–1849. doi: 10.1074/mcp.M700524-MCP200. [DOI] [PubMed] [Google Scholar]
- 26.Mann M, Kelleher NL. Precision proteomics: The case for high resolution and high mass accuracy. Proc Natl Acad Sci USA. 2008;105:18132–18138. doi: 10.1073/pnas.0800788105. [DOI] [PMC free article] [PubMed] [Google Scholar]
- 27.Chait BT. Mass spectrometry: Bottom-up or top-down? Science. 2006;314:65–66. doi: 10.1126/science.1133987. [DOI] [PubMed] [Google Scholar]
- 28.Kjeldsen F, Savitski MM, Nielsen ML, Shi L, Zubarev RA. On studying protein phosphorylation patterns using bottom-up LC-MS/MS: The case of human alpha-casein. Analyst. 2007;132:768–776. doi: 10.1039/b701902e. [DOI] [PubMed] [Google Scholar]
- 29.Kelleher NL, et al. Top down versus bottom up protein characterization by tandem high-resolution mass spectrometry. J Am Chem Soc. 1999;121:806–812. [Google Scholar]
- 30.Ge Y, et al. Top down characterization of larger proteins (45 kDa) by electron capture dissociation mass spectrometry. J Am Chem Soc. 2002;124:672–678. doi: 10.1021/ja011335z. [DOI] [PubMed] [Google Scholar]
- 31.Ge Y, et al. Top down characterization of secreted proteins from Mycobacterium tuberculosis by electron capture dissociation mass spectrometry. J Am Soc Mass Spectrom. 2003;14:253–261. doi: 10.1016/s1044-0305(02)00913-3. [DOI] [PubMed] [Google Scholar]
- 32.Ge Y, et al. Detection of four oxidation sites in viral prolyl-4-hydroxylase by top-down mass spectrometry. Protein Sci. 2003;12:2320–2326. doi: 10.1110/ps.03244403. [DOI] [PMC free article] [PubMed] [Google Scholar]
- 33.Zabrouskov V, Giacomelli L, van Wijk KJ, McLafferty FW. New approach for plant proteomics—Characterization of chloroplast proteins of Arabidopsis thaliana by top-down mass spectrometry. Mol Cell Proteomics. 2003;2:1253–1260. doi: 10.1074/mcp.M300069-MCP200. [DOI] [PubMed] [Google Scholar]
- 34.Jebanathirajah JA, et al. Characterization of a new qQq-FTICR mass spectrometer for post-translational modification analysis and top-down tandem mass Spectrometry of whole proteins. J Am Soc Mass Spectrom. 2005;16:1985–1999. doi: 10.1016/j.jasms.2005.08.008. [DOI] [PubMed] [Google Scholar]
- 35.Zabrouskov V, et al. Stepwise deamidation of ribonuclease A at five sites determined by top down mass spectrometry. Biochemistry. 2006;45:987–992. doi: 10.1021/bi0517584. [DOI] [PMC free article] [PubMed] [Google Scholar]
- 36.Han XM, Jin M, Breuker K, McLafferty FW. Extending top-down mass spectrometry to proteins with masses greater than 200 kilodaltons. Science. 2006;314:109–112. doi: 10.1126/science.1128868. [DOI] [PubMed] [Google Scholar]
- 37.Xie YM, Zhang J, Yin S, Loo JA. Top-down ESI-ECD-FT-ICR mass spectrometry localizes noncovalent protein-ligand binding sites. J Am Chem Soc. 2006;128:14432–14433. doi: 10.1021/ja063197p. [DOI] [PubMed] [Google Scholar]
- 38.Siuti N, Kelleher NL. Decoding protein modifications using top-down mass spectrometry. Nat Methods. 2007;4:817–821. doi: 10.1038/nmeth1097. [DOI] [PMC free article] [PubMed] [Google Scholar]
- 39.Zabrouskov V, Whitelegge JP. Increased coverage in the transmembrane domain with activated-ion electron capture dissociation for top-down Fourier-transform mass spectrometry of integral membrane proteins. J Proteome Res. 2007;6:2205–2210. doi: 10.1021/pr0607031. [DOI] [PubMed] [Google Scholar]
- 40.Zubarev RA, et al. Electron capture dissociation for structural characterization of multiply charged protein cations. Anal Chem. 2000;72:563–573. doi: 10.1021/ac990811p. [DOI] [PubMed] [Google Scholar]
- 41.Senko MW, Speir JP, McLafferty FW. Collisional activation of large multiply-charged ions using fourier-transform mass-spectrometry. Anal Chem. 1994;66:2801–2808. doi: 10.1021/ac00090a003. [DOI] [PubMed] [Google Scholar]
- 42.Zubarev RA, Kelleher NL, McLafferty FW. Electron capture dissociation of multiply charged protein cations. A nonergodic process. J Am Chem Soc. 1998;120:3265–3266. [Google Scholar]
- 43.Mirgorodskaya E, Roepstorff P, Zubarev RA. Localization of O-glycosylation sites in peptides by electron capture dissociation in a fourier transform mass spectrometer. Anal Chem. 1999;71:4431–4436. doi: 10.1021/ac990578v. [DOI] [PubMed] [Google Scholar]
- 44.Kelleher NL, et al. Localization of labile posttranslational modifications by electron capture dissociation: The case of gamma-carboxyglutamic acid. Anal Chem. 1999;71:4250–4253. doi: 10.1021/ac990684x. [DOI] [PubMed] [Google Scholar]
- 45.Cooper HJ, Hakansson K, Marshall AG. The role of electron capture dissociation in biomolecular analysis. Mass Spectrom Rev. 2005;24:201–222. doi: 10.1002/mas.20014. [DOI] [PubMed] [Google Scholar]
- 46.Govada L, et al. Crystal structure of the C1 domain of cardiac myosin binding protein-C: Implications for hypertrophic cardiomyopathy. J Mol Biol. 2008;378:387–397. doi: 10.1016/j.jmb.2008.02.044. [DOI] [PubMed] [Google Scholar]
- 47.Whitten AE, Jeffries CM, Harris SP, Trewhella J. Cardiac myosin-binding protein C decorates F-actin: Implications for cardiac function. Proc Natl Acad Sci USA. 2008;105:18360–18365. doi: 10.1073/pnas.0808903105. [DOI] [PMC free article] [PubMed] [Google Scholar]
- 48.Oakley CE, Chamoun J, Brown LJ, Hambly BD. Myosin binding protein-C: Enigmatic regulator of cardiac contraction. Int J Biochem Cell Biol. 2007;39:2161–2166. doi: 10.1016/j.biocel.2006.12.008. [DOI] [PubMed] [Google Scholar]
- 49.Kelleher NL, Senko MW, Siegel MM, McLafferty FW. Unit resolution mass spectra of 112 kDa molecules with 3 Da accuracy. J Am Soc Mass Spectrom. 1997;8:380–383. [Google Scholar]
- 50.Cournoyer JJ, Lin C, O'Connor PB. Detecting deamidation products in proteins by electron capture dissociation. Anal Chem. 2006;78:1264–1271. doi: 10.1021/ac051691q. [DOI] [PubMed] [Google Scholar]
Associated Data
This section collects any data citations, data availability statements, or supplementary materials included in this article.


