

Abstract
A transportable prototype Faraday rotation spectroscopic system based on a tunable external cavity quantum cascade laser has been developed for ultrasensitive detection of nitric oxide (NO). A broadly tunable laser source allows targeting the optimum Q3/2(3/2) molecular transition at 1875.81 cm−1 of the NO fundamental band. For an active optical path of 44 cm and 1-s lock-in time constant minimum NO detection limits (1σ) of 4.3 parts per billion by volume (ppbv) and 0.38 ppbv are obtained by using a thermoelectrically cooled mercury–cadmium–telluride photodetector and liquid nitrogen-cooled indium–antimonide photodetector, respectively. Laboratory performance evaluation and results of continuous, unattended monitoring of atmospheric NO concentration levels are reported.
Keywords: external cavity laser, nitric oxide detection, midinfrared, magnetic circular birefringence, paramagnetic species
In this article, we describe the development and performance of a prototype transportable, cryogen-free spectroscopic sensing system for ultrasensitive detection of atmospheric nitric oxide (NO) based on Faraday rotation spectroscopy (FRS). The FRS technique as a method for improving sensitivity by reducing source noise was first reported in the 1980s with a color-center laser source (1). The recent availability of thermoelectrically cooled widely tunable continuous wave (CW) external cavity quantum cascade lasers (EC-QCLs) (2) makes feasible a transportable FRS NO sensor targeting the optimum Q3/2(3/2) NO absorption line of the fundamental vibration at 5.33 μm that has great potential for development into a compact field-deployable system.
Ultrasensitive trace gas detection is of increasing interest in various applications including environmental monitoring, industrial emission measurements, chemical analysis, medical diagnostics, and security. The combination of midinfrared, continuous wave, high-performance QCL sources with sensitive spectroscopic measurement techniques is leading to improved specificity, and lower minimum detection limits (MDLs) for many molecular species as compared with nonoptical chemical sensors. This work was made possible by recent advances in QCL fabrication technology that have resulted in Fabry–Perot QC laser chips with wide gain bandwidth and high-output power levels at room temperature (3). These developments permit the construction of widely tunable EC-QCLs like the one used here.
Our development of an EC-QCL-based FRS spectrometer was motivated by the current need for monitoring and quantifying the significant increase of atmospheric NO concentration levels due to combustion emissions that are impacting air quality in urban environments worldwide. NO molecules play a major role in atmospheric chemistry and significantly contribute to the formation of photochemical smog and acid rain and to the depletion of the stratospheric ozone layer (4, 5). Furthermore, NO at low concentrations in human and mammalian cells is of great importance in the regulation of biological and physiological processes (6). Therefore, the ability to perform accurate quantitative measurements of NO at or below the parts per billion by volume (ppbv) level is of considerable importance for a number of real-world applications.
FRS
In the vicinity of a Zeeman-split absorption line of the paramagnetic molecule, the 2 oppositely circularly polarized components have different wavelength-dependent complex propagation constants interacting with the Zeeman split Δ MJ = +1 and Δ MJ = −1 NO transition components resulting in magnetic circular birefringence (MCB) and magnetic circular dichroism. For linearly polarized light, which can be considered as a superposition of right-hand circularly polarized (RHCP) and left-hand circularly polarized (LHCP) light, propagation for a distance L through a MCB medium rotates its plane of polarization by an angle Θ = ΔnLπ/λ, where Δn = nR − nL is the difference between refractive index for RHCP (nR) and LHCP (nL) respectively. The refractive index difference, Δn, is proportional to the concentration of the absorber.
The sample cell is surrounded by a solenoid and placed between 2 nearly crossed polarizers, and the magnetic field is modulated by using an alternated solenoid current. The Zeeman splitting caused by the field results in rotation of the plane of polarization of light, thus modulating the light transmitted through the second polarizer (analyzer). For low gas concentrations and short optical paths, magnetic circular dichroism is negligible, and only the MCB signal from the difference between 2 dispersion curves contributes to FRS signal. See supporting information (SI) for a detailed discussion of FRS.
An alternate FRS approach (7) is to orient the second Rochon polarizer at 45° to the first. This splits the original beam into 2 equally intense beams of perpendicular polarization; these beams are directed to 2 balanced detectors, and Faraday rotation is measured as a difference between the 2 signals. Which method is best depends on many factors: laser power, source noise in the laser, saturation of the absorption, and detector parameters (sensitivity, saturation, linearity, etc.). Additional frequency modulation can be used with any of the FRS methods to approach quantum noise (QN)-limited performance (8). In this work, we have used the simple single-detector approach with nearly crossed polarizers.
In a situation where the main noise source arises from laser amplitude fluctuations, improved sensitivity through FRS is achieved by reducing laser source noise by a factor larger than the simultaneous reduction of signal. Source noise from laser amplitude fluctuations is at a minimum when the polarizers are exactly crossed and initially increases quadratically upon uncrossing. The FRS signal is null at exact crossing but increases linearly upon uncrossing. The signal-to-noise ratio (SNR) improvement arises because the linear growth of signal is faster initially than the quadratic growth of noise. Obviously detector noise is unaffected by the polarizer crossing angle. Quantum or shot noise grows with uncrossing in the same way as signal. This will be discussed below. In the work reported here, detector noise and available laser power are determinative. See SI for details.
The FRS method (1, 9), although it shares with laser magnetic resonance spectroscopy (LMRS) the use of magnetic modulation, differs significantly from it. When the 2 approaches were compared on the NO fundamental (9), FRS sensitivity was found to be an order of magnitude better than the LMRS technique. FRS has been used as an extremely sensitive technique for the detection of paramagnetic molecules such as NO (1, 7, 10–12), nitrogen dioxide (8, 13), oxygen (14), or hydroxyl radicals (15). FRS is well suited for atmospheric measurements of free radicals (16) or for exhaled breath analysis because interference from diamagnetic species (such as water and carbon dioxide) is eliminated. Demonstration of FRS for real-time monitoring of exhaled NO (17) or biogenic NO released from human sweat (18) have been used to diagnose asthma and other respiratory disorders and for biomedical and physiological applications, respectively.
In this article, we focus on the development of a transportable, autonomous, cryogen-free FRS NO system targeting the optimum absorption line of its fundamental vibrational transition for sensitive detection of atmospheric NO. The ability to target the optimum transition with a very quiet source has made possible the construction of a highly sensitive instrument, for which there is a clear improvement path to an even more sensitive and simpler instrument.
Selection of Optimum Transition
In the presence of a magnetic field, ro-vibrational transitions, of molecules that possess a permanent magnetic dipole moment, undergo Zeeman splitting. The magnetic field breaks the degeneracy of the molecular rotation states into 2J + 1 sublevels labeled by the quantum number M. For low rotational quantum number J levels of the ground electronic 2Π state of NO the angular momenta coupling is close to Hund's case (a). In case (a) the 2Π 1/2 subsystem is magnetically insensitive, and the 2Π 3/2 subsystem has magnetic dipole moment with g-factor of g = 3/[J(J + 1)] (11, 19, 20). For molecules placed in an axial magnetic field with light propagating along the axis, the ΔMJ = +1, ΔMJ = −1 components interact with RHCP light and LHCP light, respectively, whereas the ΔMJ = 0 absorption lines are polarized parallel to the magnetic field and will not be observed.
To analyze the net effect of the magnetic field on the given ro-vibrational transition, contribution of all allowed transition components shifted by ΔE = (g′jM′j − g″jM″j)·μBB0 must be summed. For Q-branch (ΔJ = 0) transitions, g′J′ = g″J″, and all ΔMJ = ±1 components exhibit the same magnetic sensitivity with opposite signs for ΔMJ = +1 and ΔMJ = −1. This provides the most efficient summation of all components and thus the optimum condition for Faraday modulation spectroscopy. The Q-branch line strength as well as g-factor decreases with increasing J value making the Q3/2(3/2) molecular transition at 1,875.81 cm−1 clearly the best choice for sensitive FRS detection of NO (11).
QCL-based FRS has been used to monitor NO concentrations previously (11, 12, 18), but the optimum Q3/2(3/2) molecular transition at 1,875.81 cm−1 could not be targeted. Tuning to this line was made possible for this work by employing a widely tunable EC-QCL as a spectroscopic source. The total EC-QCL frequency tuning range between 1,825 and 1,980 cm−1 allows most of the lines within the fundamental absorption band of NO at 5.2 μm to be targeted with a single laser source (see Fig. 1). Thus, isotopic studies of NO can be performed with a single instrument, because the EC-QCL based FRS spectrometer provides access to the optimum Q3/2(3/2) molecular transitions of all stable monosubstituted NO isotopomers with the most abundant ones being 14N16O (discussed above), 15N16O at 1,842.76 cm−1, and 14N18O at 1,827.13 cm−1. In this work, we focus on sensitive detection of NO targeting the major isotope at 1,875.81 cm−1.
Fig. 1.

Spectrum of absorption line strengths listed in the HITRAN database for 3 stable NO isotopes accessible within a tuning range of the EC-QCL.
FRS Experimental Setup
The experimental arrangement of the prototype FRS platform is schematically shown in Fig. 2. The optical set-up was built on a 60- × 90-cm optical breadboard mounted together with all the dedicated instrumentation on a wheeled cart (model POC001; Thorlabs) (see SI for details). This FRS system platform has been transported and operated at 3 different laboratory locations. A previously described (2) tunable EC-QCL with high-resolution mode-hop free wavelength tuning capability was used as the spectroscopic source. In this work, the laser was operated in a CW mode at −20 °C and provided a maximum output power of 2.9 mW at the wavelength coincident with the target NO line. Fine mode-hop free tuning of up to 2.5 cm−1 permitted high-resolution spectroscopy anywhere within the tuning range. This was exploited to perform active frequency locking, thus enabling long-term unattended operation of the FRS NO sensor. In Fig. 3, a HITRAN simulated direct absorption spectrum and a high-resolution FRS spectrum of the fundamental Q-branch for 10-ppmv NO in N2 mixture at reduced pressure are plotted to demonstrate high spectral resolution of the EC-QCL.
Fig. 2.

Schematic diagram of an EC-QCL-based FRS experimental setup. RP, Rochon polarizer; λ/4, quarter wave plate; PC, personal computer.
Fig. 3.

A HITRAN simulated direct absorption (Upper) and FRS (Lower) spectrum of the NO Q-branch recorded for 10-ppm NO in N2 mixture at 40 Torr with 44-cm active optical path length by using TE-cooled MCT detector and α = 7°. Modulation, 110 G at 950 Hz.
The collimated EC-QCL beam (4 mm in diameter) was split by a CaF2 wedge into 2 independent optical paths. In the main path, the laser beam propagated through a 50-cm-long optical gas cell located inside a 44-cm-long solenoid. The gas cell was placed between 2 nearly crossed MgF2 Rochon polarizers (extinction ratio for both polarizers is ξ < 10−5). When a longitudinal magnetic field was applied, the linearly polarized QCL beam experienced a Faraday rotation of the plane of polarization as a result of the interaction with paramagnetic NO molecules. The Faraday rotated light passing through a second polarizer was detected by either a midinfrared thermoelectrically cooled mercury–cadmium–telluride (MCT) photodetector or liquid nitrogen-cooled indium–antimonide (InSb) photodetector. The solenoid current was driven at fm = 950 Hz with a commercial audio amplifier. To minimize power requirements for driving the reactive load of the solenoid at ≈1 kHz, a series resonant circuit was constructed matching the modulation frequency fm. The modulated Faraday rotation resulted in ac amplitude modulation of the transmitted light intensity, which was detected by using a phase-sensitive lock-in detection at the frequency fm. The spectrum of detected FRS signal was recorded by a personal computer. Because signal should exist only when the NO molecules are present, FRS is considered a zero background technique. For small rotation angles, the detector signal is directly proportional to the NO concentration inside the cell. For calibration of the proportionality constant, 2 cylinders containing a mixture of 10 ppmv and 96 ppbv of NO in N2 were used. The system gas flow was set to ≈300 mL/min.
The second optical branch of the sensor was used as a reference channel for frequency control of the EC-QCL. The initial linear polarization of the laser radiation was transformed into circular polarization by passing it through a quarter wave plate (λ/4) (tunable quarter wave plate; Alphalas). The beam was directed through a 20-cm absorption gas cell filled with a mixture of 5% NO by volume in air at 25 Torr. The cell was placed inside a 10-cm-long solenoid, which was part of the series RLC circuit formed with the main solenoid. In the alternating axial magnetic field, the Zeeman modulation signal resulting from magnetic circular dichroism was observed by a thermoelectrically cooled MCT photodetector and demodulated by a second lock-in at the third harmonic of fm. The zero-crossing of the third harmonic signal was used to lock EC-QCL to the peak of the Q3/2(3/2) transition of NO.
Results and Discussion
Magnetic Field and Sample Pressure Optimization.
A series of experiments were performed to determine the optimum magnetic field strength, sample gas pressure, and the analyzer offset angle. The optimum modulation has been calculated (16) and corresponds to a maximum Zeeman shift from the zero-field line center equal to 1.35 times the half width at half maximum of a Doppler broadened absorption line. For several different gas pressures in the 0–200 Torr range, a series of NO spectral measurements for various solenoid current modulation amplitudes were carried out. The largest FRS signal amplitude was found experimentally at a pressure of 40 Torr for an ac solenoid current of 3.5 Arms corresponding to B = 110 Grms measured inside the main magnetic coil and 33 Grms measured inside the reference cell. This current of ≈64% of the maximum solenoid current the 5.5 Arms allowed stable long-term operation. According to simulations reported in ref. 12, these conditions are ≈90% of the maximum signal that can be obtained for this line with stronger magnetic fields and higher sample pressures.
Optimization of an Analyzer Angle.
A detailed theoretical analysis of the magnetic rotation signal and noise sources was described in refs. 1, 7, 16, and 21. A detailed discussion of these topics very pertinent to our particular case has been given in ref. 16. The power transmitted through the analyzer is given by P = P0[(1 − 2ξ)cos2(φ) + ξ] (7), where P0 is the intensity of light incident at the analyzer, ξ is the polarizer extinction ratio, and φ is an angle measured between polarization plane of the polarizer and the analyzer. For further discussion, we replace φ with α = π/2 − φ. Then with α ≪ 1 and ξ ≪ 1, the intensity is approximated by P = P0(sin2(α) + ξ).
The rotation of the polarization of incident light can be modulated within a small range of angles ΔΘ by using the Faraday effect. At any given analyzer angle α0, the FRS signal detected at the modulation frequency by using phase-sensitive detection can be expressed as S = |α0ΔΘ = ΔΘ·P0sin(2α). For small α, a condition valid here, and neglecting power saturation, the recorded signal becomes S = κΔΘ·P02α = aαP0 (where κ is the proportionality constant combining detector response and a = 2κΔΘ). It is clear that the maximum signal occurs when α is set at ±45°. The maximum SNR, however, depends on the noise sources.
There are 3 major noise contributions present in the FRS sensor system: (i) laser source noise, (ii) noise from the photodetector and its amplifiers, and (iii) angle-dependent fundamental QN (photodetector noise often is dominated by QN, but will be in any case angle independent). Source noise is an intrinsic feature of the laser used. Its noise spectrum is, in general, not white, having more noise at low frequencies. The level of this noise received by the photodetector scales proportionally with the intensity transmitted by the analyzer and can be expressed as Pd (d being the proportionality coefficient specific for the particular laser source in use). QN is proportional to .
For α where sin(α) ≈ α, the SNR can be expressed as
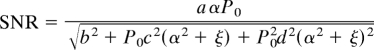 |
where b is detector noise equivalent power, c is the transmitted QN (where c is related to detector responsivity), and P0d(α2 + ξ) is the transmitted source noise. Setting the derivative of the SNR with respect to α equal to zero results in a quartic equation for the optimum α, which has 4 solutions. The real, positive solution to the quartic is
 |
The optimum α corresponds to the square root of the Euclidean sum of 3 terms. Each term is the ratio of the particular noise component at the detector, for a situation when the polarizers are crossed (α = 0), to the total laser noise incident on the analyzing polarizer (P0d). For small ξ or small laser power P0, the αopt is primarily determined by the ratio of the detector noise to the incident laser noise αopt = (b/P0d)1/2, and is independent of ξ, whereas at high power, it is determined by the polarizer quality αopt = (ξ)1/2 rather messy-looking expression for the SNR is obtained when the complete solution for optimum α is introduced. For small P0, the SNR rises as and is independent of ξ, SNR = a/. There was no evidence in the experiments reported here that QN was observed, but with this EC-QCL laser and our InSb detector, we believe QN is near the threshold of becoming significant. Further increases in P0, cause αopt to decrease until ξ becomes limiting. In the limit P0 → ∞, SNR = a/2d. Thus, at high power, the signal strength, polarizer, and the laser source noise are ultimately limiting, and QN is eliminated from SNR. See SI for a detailed discussion.
A series of measurements was taken for the same gas mixture (10 ppmv of NO in N2) at different analyzer angles to determine the optimum α0 for the best SNR value of the FRS system. The data were measured by using the MCT photodetector (with area of 1 mm2 and D* > 2·1010 cm/W at 5 μm). The system was operated in a spectral scan mode, and for each α the signal amplitude at the center of the NO line as well as a standard deviation of the data points away from the absorption center representing total system noise were measured and analyzed. The FRS signal amplitude as a function of α is shown in the Fig. 4A. These data were fitted by a f1(α) = A·sin(2α) function (A = P0a). For the laser power used, QN remains small compared with detector or laser noise. Therefore, the QN contribution can be omitted in the fit function. The total noise vs. α was fitted by f2(α) = (B = b, D = P0d), which is shown in Fig. 4B. In Fig. 4C, the SNR is calculated for the measurements (dots) and fitted lines (solid line). The best SNR for a lock-in time constant of TC = 1 s occurs at α of ≈7°. However, for better long-term stability of the system, it is preferable to work with smaller α (see Long-Term Measurements for more detailed discussion). For an experimental demonstration of the effect of improved photodetector performance on the system SNR, we have performed measurements using the InSb photodetector (with 1-mm diameter, and D* > 1·1011 cm/W at 5 μm). For this case, the optimum α was found to be 2–3° from its crossed position (the SNR maximum is rather insensitive to angle).
Fig. 4.

An FRS signal amplitude (A) and noise (B) fitted by estimated model functions derived for the FRS technique, with the SNR versus α calculated by using the measured values and the fitting curves from A and B shown in C.
The high-resolution magnetic rotation spectra of NO acquired with 2 different photodetectors for a certified reference gas mixture of 96 ppbv of NO in N2 are depicted in Fig. 5. The total pressure was 40 Torr, the solenoid length was 44 cm, and the temperature was 22 °C. Under these conditions, the fractional absorption at the Q3/2(3/2) line peak is calculated by using the HITRAN line strength and pressure broadening coefficient to be 1.5 × 10⁻⁵ and Θmax = 4 × 10⁻⁶. Both spectra were recorded for the same gas sample conditions and show only the 2 strongest Q3/2(3/2) and Q3/2(5/2) molecular transitions at 1,875.81 cm−1 and 1,875.72 cm−1, respectively. For the MCT (Fig. 5A) 1σ MDL of 4.3 ppbv was obtained for NO concentrations TC = 1 s, and α = 7°. Almost identical MDL (1σ) value of 5.4 ppbv was obtained for a 10-ppmv NO mixture in N2. This demonstrates an excellent dynamic range of the method with a uniform performance for concentrations covering several orders of magnitude. A significantly improved detection limit was obtained with the LN2 cooled InSb photodetector, resulting in a 1σ MDL of 380 pptv for the same TC = 1 s, and α = 3° (Fig. 5B). An equivalent minimum detectable fractional absorption of 6.7 × 10⁻⁷ for the MCT detector and 5.9 × 10⁻⁸ for the InSb detector with TC = 1 s is lower for significantly shorter optical paths than in current state-of-the-art direct absorption systems (22).
Fig. 5.

Faraday rotation spectrum of Q3/2(3/2) and Q3/2(5/2) transitions of NO measured for 96 ppbv in N2 mixture at 40 Torr with a thermoelectrically cooled MCT photodetector (A) and with a liquid nitrogen-cooled InSb photodetector (B). Both spectra were measured at the same measurement conditions except α = 7° in A, and α = 3° in B. TC = 1 s; modulation, 110 G at 950 Hz.
For either detector, the SNR could be improved with more laser power. The SNR is proportional to in this regime where the polarizers are not limiting. As laser power is increased, the optimum α decreases to keep the total power reaching the detector constant. Ultimately, light leakage through the polarizers will become significant, and SNR will no longer rise as . Such light leakage is intrinsic to the polarizers (ξ = 10−5), but also arises from the cell windows spoiling polarization. Taking both effects into account by an ξeff, this flattening of SNR power dependence is expected to take place at αopt ≈ . If ξeff can actually be made 10−5 and power saturation is negligible, a QCL laser with P ≤ 0.5 W could improve the SNR for the InSb detector by approximately a factor of 7 and for the MCT by a factor of >20.
Long-Term Measurements.
The scan results of Fig. 5 demonstrate the excellent sensitivities that can be achieved with a relatively small time constant. However, scanning introduces the complication of fairly elaborate data analysis. For purposes such as atmospheric monitoring, it appears simpler to lock the laser frequency to the peak of the FRS signal and merely track the signal magnitude as a function of time. We have explored this option, and the results are discussed below.
A precise wavelength control of the EC-QCL was implemented to prevent detuning of the laser from the resonance with the NO Q3/2(3/2) transition. A computer-based active feedback loop provides simultaneous control of the 3 independent laser parameters: the EC length, the diffraction grating angle, and QCL injection current. The demonstrated active wavelength locking of broadly tunable EC-QCLs provides solid ground for construction of versatile sensing systems that can simultaneously target multiple analytes in different significantly separated spectral regions.
Preliminary tests used this approach for NO concentrations with a sampling port located outside the building. The atmospheric air was measured alternately with certified mixture of 96 ppbv NO in N2 and pure N2 used for calibration purposes. If there were no offset from the baseline (caused, we believe, by pickup of the modulation into the laser) with pure N2, only 1-time calibration with a known sample would be required for fixed laser power, modulation current, analyzer angle, and detector, because the signal proportionality constant depends only on these quantities. The data collected with the room-temperature MCT detector (α = 7°) are shown in Fig. 6. The data points were acquired every 3 s with TC = 1 sec. During measurements of the outside air, a number of sharp peaks of NO concentration, primarily related to automobile activity, are clearly visible. These outdoor air measurements demonstrate the FRS system capability for continuous unattended operation. However, the apparent sensitivity is obviously much poorer than those obtained with the scans of Fig. 5A. A 1σ MDL of 7 ppbv for the MCT detector was estimated by calculating signal amplitude and standard deviation by using the NO and N2 time series. The MDL observed in the absorption line-locked mode is ≈2 times higher than MDL determined from the spectral measurements in Fig. 5 (all measurement parameters were identical). A similar trend was observed with InSb detector. We believe that the MDL increase is related to the limited precision of a relatively slow computer-based active feedback control of the laser wavelength. The more vexing issue is that there is always a clear offset from zero signal and this baseline tends to drift with time, as can be seen clearly in the time intervals where pure N2 was flowing. The offset could be caused by electronic pick-up of the 950-Hz modulation current either into the detection system or the laser driver system or both. This is the real sensitivity limitation in long-term monitoring, because other factors that can influence the FRS signal, including laser power or magnetic field amplitude, can be reliably controlled and/or monitored.
Fig. 6.

Long-term NO concentration measurements performed with active laser frequency locking to the NO absorption line at 1,875.81 cm−1 with MCT photodetector. Reference [NO] = 96 ppbv. TC = 1 se; acquisition every 3 s.
The sensor stability was studied to explore the origin of background fluctuations and to optimize sensor operating parameters for improved long-term system performance and the best detection limit. As described in the previous section, the level of detector thermal noise has a major impact on the FRS system SNR, but because of its random nature, it has only a minor effect on a long-term system performance. Previously the lower detectivity of thermoelectrically cooled MCT detectors was compensated by setting the α further from its crossed position to increase signal. At the same time a larger fraction of laser noise, which is not white noise, will be incident on the detector. If the laser is modulated at 950 Hz, long-term variations in the laser intensity will appear in the signal. Thus, the FRS system baseline will be subject to fluctuations and instabilities of the laser source. To study this effect, a series of long time measurements were performed for different α, and the Allan variance was calculated for each time series (23). These Allan plots calculated for time series recorded for 100-ppbv NO in N2 with α of 4, 6, 8, and 10° are shown in the Fig. 7. With increasing α, a slow drift characteristic for time windows >100 s becomes dominant. These results can make sense if the laser is being amplitude modulated at 950 Hz. Laser power drift is probably too small to give this large a fractional baseline shift. Previous experience with pickup suggests that it is likely that the magnitude of the 950 Hz modulation of laser and/or possibly detector is varying with time.
Fig. 7.

Allan plots obtained for different α values. Larger αs raise power at the detector, resulting in increased laser source drift and poorer long-term signal stability.
We conclude that despite the improved SNR for short measurement times, larger α with its higher laser power on the detector causes a significant contribution of the laser noise/drift, which strongly affects long-term system stability and detector performance. It is necessary to reduce α at the cost of short-term SNR to provide optimum long-term stability while preserving sufficient minimum detection limit required for the particular application.
An analyzer offset angle of 4° was used to effectively suppress slow system drift and to achieve extended long-term stability. By using a MCT detector a time series for a zero-gas (N2) FRS signal preceded and followed by a 100-ppbv NO mixture was recorded over ≈9 h (see Fig. 8Lower). The data were collected with TC = 1 s, and Fig. 8 Lower shows data points acquired every 3 s The Allan variance calculated for these data are shown together with an ideal white noise-limited system response in Fig. 8 Upper. The system now shows good stability that allows for averaging times of up to ≈4,000 s. The SNR is reduced by a factor of ≈2 with respect to the optimum angle of 7°. However, this reduction in SNR is only observed at time scales <100 s. The 4° angle improves SNR for >100-s averaging times. Such a tradeoff can be made for applications in which long-term stability is critical and short-term response and sensitivity is less important.
Fig. 8.

A FRS detection time series (Lower) and corresponding Allan variance plot (Upper) demonstrating long-term stability of the EC-QCL-based FRS trace gas sensor system with α set at 4°. A dotted line shows response of an ideal random noise-limited system.
We can think of 2 ways to overcome the drift problem and restore optimum performance. The most straightforward, but rather difficult, method is to track down and eliminate ground loops and electromagnetic pickup, which cause the modulation of the laser by the magnet current. Increased suppression of those effects together with occasional calibration with zero gas and a calibrated NO mixture should provide reasonable long-term stability of the system. We believe the most robust method for achieving long-term stability is to return to scanning over the line. A series of short scans would be acquired and averaged. The NO concentration would be obtained by least-squares fitting the amplitude parameter of the known line shape (Fig. 5) to the observed traces. With this approach, the instrument should have zero offset and should require only very infrequent calibration.
Conclusions
The laser-based FRS instrumentation described in this work offers an effective method for the detection of NO with excellent sensitivity and selectivity. This technology can be extended to other atomic and molecular species with an open shell configuration such as nitrogen dioxide or hydroxyl radicals. The use of a broadly tunable EC-QCL allows the selection of the optimum line for the FRS detection of NO and provides flexibility in selecting the required laser wavelength to perform sensitive detection of other paramagnetic species within the laser tuning range (e.g., other NO isotopes). The mode hop-free frequency tuning with a frequency-locking algorithm available with our EC-QCL technology in conjunction with cryogen-free detectors allowed for the long-term unattended NO monitoring capability.
The sensitivity obtained with this polarization technique achieves parts-per-billion detection levels by using only 44-cm effective optical path length. This is comparable with other sensitive spectroscopic techniques that have been used in the midinfrared region requiring significantly longer optical path lengths (22, 24). This property lends itself to the reduction of sample volume to dimensions restricted only by the laser beam diameter and the detection chamber length. With careful engineering of the current prototype the physical dimensions of the sample chamber can be reduced to ≈25 mL (with cell diameter of 8 mm), which at pressure of 40 Torr, corresponds to only ≈1.3 mL of gas sample collected at atmospheric pressure. If the reduction of the sample volume is not critical, the FRS technique allows for further enhancement of the sensitivity by means of a multipass configuration (13, 25).
The development of high-power QCLs is progressing rapidly. QC lasers with an internal grating producing nearly 1 W of CW power are already technically feasible. A FRS sensor based on such a laser would be simpler, more compact, and more sensitive.
Supplementary Material
Acknowledgments.
This work was supported by the National Science Foundation through a subaward from Princeton University (Mid-InfraRed Technologies for Health and the Environment Engineering Research Center), the Department of Energy through a subaward from Aerodyne Research Inc., and the Robert Welch Foundation.
Footnotes
The authors declare no conflict of interest.
This article contains supporting information online at www.pnas.org/cgi/content/full/0906291106/DCSupplemental.
References
- 1.Litfin G, Pollock C, Curl R, Tittel F. Sensitivity enhancement of laser absorption spectroscopy by magnetic rotation effect. J Chem Phys. 1980;72:6602–6605. [Google Scholar]
- 2.Wysocki G, et al. Widely tunable mode-hop free external cavity quantum cascade lasers for high resolution spectroscopy and chemical sensing. Appl Phys B. 2008;92:305–311. [Google Scholar]
- 3.Wittmann A, Hugi A, Gini E, Hoyler N, Faist J. Heterogeneous high performance quantum cascade laser sources for broadband tuning. IEEE J Quantum Electron. 2008;44:1083–1088. [Google Scholar]
- 4.Seinfeld J, Pandis S. Atmospheric Chemistry and Physics: From Air Pollution to Climate Change. New York: Wiley; 1998. pp. 1033–1044. [Google Scholar]
- 5.Piver W. Global atmospheric changes. Environ Health Persp. 1991;96:131–137. doi: 10.1289/ehp.9196131. [DOI] [PMC free article] [PubMed] [Google Scholar]
- 6.Ignarro L. Nitric Oxide: Biology and Pathobiology. San Diego: Academic; 2000. [Google Scholar]
- 7.Adams H, Reinert D, Kalkert P, Urban W. A differential detection scheme for Faraday rotation spectroscopy with a color center laser. Appl Phys B. 1984;34:179–185. [Google Scholar]
- 8.Smith J, Bloch J, Field R, Steinfeld J. Trace detection of NO2 by frequency-modulation-enhanced magnetic rotation spectroscopy. J Opt Soc Am B. 1995;12:964–969. [Google Scholar]
- 9.Hinz A, Pfeiffer J, Bohle W, Urban W. Mid-infrared laser magnetic resonance using the Faraday and Voigt effects for sensitive detection. Mol Phys. 1982;45:1131–1139. [Google Scholar]
- 10.Koch M, Luo X, Mürtz P, Urban W, Mörike K. Detection of small traces of 15N2 and 14N2 by Faraday LMR spectroscopy of the corresponding isotopomers of nitric oxide. Appl Phys B. 1997;64:683–688. [Google Scholar]
- 11.Ganser H, Urban W, Brown J. The sensitive detection of NO by Faraday modulation spectroscopy with a quantum cascade laser. Mol Phys. 2003;101:545–550. [Google Scholar]
- 12.Fritsch T, et al. Magnetic Faraday modulation spectroscopy of the 1–0 band of 14NO and 15NO. Appl Phys B. 2008;93:713–723. [Google Scholar]
- 13.Dillenschneider W, Curl R. Color center laser spectroscopy of ν1 + ν2 + ν3 of NO2 using magnetic rotation. J Mol Spectrosc. 1983;99:87–97. [Google Scholar]
- 14.Brecha R, Pedrotti L, Krause D. Magnetic rotation spectroscopy of molecular oxygen with a diode laser. J Opt Soc Am B. 1997;14:1921–1930. [Google Scholar]
- 15.Pfeiffer J, Kirsten D, Kalkert P, Urban W. Sensitive magnetic rotation spectroscopy of the OH free radical fundamental band with a colour centre laser. Appl Phys B. 1981;26:173–177. [Google Scholar]
- 16.Blake T, Chackerian C, Podolske J. Prognosis for a mid-infrared magnetic rotation spectrometer for the in situ detection of atmospheric free radicals. Appl Opt. 1996;35:973–984. doi: 10.1364/AO.35.000973. [DOI] [PubMed] [Google Scholar]
- 17.Mürtz P, et al. LMR spectroscopy: A new sensitive method for on-line recording of nitric oxide in breath. J Appl Physiol. 1999;86:1075–1080. doi: 10.1152/jappl.1999.86.3.1075. [DOI] [PubMed] [Google Scholar]
- 18.Ganser H, Horstjann M, Suschek C, Hering P, Mürtz M. Online monitoring of biogenic nitric oxide with a QC laser based Faraday modulation technique. Appl Phys B. 2004;8:513–517. [Google Scholar]
- 19.Herrmann W, Rohrbeck W, Urban W. Line shape analysis for Zeeman modulation spectroscopy. Appl Phys A. 1980;22:71–75. [Google Scholar]
- 20.Herzberg G, Spinks J. Molecular Spectra and Molecular Structure: Diatomic Molecules. 2nd Ed. Princeton: Van Nostrand; 1950. [Google Scholar]
- 21.Brecha R, Pedrotti L. Analysis of imperfect polarizer effects in magnetic rotation spectroscopy. Opt Expr. 1999;5:101–113. doi: 10.1364/oe.5.000101. [DOI] [PubMed] [Google Scholar]
- 22.McManus, et al. Comparison of cw and pulsed operation with a TE-cooled quantum cascade infrared laser for detection of nitric oxide at 1900 cm−1. Appl Phys B. 2006;85:235–241. [Google Scholar]
- 23.Land D, Levick A, Hand J. The use of the Allan deviation for the measurement of the noise and drift performance of microwave radiometers. Meas Sci Tech. 2007;18:1917–1928. [Google Scholar]
- 24.Moeskops B, Cristescu S, Harren F. Sub-part-per-billion monitoring of nitric oxide by use of wavelength modulation spectroscopy in combination with a thermoelectrically cooled, continuous-wave quantum cascade laser. Opt Lett. 2006;31:823–826. doi: 10.1364/ol.31.000823. [DOI] [PubMed] [Google Scholar]
- 25.Hinz A, Zeitz D, Bohle W, Urban W. A Faraday laser magnetic resonance spectrometer for spectroscopy of molecular radical ions. Appl Phys B. 1985;36:1–4. [Google Scholar]
Associated Data
This section collects any data citations, data availability statements, or supplementary materials included in this article.