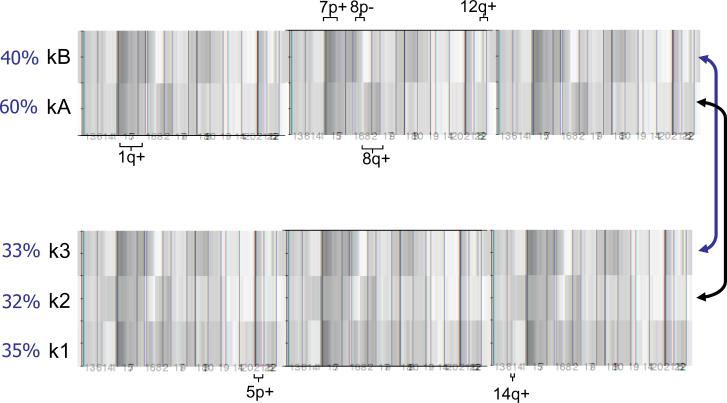
Figure 2.
Unsupervised clustering of genomic copy number data in 199 lung adenocarcinomas. The NMF method was used to generate K=2 and K=3 clustering, both of which showed stable cluster assignments whereas clustering into more than 3 groups did not yield stable clusters (Supplementary Figure 1). Red is gain and green is loss with the color intensity indicating the level of copy number change; white is no change. Selected notable gains and losses defining individual clusters are indicated. Approximate proportions made up by each cluster are shown as percentages. The two-cluster classification shows that the kA subgroup (n=118) is notable for 1q and 8q gains. The kB subgroup (n=81) is characterized by gains of 7p and 12q, and losses at 8p and 10q. In the three-cluster classification, the k2 cluster (n=64) was similar to the kA cluster (arrow), being defined by gains of 1q and 8q. The k3 cluster (n=65) was similar to the kB cluster (arrow), showing gains of 7p and 12q. The additional cluster k1 (n=70) was marked by gains at 5p and 14q.

