The expansion of health insurance coverage in the United States is likely to be on the front burner of health care reform efforts in the new presidential administration. But boiling on the back burner is perhaps the most serious threat to Americans’ access to care: rapid growth in health care costs.
Pessimism abounds. Most observers see rising costs as an inexorable force, blame advancing technology, and conclude that only by rationing beneficial care or making draconian price cuts can we slow the growth of health care costs.
But a careful look at variations in spending growth and spending patterns among U.S. regions reveals a more optimistic picture. By learning from regions that have attained sustainable growth rates and building on successful models of delivery-system and payment-system reform, we might, with adequate physician leadership, manage to “bend the cost curve.”
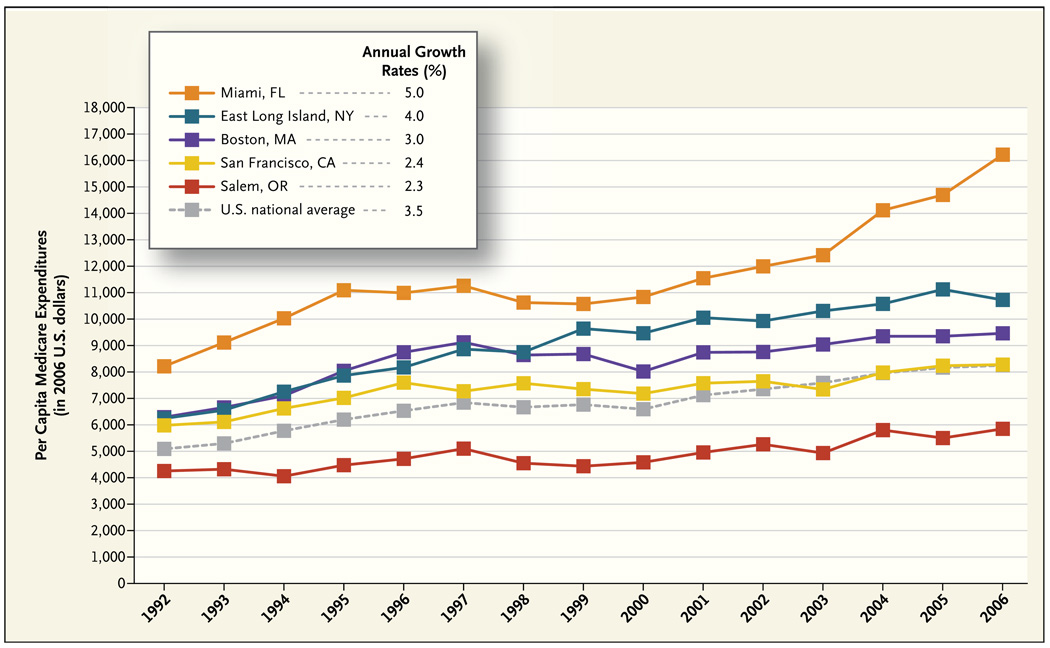
The graph shows per capita Medicare spending from 1992 through 2006 in five U.S. hospital-referral regions. During this period, overall Medicare spending, adjusted for general price inflation, rose by 3.5% annually. But there was considerable variation among regions. Per capita inflation-adjusted spending in Miami grew at an annual rate of 5.0%, as compared with just 2.3% in Salem, Oregon, and 2.4% in San Francisco. In dollar terms, the growth in per capita Medicare expenditures between 1992 and 2006 in Miami ($8,085) was nearly equal to the level of 2006 expenditures in San Francisco ($8,331). A total of 26 hospital-referral regions (including Dallas) had more rapid spending growth than Miami, and 18 regions (including San Diego) had slower growth than Salem.
Three of the regions included in the graph — Boston, San Francisco, and East Long Island, New York — started out with nearly identical per capita spending, but their expenditures grew at markedly different annual rates: 2.4% in San Francisco, 3.0% in Boston, and 4.0% in East Long Island. Although such differences may appear modest, compounding leads to enormous differences in spending levels over time. By 2006, per capita spending in East Long Island was $2,500 more than in San Francisco — which translates into about $1 billion in additional annual Medicare spending from this region alone.
What’s going on? It is highly unlikely that these differences in growth could be explained by differences in health. Marked regional differences in spending remain after careful adjustment for health, and there is no evidence that health is decaying more rapidly in Miami than in Salem.
The variations allow us to rule out two overly simplistic explanations for spending growth. First, “technology” is clearly an insufficient explanation: residents of all U.S. regions have access to the same technology, and it is implausible that physicians in the regions with slower spending growth are consciously denying their patients needed care. Indeed, evidence suggests that the quality of care and health outcomes are better in lower-spending regions and that there have been no greater gains in survival in regions with greater spending growth.1 Second, it is difficult to blame regional differences entirely on the current payment system, since all our evidence on regional growth comes from populations in the fee-for-service system. Other research has emphasized the role of managed care in moderating the growth of costs,2 but this story cannot explain the rapid growth in Miami, where roughly half of Medicare enrollees are covered by Medicare Advantage plans.
The causes must therefore lie in how physicians and others respond to the availability of technology, capital, and other resources in the context of the fee-for-service payment system. A recent study by researchers in our group provides further insight.3 Using clinical vignettes to present standardized patient care scenarios to physicians throughout the country, the researchers found that physicians in high- and low-spending regions were about equally likely to recommend specific clinical interventions when the supporting evidence was strong. Those in higher-spending regions, however, were much more likely than those in lower-spending regions to recommend discretionary services, such as referral to a subspecialist for typical gastroesophageal reflux or stable angina or, in another vignette, hospital admission for an 85-year-old patient with an exacerbation of end-stage congestive heart failure. And they were three times as likely to admit the latter patient directly to an intensive care unit and 30% less likely to discuss palliative care with the patient and family. Differences in the propensity to intervene in such gray areas of decision making were highly correlated with regional differences in per capita spending.
What do these findings suggest in terms of approaches to reducing health care costs? First, physicians have an opportunity to lead. Physicians are still almost entirely responsible for determining what treatments their patients receive and where they obtain their care. And although the increasingly commercial behavior of some physicians may threaten the public perception of the profession, patients still largely trust their own doctors. Leadership is needed at three levels. In their practices, physicians can help patients understand when a more conservative path is likely to be as safe as a more intensive and higher-cost path. In their communities, physicians have the credibility to argue against the need for further growth — whether through hospital expansion, the construction of new imaging centers, or the recruitment of more specialists to oversupplied regions (www.dartmouthatlas.org provides spending, hospital, and workforce data for each U.S. hospital-referral region). And physicians can support changes in the health care system that will help their patients and communities get the best possible care at the lowest possible cost.
But physicians will need help from payers and policymakers. Under the current payment system, physicians cannot afford the time it takes to help patients understand why a test or procedure is not needed. Hospitals lose money when they improve care in ways that reduce admissions, and they lose market share when they don’t keep pace in the local medical arms race. In this race there are no financial rewards for collaboration, coordination, or conservative practice.
To slow spending growth, we need policies that encourage high-growth (or high-cost) regions to behave more like low-growth, low-cost regions — and that encourage low-cost, slow-growth regions to sustain their current trends. Our ongoing research program (funded in part by the National Institute on Aging) suggests that there are two broad and closely linked strategies for accomplishing these aims: fostering the growth of more organized systems of care and implementing fundamental payment reform. Consensus is emerging that integrated delivery systems that provide strong support to clinicians and team-based care management for patients offer great promise for improving quality and lowering costs. Most physicians already practice within local referral networks around one or more hospitals, which could form local integrated delivery systems with little disruption of practice.4 Policymakers would need to remove legal barriers to collaboration and offer incentives — such as larger payment updates or subsidies for implementing electronic health records — to providers who were willing to establish real or virtual accountable care systems.5 Our volume-based payment systems could then be changed to incorporate partial capitation, bundled payments, or shared savings, thereby fostering accountability for overall costs and quality of care. Although much remains to be learned about aligning reforms in delivery systems with payment reforms, early results from demonstration projects have been promising and could provide the foundation for national reform.
The good news is that small changes in annual per capita growth rates have enormous implications for the long-term solvency of Medicare and the sustainability of expanded insurance coverage. Using data from the 2008 Medicare trustees’ report on projected revenues and total Part A and B spending, we estimate that Medicare will be $660 billion in the hole by 2023. Reducing annual growth in per capita spending from 3.5% (the national average) to 2.4% (the rate in San Francisco) would leave Medicare with a healthy estimated balance of $758 billion, a cumulative savings of $1.42 trillion.
Such a change would not solve the country’s long-term fiscal challenges. But it suggests that if we focus reform efforts on current areas of overspending — overuse of hospitals and unnecessary visits, consultations, tests, and minor procedures — we may be able to bend the cost curve while continuing to enjoy the benefits of technological advances.
Annual Growth Rates of per Capita Medicare Spending in Five U.S. Hospital-Referral Regions, 1992–2006.
Data are in 2006 dollars and were adjusted with the use of the gross domestic product implicit price deflator (from the Economic Report of the President, 2008) and for age, sex, and race. Data are from the Dartmouth Atlas Project.
Total Reimbursement Rates for Noncapitated Medicare per Enrollee, 2006, and Annual Growth in Medicare Reimbursements, 1992–2006, for the 25 Largest U.S. Hospital-Referral Regions.
Data are from the Dartmouth Atlas Project.
Footnotes
An interactive graphic showing Medicare reimbursements by region is available at NEJM.org
No potential conflict of interest relevant to this article was reported.
References
- 1.Skinner JS, Staiger DO, Fisher ES. Is technological change in medicine always worth it? The case of acute myocardial infarction. Health Aff (Millwood) 2006;25:w34–w47. doi: 10.1377/hlthaff.25.w34. [DOI] [PMC free article] [PubMed] [Google Scholar]
- 2.Chernew ME, Hirth RA, Sonnad SS, Ermann R, Fendrick AM. Managed care, medical technology, and health care cost growth: a review of the evidence. Med Care Res Rev. 1998;55:259–288. doi: 10.1177/107755879805500301. [DOI] [PubMed] [Google Scholar]
- 3.Sirovich B, Gallagher PM, Wennberg DE, Fisher ES. Discretionary decision making by primary care physicians and the cost of U.S. health care. Health Aff (Millwood) 2008;27:813–823. doi: 10.1377/hlthaff.27.3.813. [DOI] [PMC free article] [PubMed] [Google Scholar]
- 4.Bynum JP, Bernal-Delgado E, Gottlieb D, Fisher E. Assigning ambulatory patients and their physicians to hospitals: a method for obtaining population-based provider performance measurements. Health Serv Res. 2007;42:45–62. doi: 10.1111/j.1475-6773.2006.00633.x. [DOI] [PMC free article] [PubMed] [Google Scholar]
- 5.Shortell SM, Casalino LP. Health care reform requires accountable care systems. JAMA. 2008;300:95–97. doi: 10.1001/jama.300.1.95. [DOI] [PubMed] [Google Scholar]


