

Abstract
As the application for quantitative proteomics in the life sciences has grown in recent years, so has the need for more robust and generally applicable methods for quality control and calibration. The reliability of quantitative proteomics is tightly linked to the reproducibility and stability of the analytical platforms, which are typically multicomponent (e.g. sample preparation, multistep separations, and mass spectrometry) with individual components contributing unequally to the overall system reproducibility. Variations in quantitative accuracy are thus inevitable, and quality control and calibration become essential for the assessment of the quality of the analyses themselves. Toward this end, the use of internal standards cannot only assist in the detection and removal of outlier data acquired by an irreproducible system (quality control) but can also be used for detection of changes in instruments for their subsequent performance and calibration. Here we introduce a set of halogenated peptides as internal standards. The peptides are custom designed to have properties suitable for various quality control assessments, data calibration, and normalization processes. The unique isotope distribution of halogenated peptides makes their mass spectral detection easy and unambiguous when spiked into complex peptide mixtures. In addition, they were designed to elute sequentially over an entire aqueous to organic LC gradient and to have m/z values within the commonly scanned mass range (300–1800 Da). In a series of experiments in which these peptides were spiked into an enriched N-glycosite peptide fraction (i.e. from formerly N-glycosylated intact proteins in their deglycosylated form) isolated from human plasma, we show the utility and performance of these halogenated peptides for sample preparation and LC injection quality control as well as for retention time and mass calibration. Further use of the peptides for signal intensity normalization and retention time synchronization for selected reaction monitoring experiments is also demonstrated.
As proteomics and systems biology converge, the need for the generation of high quality, large scale quantitative proteomics data sets has grown, and so-called label-free quantification has emerged as a very useful platform for their generation (1). Label-free quantitative experiments are usually designed to detect differentially abundant features in biologically relevant samples by comparing mass versus retention time feature maps generated by LC-MS. Although label-free proteomics experiments are time- and cost-effective, they require high levels of reproducibility at every step of the process (2). Too much variation resulting from sample preparation, LC performance (e.g. injection, gradient delivery, and flow rate), and MS performance (e.g. ionization efficiency, mass accuracy, and detector performance) could lead to an increase in the false discovery rate of detected peptides. Thus it is crucial to minimize such variation to adequately control the quality of the data. In addition, label-free experiments are often followed by directed MS/MS analyses in which selected peptides are specifically targeted for identification, a procedure that also requires high system reproducibility (3, 4). The total variation in the acquired data is the result of accumulating variation at each step. This variation, regardless of its source, be it from sample handling, injection irreproducibility, change in analyte volume, matrix and co-eluter interference (both suppression and enhancement), system instability, or finally variations in the ion source performance, can be accounted for if an appropriate internal standard (ISTD)1 system is used.
A more recent development in the field of quantitative proteomics is multireaction monitoring (MRM) also referred to as selected reaction monitoring (SRM). This MS-based technology is aimed at fast, sensitive, and reproducible screening of large sets of known targets and is ideal for building biological assays in which the presence and quantity of specific analytes is being determined in multiple samples. Certain inputs, such as transitional values (m/z values for the precursor ion and its fragment ions), collision energies, and chromatographic retention time are required to build a validated S/MRM assay. These values are either extracted from MS/MS data acquired from biological samples with the same type of instrument used for the S/MRM analyses or from a set of peptide standards (5). To maximize the number of S/MRM measurements in one LC-MS/MS run, the use of elution time constraints has proven to be highly beneficial (6). ISTDs could therefore play an integral role in building S/MRM assays if used to synchronize input values such as retention times between instruments or to monitor the retention time consistency in sequences of scheduled S/MRM experiments.
ISTDs are usually designed to best fit the analytical system for which they are being used. Because the currency of quantitative proteomics is ionized peptide ions, peptides thus represent the best candidates for ISTDs for proteomics measurements. The use of peptides as ISTDs for proteomics applications, however, is not new. Both natural peptides and heavy isotope-labeled peptides (either chemically synthesized or produced by tryptic digestion of biologically expressed quantification concatamers (QconCATs)) have been used as internal standards by spiking (7, 8). Peptides from the biological analyte have also been used as pseudo-internal standards for normalization (9). But a limitation with all these methods that use native and heavy isotope-labeled peptides as ISTDs is signal detection. The MS-based signal detection for this type of peptide can be challenging when trying to confidently detect their signal in ion chromatograms acquired by mass spectral analysis of biological fluids or other samples of similar complexity where densely packed features cover the entire mass and time range (10). In addition, there is always a chance that a peptide with the same elemental composition as the internal standard might exist in the analyte and thus completely throw off the calibration curve (11). The same argument is valid for heavy isotope-labeled peptides because in many quantitative applications the analytical matrix is made of heavy isotope-labeled peptides (12–14). Obviously utilization of ISTDs in complex mixtures requires highly confident detection of corresponding signals, and for natural and heavy isotope-labeled peptides MS/MS analysis is the only way to accomplish that. But CID attempts on mass spectral features do not necessarily result in identification. First the MS features from ISTDs have to be picked for CID, and then the fragmentation should result in high quality MS/MS spectra that could be matched to the ISTD sequence with high confidence. This process is not always successful and consequently can result in an incomplete set of ISTD signals. The other limitation of MS/MS-based ISTDs is processing time. All MS/MS data have to be searched and curated before ISTD signals can be used.
On the other hand, if ISTD signals could be easily detected at the MS level, then all the aforementioned limitations are lifted. For such a peptide to be an MS-based ISTD, it should really have unusual properties that make it easily detectable in a background of biological peptides.
In this study we introduce the use of a set of halogenated peptides as internal standards (H-PINS) with unique isotopic distributions and mass defect that are easily detectable at the MS level by manual search and automated peak picking algorithms. The pattern of the isotopic distribution and mass defect are essential for detection of H-PINS at the MS level. Hence these peptides are best suited for high resolution and mass accuracy instruments. These peptides are similar to ordinary peptides in any other respect and can be treated similarly during purification and LC-MS analysis. We go on to illustrate their use for quality control (QC) at various steps of a proteomics experiment including sample preparation, LC-MS, and mass calibration and retention time synchronization between various analytical platforms.
EXPERIMENTAL PROCEDURES
Materials
H-PINS (see Table I for a complete list) were custom synthesized by Bachem (Torrance, CA). Male human plasma was purchased from Bioreclamation Inc. (Hicksville, NY). TFA, trifluoroethanol, sodium periodate, tris(2-carboxyethyl)phosphine, and iodoacetamide were purchased from Pierce. HPLC grade ACN and HPLC grade water with 0.1% formic acid were purchased from Mallinckrodt Chemical Works. Affi-Prep hydrazide resin was purchased from Bio-Rad. Protein N-glycosidase F was purchased from Roche Diagnostics. PepMap 100 reversed-phase C18 columns (0.075 × 150 mm) were purchased from Dionex, Inc. (Sunnyvale, CA). Mass spectrometry grade trypsin Gold was purchased from Promega (Madison, WI). Mass spectra were acquired using an Agilent 1100/LTQ-Orbitrap mass spectrometer (Thermo-Finnigan, San Jose, CA) and Tempo 2D NanoLC-4000QTrap (Applied Biosystems).
Table I. List of H-PINS 1–10, including sequence, molecular formula (MF), molecular weight, optimized concentration, and m/z value for singly, doubly, and triply charged ions.
| No. | Sequence | MF | Molecular weight | Conc. | m/z | Value |
|---|---|---|---|---|---|---|
| fm/μl | ||||||
| 1 | H-d-Phe(4-Br)-Lys(Me)3-Arg-Tyr-Gly-OH | C35H52N9O7Br | 789.3173 | 85 | 1+ | 790.3252 |
| 2+ | 395.6666 | |||||
| 3+ | 264.4496 | |||||
| 2 | H-d-Phe(4-Br)-Lys(Me)3-Gly-Arg-Tyr-Tyr-OH | C44H61N10O9Br | 952.3806 | 64 | 1+ | 953.3885 |
| 2+ | 477.1982 | |||||
| 3+ | 318.8040 | |||||
| 3 | H-d-Phe(4-Br)-Lys(Me)3-Arg-Tyr-Gly-Tyr-Val-OH | C49H70N11O10Br | 1051.449 | 44 | 1+ | 1052.4570 |
| 2+ | 526.7324 | |||||
| 3+ | 351.8268 | |||||
| 4 | H-d-Phe(4-Br)-Lys(Me)3-Gly-Arg-Tyr-Tyr-Val-Tyr-OH | C58H79N12O12Br | 1214.512 | 42 | 1+ | 1215.52 |
| 2+ | 608.2641 | |||||
| 3+ | 406.1813 | |||||
| 5 | H-His-Phe(4-Cl)-Phe(4-Cl)-Phe(4-Cl)-Ala-Ala-OH | C51H67N12O8Cl3 | 1080.427 | 36 | 1+ | 1081.4350 |
| 2+ | 541.2214 | |||||
| 3+ | 361.4862 | |||||
| 6 | H-Phe(4-Cl)-Phe(4-Cl)-Phe(4-Cl)-Lys-NH2 | C33H39N6O4Cl3 | 688.2098 | 35 | 1+ | 689.2177 |
| 2+ | 345.1128 | |||||
| 3+ | 230.7471 | |||||
| 7 | H-Ala-Phe(4-Cl)-Phe(4-Cl)-Phe(4-Cl)-Ala-Ala-Ala-Lys-NH2 | C45H59N10O8Cl3 | 972.3582 | 34 | 1+ | 973.3661 |
| 2+ | 487.1870 | |||||
| 3+ | 325.46326 | |||||
| 8 | H-Ile-Ile- Phe(4-Cl)-Phe(4-Cl)-Phe(4-Cl)-Ala-Ala-Lys-NH2 | C51H71N10O8Cl3 | 1056.452 | 27 | 1+ | 1057.4594 |
| 2+ | 529.2340 | |||||
| 3+ | 353.4945 | |||||
| 9 | H-Ile-Ile-Phe(4-Cl)-Phe(4-Cl)-Phe(4-Cl)-Ile-Ile-Ala-Ala-Ala-Ala-Lys-NH2 | C69H103N14O12Cl3 | 1424.695 | 19 | 1+ | 1425.702 |
| 2+ | 713.3552 | |||||
| 3+ | 476.24203 | |||||
| 10 | H-Ile-Ile-Ile- Phe(4-Cl)-Phe(4-Cl)-Phe(4-Cl)-Ile-Ile-Ile-Ala-Ala-Ala-Lys-NH2 | C78H120N15O13Cl3 | 1579.826 | 16 | 1+ | 1580.833 |
| 2+ | 790.9207 | |||||
| 3+ | 527.95236 |
Methods
Capturing N-Glycosites from Plasma Proteins (Glycocapture)
Glycocapture was done at the peptide level using the protocol described by Zhou et al. (15). Aliquots of 50 μl of male human plasma were first diluted with the same volume of 100 mm ammonium bicarbonate (pH 8.3), and proteins were denatured by slowly adding trifluoroethanol to 50% (v/v) final concentration. After the cystine residues were reduced by tris(2-carboxyethyl)phosphine (5 mm) and alkylated in iodoacetamide (10 mm) for 0.5 h, each at room temperature, samples were further diluted 10 times with 100 mm ammonium bicarbonate to a final volume of about 2 ml. Proteins were then digested with 40 μg of sequence grade trypsin overnight at 37 °C and cleaned up by a C18 spin column (500 mg; Waters, Milford, MA). The eluates were then dried down under vacuum and resuspended in 450 μl of coupling buffer (100 mm sodium acetate, 1 m sodium chloride, pH 4.5). After oxidization in 10 mm NaIO4 for 1 h at room temperature in the dark, peptides were cleaned up again on the same type of C18 column, and the peptides were eluted by 4 ml of 80% ACN in 0.1% TFA. Peptides were then directly mixed with 50 μl of Affi-Prep hydrazide slurry equilibrated with coupling buffer (pH 4.5) and kept in a shaker overnight at room temperature. Nonspecifically bound peptides were then removed by extensively washing the resin three times each subsequently with 1.5 m NaCl, 80% acetonitrile, Milli-Q water, and 0.1 m NH4HCO3. N-Glycosylated peptides were finally released from the resin by addition of 1 μl of protein N-glycosidase F and incubation overnight at 37 °C. The released peptides were extracted by washing with 200 μl of 80% ACN twice and further cleaned up using 96-well μElution mixed cation exchange (MCX) plates (Waters) before being analyzed on an LCQ Classic ion trap mass spectrometer (Thermo-Finnigan). The final volume was adjusted to 1600 μl/250 μl of initial plasma and was referred to and used as the Matrix solution for all experiments. The Matrix solution was stored at −80 °C until needed.
Adjusting H-PINS Concentrations
H-PINS 1–7 (Table I) were solubilized in 2% ACN, 0.1% TFA and H-PINS 8–10 were solubilized in 80% ACN, 0.1% TFA at a final concentration of 200 μg/ml. All peptide solutions were prepared by weighing the solid peptides and adding them directly to the solvent. An equimolar solution of H-PINS was then prepared and used to generate a 1000-fold dilution series of the H-PINS mixture. 1 μl of H-PINS mixture from each dilution (1×, 10×, 100×, and 1000×) was spiked in 9 μl of the Matrix solution, and each was analyzed by LC-MS for peak intensity detection using a 95-min gradient from 5 to 35% buffer B (98% ACN, 0.1% formic acid). Blanks were injected after each sample injection for carryover monitoring. For each H-PINS, the concentration that resulted in maximum ion intensity without detectable carryover was determined and used to make a 10× concentrated H-PINS solution that hereafter was referred to as the H-PINS Standard mix and was used for all further experiments (for the concentration of H-PINS in the Standard mix, see Table I).
Testing the Effect of H-PINS on Protein Identification
1 μl of H-PINS Standard mix was spiked in 9 μl of the Matrix solution. 1-μl injections of this mixture were analyzed by LC-MS/MS in triplicate using a 95-min gradient from 5 to 35% buffer B. The same experiment was repeated with the Matrix solution without H-PINS. The data for triplicate LC-MS/MS runs with and without H-PINS were searched separately for peptide identifications and comparison.
Intensity Normalization Dilution Series
1 μl of H-PINS Standard mix was added to 9 μl of the Matrix solution. A dilution series was prepared from this stock solution in the following order: 1000×, 500×, 100×, 50×, 10×, 5×, and 1×) with 1000× being the stock solution. 1 μl of each dilution was injected for LC-MS analysis in a 95-min gradient from 5 to 35% buffer B.
Sample Preparation QC Dilution Series
A dilution series was prepared from the Matrix solution in the following order: 10×, 7.5×, 5×, 2.5×, and 1.25× with 10× being the Matrix solution. 1 μl of H-PINS Standard mix was then added to 9 μl of each dilution to simulate variation in sample preparation. 1 μl of each spiked dilution was then injected for LC-MS analysis in a 95-min gradient from 5 to 35% buffer B.
Injection QC Dilution Series
1 μl of H-PINS Standard mix was added to 9 μl of the Matrix solution. A dilution series was prepared from this solution in the following order: 10×, 7.5×, 5×, 2.5×, and 1.25×. 1 μl of each dilution was injected for LC-MS analysis using a 95-min gradient from 5 to 35% buffer B.
Mass Calibration
Miscalibrated mass spectra were generated using the RecalOffline functionality of Xcalibur software (Thermo-Finnigan). The H-PINS5 doubly charged ion was used as an anchor for miscalibration, and all mass spectral features from all scans were shifted accordingly. Five miscalibrated LC-MS/MS runs were generated with mass shifts equal to 1.0, 0.75, 0.5, 0.25, and 0.125 Da. For recalibration, the LC-MS/MS TIC was sliced into 10 shorter TICs each including a single H-PINS in the middle using the RecalOffline function. After the TIC was sliced between each pair of H-PINS, each slice was calibrated separately using the mass to charge ratio of the residing H-PINS. Calibrated TIC slices were then converted to mzXML format and searched separately (16). The search results were then combined for PeptideProphet interaction (17).
Retention Time Synchronization for S/MRM
Multiple transitions were generated for each H-PINS using targeted identification and quantitative and analysis by MRM (TIQAM) software (5) and were validated by injecting 5 μl of H-PINS Standard mix for LC-MRM analysis. The most intense transitions for each H-PINS were established and used for retention time determination. S/MRM transitions were generated from LC-MS/MS data acquired by analyzing 1 μl of the Matrix solution spiked with H-PINS Standard mix (1 μl of H-PINS Standard mix in 9 μl of the Matrix solution) using the SpectraST algorithm (18). H-PINS features were then extracted from the LC-MS/MS ion chromatogram using Xcalibur Qual browser to determine their retention times. The retention times of extracted S/MRM transitions were synchronized using the H-PINS retention time from LC-MS/MS and S/MRM traces and monitored via time-scheduled S/MRM (5, 6).
LC-MS/MS Analysis
All samples were separated on a reversed-phase column packed with Magic C18AQ packing materials (5-μm particle size, 100-Å pore size) in 75-μm fritted capillary tubing (New Objectives, Woburn, MA) using a Proxeon EASY-nLC system (Odense, Denmark) at 250 nl/min. Buffer A was 0.1% formic acid in deionized H2O, and buffer B was 98% ACN, 0.1% formic acid in deionized H2O. Flow from the column was directed to an LTQ-Orbitrap mass spectrometer (Thermo-Finnigan) equipped with a nano-ESI source. Peptides were separated in a 95-min linear gradient (from 5 to 35% buffer B), and MS/MS spectra were acquired in positive ion mode at 1500 V of ionization voltage and 20 units of curtain gas at a sampling rate of one spectrum per second. The top five peptides with charges ranging from 2+ to 4+ were selected for CID. Once selected for CID, peptides were excluded from reselection for 60 s. The peak lists were generated using ReAdW software (version 4.0.2) from LTQ-Orbitrap RAW data files. SEQUEST version 27 (revision 0, copyright 1993) was used for database searches (19).
The following search parameters were used for peptide identification: the International Protein Index human version 3.34 database (67,764 sequences) was used, proteolysis was achieved with trypsin, up to two miscleavages were allowed, conversion of asparagine to aspartic acid (which results from the deglycosylation by protein N-glycosidase F) and oxidation of methionine were used as variable modifications, alkylation of cysteine by iodoacetamide was used as a fixed modification, peptide mass tolerance was set at ±1.5 Da, mass tolerance for fragment ions was set at ±3.0 Da, charge was specified for each peptide, and monoisotopic peaks were used for identification. PeptideProphet was used to determine identification confidence using a cutoff score to allow a 1.0% false discovery rate (17).
LC-MRM Analysis
H-PINS and other peptides from the Matrix solution were separated on an LC Packings PepMap 100 reversed-phase C18 column (0.075 × 150 mm) using a Tempo 2D NanoLC system from Eksigent (Eksigent Technologies, LLC, Dublin, CA) at 200 nl/min, and flow from the column was directed to a 4000QTrap mass spectrometer (Applied Biosystems) equipped with a nano-ESI source. S/MRM spectra were acquired in positive ion mode at 3000 V of ionization voltage and 30 units of nebulizer gas. The three most intense transitions were selected from the S/MRM spectra for each H-PINS to generate the final list of S/MRM transitions.
H-PINS Quantification
Quantification was done using two different algorithms. Initially all feature extraction and quantification operations were done using the Quan browser functionality of the Xcalibur software. For the automated processing of LC-MS runs with spiked in H-PINS, the open source program SuperHirn was adapted to recognize the isotopic distribution of the H-PINS peptides (11). Following peak picking, the extracted H-PINS were annotated and aligned together with all detected MS1 features across the different LC-MS runs into a MasterMap. The modified version of SuperHirn is integrated into the latest Corra software release. All normalizations were done using non-linear quantile normalization via Corra software (20).
RESULTS AND DISCUSSION
Analytical Strategy
In bottom-up proteomics where proteins are digested before analysis, the analytical matrix is quite uniform and mainly comprises peptides. Because peptides are quite specific in their physical and chemical behaviors (reflected via their chromatographic and mass spectral properties) a reliable signal reference would ideally be a peptide (22).
To generate a set of ISTDs universally applicable for peptide LC-MS and LC-MS/MS experiments using high mass accuracy instruments, we synthesized a set of halogenated peptides and analyzed them by LC-MS. The sequences of these peptides are listed in Table I. These peptides are easily detectable at the MS level by manual search and automated peak picking algorithms for the following reasons. 1) The peptides have natural isotope distributions that are distinct from those of physiological peptides due to the presence of the halogen atoms. 2) Halogens have a negative mass defect, which shifts the mass of halogenated peptides to slightly lower values compared with those of physiological peptides with the same nominal mass (23) and consequently reduces the chances of an overlap between H-PINS and other peptides significantly. 3) To ensure the efficient ionization of peptides and to minimize the amount of H-PINS spiked in, we incorporated a quaternized lysine in the structures of H-PINS 1–4 and amidated the C-terminal carboxyl groups of H-PINS 6–10. Both these modifications are known to increase the ionization efficiency of peptides (24, 25). As a result, all H-PINS ionize well in ESI mode and can be detected at low fmol level in complex mixtures. The H-PINS peptides were also designed so that their respective elution windows would span a conventional LC gradient and that the m/z values for the most abundant ions of these peptides were within the commonly scanned mass range (300–1500 Da).
The elution profile, isotopic distribution, and m/z value for all H-PINS separated using a 95-min gradient from 5 to 35% buffer B are shown in Fig. 1. The first H-PINS eluted 6 min after the first peptides of the Matrix solution (∼10% ACN), and the last H-PINS eluted 5 min after the last peptides (∼65% ACN). Therefore, the whole useful retention time range was covered. The H-PINS eluted sequentially with the retention time difference between each one being not more than 17 min and not less than 4 min. The isotopic distribution was distinctly different for the H-PINS compared with normal peptides (V-shape profile) except for H-PINS10 for which the first and second isotopic peak had similar intensity. Most H-PINS generated singly, doubly, and triply charged ions, but in most cases the doubly charged ions were the most intense peak. The m/z values ranged from 345 for H-PINS6 to 790 for H-PINS10.
Fig. 1.

LC-MS analysis of a sample consisting of the Matrix solution and H-PINS Standard mix. a, the gradient used for separation of the Matrix solution spiked with H-PINS Standard mix. b, the TIC of the Matrix solution spiked with H-PINS Standard mix acquired using an LTQ-Orbitrap mass spectrometer. c, extracted ion chromatograms of all 10 H-PINS with their respective retention time. d, mass and isotopic distributions from all H-PINS at a resolution of 50,000. NL, normalized.
ISTDs have diverse applications in qualitative and quantitative analyses, and H-PINS could be useful for a variety of proteomics applications. Demonstrating all potential applications for such ISTDs is beyond the scope of a single study. Therefore, in the following sections, several important applications for H-PINS are demonstrated. We based this on the biomarker discovery platform used in our group that utilizes selective isolation of N-glycosite peptides from plasma proteins followed by their mass spectrometric analysis (26). Specifically the platform uses label-free quantification for candidate biomarker discovery and S/MRM assays for biomarker validation. Related to label-free proteomics, we demonstrate that H-PINS represent suitable standard molecules for sample preparation and LC-MS QC, evaluation of normalization limits, and mass calibration. Related to S/MRM, we demonstrate the application of H-PINS for retention time QC and run time synchronization in time-scheduled measurements.
Concentration and Intensity Optimization for H-PINS
The ionization efficiency of peptides during ESI is variable and matrix-dependent. Thus, to generate an ISTD mixture with similar signal intensities for each ISTD, the sample load level for each H-PINS was optimized to generate a set of compounds with similar signal intensity (24). Our criteria for adjusting the H-PINS concentrations were as follows: 1) reach a signal with signal to noise ratio ≥100, 2) avoid chromatographic carryover, 3) avoid chromatographic artifacts such as fronting and tailing to help optimal quantification, and 4) avoid interference with data-dependent acquisition (DDA) and peptide identifications.
We accomplished this task by preparing a 1000-fold dilution series of an equimolar mixture of H-PINS spiked into a sample of enriched plasma N-glycosite peptides as an example of a complex biological sample (the Matrix solution). Injections were performed from the least concentrated sample to the most concentrated. Each run was followed by a blank injection to monitor carryover. When an ISTD peptide showed carryover, it was eliminated from the mixture, and the process was repeated until the maximum concentration without carryover was found for each H-PINS. The optimized mixture from this step was then used to evaluate the peak shape for each compound from the extracted ion chromatograms. If the peptide elution profile was not optimal (long elution, fronting, or tailing) the concentration for that peptide was reduced until a suitable elution profile was achieved. The final step in the optimization process was to test the potential effect of H-PINS on peptide identification by DDA in an ion trap mass spectrometer. The Matrix solution, with and without H-PINS, was analyzed via LC-MS/MS in triplicate. The data from each replicate were then pooled and searched by SEQUEST for comparison.
The optimized profile for all H-PINS is shown in Fig. 1. The elution times did not exceed 1 min for any of the H-PINS. The optimized intensities for H-PINS were not all in the same range. The amount for the most hydrophobic peptides (H-PINS 9 and 10) had to be reduced to minimize carryover. However, the signal intensities for all H-PINS were well above the noise level (signal to noise ratio of 10 or more). The curated peptide identification from the DDA experiment showed that the number of peptides identified (at a 1.0% false discovery rate; p = 0.95) was almost identical with or without the H-PINS present in the sample: 1010 peptide identifications from the Matrix solution without H-PINS added and 1018 identifications from the same sample spiked with H-PINS (see supplemental Table 1). The optimized concentrations determined for all H-PINS in this manner are listed in Table I. This set of concentrations was thus used to generate a standard mixture that was used for all experiments (H-PINS Standard mix).
Detecting the Limit of Intensity Normalization (Normalization QC)
In this section, we demonstrate how H-PINS can be used to evaluate limits of normalization performed by quantification algorithms used for label-free proteomics. The statistical packages commonly used for label-free quantifications correct intensity variation by normalizing the entire feature population (20). However, this process has limitations (11, 28). Data sets with variation beyond the statistical ability of the normalizing algorithm can increase the number of false positives significantly. We thus designed an experiment to demonstrate how H-PINS can be used to identify data sets with too much variation for effective normalization.
A 1000-fold dilution series (i.e. 1000×, 500×, 100×, 50×, 10×, 5×, and 1×) of the Matrix solution spiked with H-PINS Standard mix was prepared to simulate data sets with considerable variation. An equal volume (1 μl) from each dilution was injected for LC-MS analysis followed by feature extraction, alignment, and normalization using the SuperHirn-Corra platform (20).
The log of the normalized intensities, as a function of concentration -fold change, for eight H-PINS is shown in Fig. 2 (the last two H-PINS are not used for quantitative measurements and have other applications discussed later). The logarithmic curves were fitted using the curve fitting function in Excel. Almost all the curves followed a similar function due to normalization.
Fig. 2.

The log of normalized intensity versus relative concentration (simulating analytical variation) is shown. The normalization algorithm is capable of correcting up to about 10-fold variation. Variation beyond this value cannot be corrected by population normalization and would lead to serious errors and an increase in false positive assignments.
Based on the curves fitted for all the H-PINS, it was estimated that the Corra algorithm could only correct variations of up to 2-fold. For larger variations the signal could not be efficiently compensated by normalization. Obviously data with variation beyond this limit cannot be used for label-free quantification. These limits are completely platform-dependent and would have to be established for each platform separately.
Using H-PINS for Sample Preparation QC
An important step toward reducing the occurrence of data with variabilities that are beyond the value that can be compensated by normalization algorithms is to determine the sources of variation and to improve the reproducibility of the system. In this section we demonstrate how H-PINS were used to assess the reproducibility of sample preparation steps. To demonstrate the application of H-PINS for sample preparation QC, we designed the following experiment. Equal volumes of the Matrix solution spiked with H-PINS Standard mix were injected five times for LC-MS analysis to simulate data from samples with minimal variation. Next an 8-fold dilution series (i.e. 10×, 7.5×, 5×, 2.5×, and 1.25×) of the Matrix solution was prepared and spiked with H-PINS Standard mix. These samples were prepared to mimic variation in sample preparation, and hence H-PINS Standard mix was added in equal volumes after the dilution series was prepared. An equal volume of each dilution was then injected for LC-MS analysis to simulate data from samples with moderate variation.
Fig. 3a shows a volcano plot (a plot of -fold change versus the log odds of a feature being differentially abundant) derived from the LC-MS analysis of the five Matrix solution replicates spiked with H-PINS Standard mix. Data points above the dotted line represent features with a≥0.9 probability of being differentially abundant. The number of differentially expressed features found by the SuperHirn-Corra algorithm, in the absence of systematic variations, was 14 (in ideal conditions this number should have been zero). Fig. 3b shows the volcano plot derived from the LC-MS analysis of the Matrix solution dilution series spiked with H-PINS Standard mix. When 8-fold variations were introduced, the number of differentially abundant features detected increased to 79 even after the normalization performed by the Corra algorithm (Fig. 3b). Although it is easy to detect the increase in the number of differentially abundant features, in practice it is very difficult to find the source of variation. But with H-PINS as internal standards, the root cause of variation could be diagnosed as described below.
Fig. 3.

How H-PINS were used to isolate sample preparation as the main source of the variation in a data set. a shows a volcano plot that depicts the variations in five analytical replicates of the Matrix solution. Although these replicates were done in a controlled environment, 14 features were found to be differentially expressed by the label-free algorithm. In b the volcano plot shows the differentially expressed features found in the five analytical runs of an 8-fold Matrix solution dilution series. The number of differentially expressed features, despite normalization, has increased 5.6-fold to 79. c, the intensity of H-PINS (added after dilution) extracted from the dilution series LC-MS data shows no significant change, pinpointing sample preparation as the source of variation. AUP, area under the peak.
The mass spectral response (area under the curve) for H-PINS plotted versus the concentration -fold change is shown in Fig. 3c. The H-PINS were quantified by using the area under the peak from their extracted ion chromatograms (Fig. 3c). The non-normalized intensities for most H-PINS were quite similar across all runs with a slight negative slope due to differential ion suppression (it is important to note that for quantification purposes a few well behaved H-PINS are sufficient). The H-PINS behaviors are thus able to indicate that HPLC systems and mass spectrometers are working properly and that the variation occurred pre-LC-MS. This conclusion was made based on the fact that although significant change in the number of differentially abundant features was detected the signal intensity from H-PINS that were added after sample preparation remained almost constant. These results demonstrated the impact of sample preparation errors on the false positive rate, further emphasizing the need for a robust quality control method such as H-PINS.
Using H-PINS for LC-MS QC
In this section we demonstrate that H-PINS can be used to assess the performance of LC-MS instruments and to determine whether instrumental analysis is a major source of variation. Significant variation could be introduced during LC-MS analysis due to changes in sample concentration (e.g. via sample evaporation), misinjection (e.g. clogged needle, clogged sample loop, etc.), and irreproducible trapping (e.g. damaged trap or irreproducible solvent delivery). To demonstrate the application of H-PINS for LC-MS QC, we designed the following experiment. Equal volumes of the Matrix solution spiked with H-PINS Standard mix were injected five times for LC-MS analysis to simulate data acquired by a reproducible LC-MS system (the same data that were used for sample preparation QC). Then an 8-fold dilution series (i.e. 10×, 7.5×, 5×, 2.5×, and 1.25×) of spiked in Matrix solution was prepared to simulate data acquired by irreproducible LC-MS. These samples were prepared to mimic variation in LC-MS, and hence H-PINS Standard mix was added to the Matrix solution before the dilution series was prepared. An equal volume (1 μl) of each dilution was injected for LC-MS analysis.
Fig. 4a shows the volcano plot derived from the LC-MS analysis of the five Matrix solution replicates. When an 8-fold variation was introduced, the number of differentially expressed features increased 7-fold (total of 97 versus 14) (Fig. 4b). Although a significant increase in the number of differentially expressed features can be easily detected, the source of the variation is not easy to pinpoint in practice. Mass spectral signals generated by H-PINS can be used for such diagnosis as described below.
Fig. 4.

How H-PINS were used to isolate the LC-MS performance to be the source of the variation in data. a shows a volcano plot that depicts the variations in five analytical replicates of the Matrix solution. 14 features were found to be differentially expressed. In b the volcano plot shows the differentially expressed features found in the five analytical runs of an 8-fold Matrix solution dilution series. The number of differentially expressed features, despite normalization, has increased 7-fold to 97 features. c, the intensity of H-PINS (added before dilution) extracted from the dilution series LC-MS data shows a linear increase, pinpointing LC-MS as the source of variation.
The intensity -fold change versus injection variation plot for H-PINS is shown in Fig. 4c. The intensity -fold change for each H-PINS was calculated by measuring the area under the peak for that H-PINS in each dilution divided by the area under the curve for the same H-PINS in the least concentrated sample (Fig. 4c). All H-PINS showed a trend of increasing intensity as expected. The goal of this experiment was to show that irreproducibility in LC-MS performance could be detected if significant changes in signal intensity of H-PINS, added right before LC-MS analysis, were observed. We simulated such irreproducibility by having a dilution series, but in practice such variations would be introduced as a result of poor LC-MS performance. Not all H-PINS showed the same response sensitivity, but H-PINS 1, 3, and 4 were quite sensitive and could be used directly to measure the variation introduced by LC-MS.
Using H-PINS for Mass Calibration
When large sets of data are generated, for reproducibility reasons it is not desirable to stop and calibrate the LC-MS system every day. But running the mass spectrometers without daily calibration can affect the mass accuracy. We next sought to demonstrate the utility of H-PINS for postacquisition mass calibration (29).
We used a series of miscalibrated LC-MS/MS files, an H-PINS-assisted recalibrated file, and a well calibrated LC-MS/MS file from the Matrix solution analyses to show the impact of miscalibration and recalibration on peptide and protein identifications. The LC-MS/MS data from an LTQ-Orbitrap mass analyzer were first acquired with the instrument being calibrated within 10 ppm. Then this data file was miscalibrated postacquisition using the H-PINS5 doubly charged ion as the internal standard. In this process the features in all scans were shifted to higher mass values as a result of systematic mass shifts. LC-MS/MS data were miscalibrated for 1.0, 0.75, 0.5, 0.25, and 0.125 Da, respectively. Then the original file was recalibrated using H-PINS as internal standards. To use the entire set of H-PINS for recalibration, we sliced the LC-MS/MS data into sections by splitting the file between each pair of neighboring H-PINS. Each section was then calibrated using the exact mass of the H-PINS down to 1 ppm. To measure the success of the mass calibration, the miscalibrated files and the recalibrated files were then database-searched separately for comparison.
The numbers of unique peptides and proteins at equal false discovery rates of 1.2% were compared for all files (Table II). The result showed that mass variations as small as 0.125 Da (60 ppm for a doubly charged ion at 541.22-Da mass) can lead to an 8% difference in the number of confident protein identifications. The result also demonstrated that even with a calibrated instrument H-PINS-assisted postacquisition recalibration could result in improvement in positive protein identifications (7%). A significant decrease in the number of IDs was observed as the deviation from mass accuracy was increased (see supplemental Table 2). We used these data to show that even in the most stable systems H-PINS can be effectively used for postanalysis mass calibration. Obviously for data with inferior mass accuracy, the results would be more dramatic.
Table II. The number of peptides and proteins identified with p = 0.95 from calibrated, recalibrated, and miscalibrated LC-MS/MS data.
The highest numbers of proteins were identified when the LC-MS/MS data were recalibrated using H-PINS. Although larger numbers of peptides were identified using the calibrated LC-MS/MS data, the number of identified proteins was lower (7%). The number of positive protein and peptide IDs was significantly reduced as the mass deviation shifted toward higher values.
| Mass deviation | Unique peptide IDs at p = 0.95 | Unique protein IDs | Decrease in protein ID |
|---|---|---|---|
| % | |||
| Recalibrated | 662 | 143 | 0 |
| Calibrated | 721 | 134 | 7 |
| 0.125 Da | 646 | 132 | 8 |
| 0.250 Da | 584 | 122 | 17 |
| 0.500 Da | 443 | 103 | 30 |
| 0.750 Da | 179 | 49 | 190 |
| 1.000 Da | 63 | 22 | 550 |
Using H-PINS to Monitor the Performance of Chromatography Columns
One source of variation in chromatography comes from inconsistencies in the performance of chromatography columns, especially capillary columns used in nano-LC-MS. Because a high degree of RT reproducibility is essential for label-free quantification, frequent replacement of the chromatography column is not desirable. On the other hand, using a deteriorating column could have an adverse effect on the reproducibility. Deteriorating columns have common symptoms, such as increased back pressure and loss of resolution that negatively impact peptide detection mainly due to irreversible absorption of hydrophobic compounds, which bleed off the resin and leave a trace at the high organic end of the gradient. Two of the H-PINS (H-PINS 9 and 10) are quite hydrophobic and elute very late in this high organic region of the gradient. Our observations showed that the ionization of these H-PINS was suppressed by such hydrophobic contaminants, and as a result, the performance of the column can be monitored by monitoring the ionization of these two H-PINS. Based on our observations, more than a 10-fold decrease in the intensity of the extracted ion chromatogram for these peptides indicates column deterioration (data not shown).
Using H-PINS for RT Synchronization
Although precursor and fragment ion masses can easily be transferred between instruments, e.g. from a fast scanning mass spectrometer to an S/MRM-capable instrument such as a triple quadrupole mass spectrometer, retention times are more difficult to correlate because of the less reproducible nature of chromatography (6). Here we demonstrate how H-PINS could be used to synchronize the retention times between two completely different LC systems for scheduled S/MRM.
To find the H-PINS retention times in the LC system attached to the S/MRM-capable triple quadrupole mass spectrometer that used a Tempo (Eksigent) nanocapillary multidimensional LC system, the most intense transitions for each H-PINS were monitored. However, H-PINS retention times could have been measured as easily using high resolution quadrupole MS scans instead (Table III). The retention times of the H-PINS in the LC-MS system (Proxeon EASY-nLC system attached to the Orbitrap mass spectrometer) were determined by extracting H-PINS from the TIC of the spiked Matrix solution (Table II). LC separations were performed using the same gradient but with different columns and precolumns. The retention times and transitions for the rest of the features were then extracted from the LC-MS/MS data using the SpectraST algorithm (18). To synchronize the retention times for extracted features the following formula was used where RT(MS)HPINi − 1 ≤ RT(MS)featurex ≤ RT(MS)HPINi.
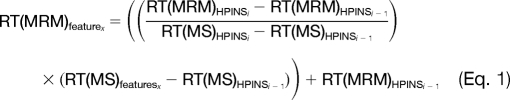 |
The success of the synchronization process was then tested in the following experiment. The retention times of 96 peptides (total of 280 transitions) were adjusted first by matching the dead volume between the two LC systems to examine the adequacy of such an approach (Fig. 5a). Then full retention time synchronization was performed using the formula described above (Fig. 5b). These 96 peptides were monitored via scheduled MRM using both sets of retention time.
Table III. List of retention times (in minutes) for all H-PINS recorded from LC-MS and MRM runs in a 95-min gradient as well as the most intense transitions and collision energies (CE).
| H-PINS no. | RT(MS) in 60-min gradient | RT(MRM) in 60-min gradient | Q1/Q3 | CE |
|---|---|---|---|---|
| 1 | 27.91 | 11.19 | 264.1136/396.1287 | 13.96979 |
| 264.1136/395.2043 | 13.96979 | |||
| 2 | 42.45 | 20.54 | 477.1981/345.1451 | 26.49672 |
| 318.468/345.1451 | 16.74187 | |||
| 318.468/501.2462 | 16.74187 | |||
| 318.468/558.2676 | 16.74187 | |||
| 3 | 49.25 | 26.92 | 526.7323/477.15 | 28.67622 |
| 351.4908/396.1287 | 18.42603 | |||
| 351.4908/772.3146 | 18.42603 | |||
| 526.7323/657.336 | 28.67622 | |||
| 351.4908/281.1501 | 18.42603 | |||
| 4 | 55.20 | 32.33 | 608.264/820.3994 | 32.26362 |
| 405.8453/607.2768 | 21.19811 | |||
| 405.8453/820.3994 | 21.19811 | |||
| 405.8453/281.1501 | 21.19811 | |||
| 5 | 72.56 | 47.54 | 541.2213/318.1122 | 29.31374 |
| 361.1502/499.1416 | 18.91866 | |||
| 541.2213/583.3011 | 29.31374 | |||
| 541.2213/764.3305 | 29.31374 | |||
| 541.2213/945.3599 | 29.31374 | |||
| 361.1502/260.1974 | 18.91866 | |||
| 6 | 81.90 | 55.90 | 345.1127/259.16 | 20.68496 |
| 345.1127/509.1722 | 20.68496 | |||
| 7 | 88.82 | 62.82 | 487.187/541.2541 | 26.93623 |
| 487.187/722.2836 | 26.93623 | |||
| 487.187/903.313 | 26.93623 | |||
| 487.187/360.2247 | 26.93623 | |||
| 8 | 99.04 | 73.17 | 529.2339/185.1 | 28.78629 |
| 529.2339/477.15 | 28.78629 | |||
| 529.2339/651.2464 | 28.78629 | |||
| 529.2339/832.2759 | 28.78629 | |||
| 529.2339/945.3599 | 28.78629 | |||
| 529.2339/470.217 | 28.78629 | |||
| 9 | 117.63 | 111.44 | 713.3551/838.4593 | 36.88762 |
| 713.3551/1200.518 | 36.88762 | |||
| 713.3551/657.4299 | 36.88762 | |||
| 475.906/544.3459 | 24.77121 | |||
| 475.906/657.4299 | 24.77121 | |||
| 10 | 121.51 | 115.92 | 790.9206/880.5063 | 40.30051 |
| 790.9206/1061.536 | 40.30051 | |||
| 790.9206/1242.565 | 40.30051 | |||
| 790.9206/1355.649 | 40.30051 | |||
| 790.9206/699.4769 | 40.30051 | |||
| 527.6163/586.3928 | 27.40843 |
Fig. 5.

a, retention shift by matching the elution dead volume. b, retention synchronization using dynamic alignment. c, the scheduled MRM for 96 peptides (total of 280 transitions) using retention shift is shown. Not a single transition was detected using this approach. d, when the same 280 transitions were scheduled for MRM using synchronized retention time, 144 transitions were detected. cps, counts/s.
The next equally important question that we sought to answer was the accuracy of synchronized retention times. Synchronization accuracy determines the percentage of synchronized RTs that are close enough to their true value to be detectable within the allowed RT window. To test the accuracy of our model, a set of 80 peptides (with a total of 235 transitions) was monitored using scheduled S/MRM with synchronized RT and 5-min scan time for each peptide. The same set of peptides was monitored using unscheduled S/MRM (in unscheduled MRM, transitions are constantly monitored for the duration of the acquisition time). The goal of the experiment was to determine whether any of the peptides detected in unscheduled S/MRM were missed if synchronized scheduled S/MRM was applied.
The results from the first experiment showed that, without full synchronization, no peptide was detected by scheduled S/MRM. (Fig. 5, c and d). This means that retention times are dynamic values that change unproportionately, and for full synchronization, multiple retention time gauges are required. The other important question that we sought to answer was the accuracy of the synchronization process by monitoring a large number of transitions with and without scheduling. The results showed not only that no peptide was missing from the scheduled run but also that the intensities were higher perhaps because of the acquisition of more data points per peak (Fig. 6).
Fig. 6.

A set of 80 peptides (total of 235 transitions) monitored using scheduled MRM with synchronized RT (top) as well as unscheduled MRM (bottom). Not only were all peptides that were detected in unscheduled MRM detected in scheduled mode, they also had more intensity. cps, counts/s.
Overall these experiments show that H-PINS could be used for retention time transfer between instruments without sacrificing transitions in scheduled mode. In addition, H-PINS can be used to monitor instrument drifting and retention time shifts caused by instrument aging and repair.
Conclusion
Mass spectrometry-based peptide quantification has emerged as a useful tool for protein quantifications from complex mixtures; however, the successful application of these methods requires high levels of reproducibility. Here we introduce a set of 10 halogenated peptides to be used as internal standards for quality control and reproducibility screening of the entire analytical platform for label-free quantitative proteomics experiments. We showed how H-PINS can be used to detect the boundaries of normalization algorithms. We conducted experiments to demonstrate how H-PINS can effectively identify sources of variations (i.e. sample preparation versus LC-MS). H-PINS were also used for off-line calibration of MS data and performance monitoring of chromatography columns. Finally we showed that H-PINS can be used to synchronize retention times between instruments to make scheduled S/MRM experiments possible with transitions extracted from MS/MS data.
Traditionally quantification in proteomics has been accomplished by in vivo or in vitro heavy isotope tagging of peptides (27, 30). Although the outcome of isotope labeling-based quantifications is less dependent on system reproducibility, internal standards such as H-PINS could be used to monitor the labeling reaction reproducibility. The performance of LC-MS units can also be monitored using H-PINS especially when a significant variation in LC-MS performance leads to poor and variable peptide identifications.
Footnotes
* This work was supported, in whole or in part, by National Institutes of Health Contract N01-HV-8179 from the NHLBI Seattle Proteome Center (to R. A.).
 The on-line version of this article (available at http://www.mcponline.org) contains supplemental material.
1 The abbreviations used are:
- ISTD
- internal standard
- H-PINS
- halogenated peptides as internal standards
- QC
- quality control
- MRM
- multireaction monitoring
- SRM
- selected reaction monitoring
- RT
- retention time
- TIC
- total ion chromatogram
- LTQ
- linear trap quadrupole
- DDA
- data-dependent acquisition
- IDs
- identifications.
REFERENCES
- 1.Higgs R. E., Knierman M. D., Gelfanova V., Butler J. P., Hale J. E. ( 2008) Label-free LC-MS method for the identification of biomarkers. Methods Mol. Biol. 428, 209– 230 [DOI] [PubMed] [Google Scholar]
- 2.Kim Y. J., Zhan P., Feild B., Ruben S. M., He T. ( 2007) Reproducibility assessment of relative quantitation strategies for LC-MS based proteomics. Anal. Chem. 79, 5651– 5658 [DOI] [PubMed] [Google Scholar]
- 3.Jaffe J. D., Keshishian H., Chang B., Addona T. A., Gillette M. A., Carr S. A. ( 2008) Accurate inclusion mass screening: a bridge from unbiased discovery to targeted assay development for biomarker verification. Mol. Cell. Proteomics 7, 1952– 1962 [DOI] [PMC free article] [PubMed] [Google Scholar]
- 4.Schmidt A., Gehlenborg N., Bodenmiller B., Mueller L. N., Campbell D., Mueller M., Aebersold R., Domon B. ( 2008) An integrated, directed mass spectrometric approach for in-depth characterization of complex peptide mixtures. Mol. Cell. Proteomics 7, 2138– 2150 [DOI] [PMC free article] [PubMed] [Google Scholar]
- 5.Lange V., Malmström J. A., Didion J., King N. L., Johansson B. P., Schäfer J., Rameseder J., Wong C. H., Deutsch E. W., Brusniak M. Y., Bühlmann P., Björck L., Domon B., Aebersold R. ( 2008) Targeted quantitative analysis of Streptococcus pyogenes virulence factors by multiple reaction monitoring. Mol. Cell. Proteomics 7, 1489– 1500 [DOI] [PMC free article] [PubMed] [Google Scholar]
- 6.Stahl-Zeng J., Lange V., Ossola R., Eckhardt K., Krek W., Aebersold R., Domon B. ( 2007) High sensitivity detection of plasma proteins by multiple reaction monitoring of N-glycosites. Mol. Cell. Proteomics 6, 1809– 1817 [DOI] [PubMed] [Google Scholar]
- 7.Kirkpatrick D. S., Gerber S. A., Gygi S. P. ( 2005) The absolute quantification strategy: a general procedure for the quantification of proteins and post-translational modifications. Methods 35, 265– 273 [DOI] [PubMed] [Google Scholar]
- 8.Beynon R. J., Doherty M. K., Pratt J. M., Gaskell S. J. ( 2005) Multiplexed absolute quantification in proteomics using artificial QCAT proteins of concatenated signature peptides. Nat. Methods 2, 587– 589 [DOI] [PubMed] [Google Scholar]
- 9.Tabata T., Sato T., Kuromitsu J., Oda Y. ( 2007) Pseudo internal standard approach for label-free quantitative proteomics. Anal. Chem. 79, 8440– 8445 [DOI] [PubMed] [Google Scholar]
- 10.Morris J. S., Coombes K. R., Koomen J., Baggerly K. A., Kobayashi R. ( 2005) Feature extraction and quantification for mass spectrometry in biomedical applications using the mean spectrum. Bioinformatics 21, 1764– 1775 [DOI] [PubMed] [Google Scholar]
- 11.Mueller L. N., Rinner O., Schmidt A., Letarte S., Bodenmiller B., Brusniak M. Y., Vitek O., Aebersold R., Müller M. ( 2007) SuperHirn—a novel tool for high resolution LC-MS-based peptide/protein profiling. Proteomics 7, 3470– 3480 [DOI] [PubMed] [Google Scholar]
- 12.Gygi S. P., Rist B., Gerber S. A., Turecek F., Gelb M. H., Aebersold R. ( 1999) Quantitative analysis of complex protein mixtures using isotope-coded affinity tags. Nat. Biotechnol. 17, 994– 999 [DOI] [PubMed] [Google Scholar]
- 13.Ong S. E., Blagoev B., Kratchmarova I., Kristensen D. B., Steen H., Pandey A., Mann M. ( 2002) Stable isotope labeling by amino acids in cell culture, SILAC, as a simple and accurate approach to expression proteomics. Mol. Cell. Proteomics 1, 376– 386 [DOI] [PubMed] [Google Scholar]
- 14.Shiio Y., Aebersold R. ( 2006) Quantitative proteome analysis using isotope-coded affinity tags and mass spectrometry. Nat. Protoc. 1, 139– 145 [DOI] [PubMed] [Google Scholar]
- 15.Zhou Y., Aebersold R., Zhang H. ( 2007) Isolation of N-linked glycopeptides from plasma. Anal. Chem. 79, 5826– 5837 [DOI] [PubMed] [Google Scholar]
- 16.Pedrioli P. G., Eng J. K., Hubley R., Vogelzang M., Deutsch E. W., Raught B., Pratt B., Nilsson E., Angeletti R. H., Apweiler R., Cheung K., Costello C. E., Hermjakob H., Huang S., Julian R. K., Kapp E., McComb M. E., Oliver S. G., Omenn G., Paton N. W., Simpson R., Smith R., Taylor C. F., Zhu W., Aebersold R. ( 2004) A common open representation of mass spectrometry data and its application to proteomics research. Nat. Biotechol. 22, 1459– 1466 [DOI] [PubMed] [Google Scholar]
- 17.Keller A., Nesvizhskii A. I., Kolker E., Aebersold R. ( 2002) Empirical statistical model to estimate the accuracy of peptide identifications made by MS/MS and database search. Anal. Chem. 74, 5383– 5392 [DOI] [PubMed] [Google Scholar]
- 18.Lam H., Deutsch E. W., Eddes J. S., Eng J. K., King N., Stein S. E., Aebersold R. ( 2007) Development and validation of a spectral library searching method for peptide identification from MS/MS. Proteomics 7, 655– 667 [DOI] [PubMed] [Google Scholar]
- 19.Eng J., McCormack A., Yates J. ( 1994) An approach to correlate tandem mass spectral data of peptides with amino acid sequences in a protein database. J. Am. Soc. Mass Spectrom. 5, 976– 989 [DOI] [PubMed] [Google Scholar]
- 20.Brusniak M. Y., Bodenmiller B., Campbell D., Cooke K., Eddes J., Garbutt A., Lau H., Letarte S., Mueller L. N., Sharma V., Vitek O., Zhang N., Aebersold R., Watts J. D. ( 2008) Computational framework and tools for LC-MS discovery and targeted mass spectrometry-based proteomics. BMC Bioinformatics 9, 542– 564 [DOI] [PMC free article] [PubMed] [Google Scholar]
- 21.Deleted in proof
- 22.Wilson K. J., Honegger A., Stötzel R. P., Hughes G. J. ( 1981) The behaviour of peptides on reverse-phase supports during high-pressure liquid chromatography. Biochem. J. 199, 31– 41 [DOI] [PMC free article] [PubMed] [Google Scholar]
- 23.Zhang H., Zhu M., Ray K. L., Ma L., Zhang D. ( 2008) Mass defect profiles of biological matrices and the general applicability of mass defect filtering for metabolite detection. Rapid Commun. Mass Spectrom. 22, 2082– 2088 [DOI] [PubMed] [Google Scholar]
- 24.Mirzaei H., Regnier F. ( 2006) Enhancing electrospray ionization efficiency of peptides by derivatization. Anal. Chem. 78, 4175– 4183 [DOI] [PubMed] [Google Scholar]
- 25.Mok K. ( January1, 2008) Pharmaceutical composition comprising a retro-iverso isomer peptide. U. S. Patent 7314867 [Google Scholar]
- 26.Zhang H., Aebersold R. ( 2006) Isolation of glycoproteins and identification of their N-linked glycosylation sites. Methods Mol. Biol. 328, 177– 185 [DOI] [PubMed] [Google Scholar]
- 27.Broom B. M., Do K. A. ( 2008) Statistical methods for biomarker discovery using mass spectrometry, in Statistical Advances in the Biomedical Sciences ( Biswas A., Datta S., Fine J. P., Segal M. R. eds) pp. 465– 486, Wiley-Interscience, New York [Google Scholar]
- 28.Old W. M., Meyer-Arendt K., Aveline-Wolf L., Pierce K. G., Mendoza A., Sevinsky J. R., Resing K. A., Ahn N. G. ( 2005) Comparison of label-free methods for quantifying human proteins by shotgun proteomics. Mol. Cell. Proteomics 4, 1487– 1502 [DOI] [PubMed] [Google Scholar]
- 29.Deleted in proof
- 30.Isserlin R., Emili A. ( 2008) Interpretation of large-scale quantitative shotgun proteomic profiles for biomarker discovery. Curr. Opin. Mol. Ther. 10, 231– 242 [PubMed] [Google Scholar]