

Abstract
Unmasking the neural basis of neurodevelopmental disorders, such as autism spectrum disorders (ASD), requires studying functional connectivity during childhood when cognitive skills develop. A functional connectivity magnetic resonance imaging (fcMRI) analysis was performed on data collected during Go/NoGo task performance from 24 children ages 8–12 years (12 with ASD; 12 controls matched on age and intellectual functioning). We investigated the connectivity of the left and right inferior frontal cortex (IFC; BA 47), key regions for response inhibition, with other active regions in frontal, striatal, and parietal cortex. Groups did not differ on behavioral measures or functional connectivity of either IFC region. A trend for reduced connectivity in the right IFC for the ASD group was revealed when controlling for age. In the ASD group, there was a significant negative correlation between age and 2 right IFC correlation pairs: right IFC–bilateral presupplementary motor area (BA 6) and right IFC–right caudate. Compared with typical controls, children with ASD may not have gross differences in IFC functional connectivity during response inhibition, which contrasts with an adult study of ASD that reported reduced functional connectivity. This discrepancy suggests an atypical developmental trajectory in ASD for right IFC connectivity with other neural regions supporting response inhibition.
Keywords: autism, children, cognition, functional connectivity, response inhibition
Introduction
Autism spectrum disorders (ASD) are neurodevelopmental disorders characterized by impairments in social interactions, communication, and restricted, repetitive behaviors, and interests. Additionally, the phenotype may also include atypical development of response inhibition, the ability to withhold a prepotent response based on a rule (Luna et al. 2007). This cognitive process is subserved by a distributed functional network in which the prefrontal cortex, in particular the right inferior frontal cortex (IFC), plays a critical role (Aron and Poldrack 2005). Neuropsychological studies do not reveal a clear picture of response inhibition performance in individuals with ASD (Ozonoff et al. 1994; Ozonoff and Strayer 1997; Geurts et al. 2004; Christ et al. 2006); however, functional neuroimaging studies of adults with ASD reveal atypical activation in the IFC relative to neurotypical controls despite equivalent behavioral performance between the groups (Schmitz et al. 2006; Kana et al. 2007). Furthermore, functional connectivity MRI (fcMRI) analyses in adults with ASD revealed decreased synchronization of brain regions commonly activated during response inhibition tasks (Kana et al. 2007). We do not know if reduced functional connectivity exists in children with ASD.
Connectivity has also been studied at the structural level in typically developing children and in children with ASD. Longitudinal structural studies of typical development show a number of changes including increased white matter (Giedd et al. 1996, 1999; Paus et al. 1999) in the prefrontal cortex from childhood through early adulthood. This prolonged maturation of the prefrontal cortex has been hypothesized to contribute to the ongoing development of cognitive processes, including response inhibition (Mesulam 2002). There is also evidence suggesting that atypical white matter and functional connectivity to and from the prefrontal cortex contributes to neural and behavioral differences in ASD (Herbert, Ziegler, Deutsch, et al. 2003, 2004; Barnea-Goraly et al. 2004; Belmonte et al. 2004; Alexander et al. 2007; Ben Bashat et al. 2007; Just et al. 2007; Keller et al. 2007; Sundram et al. 2008; for reviews, see Belmonte et al. 2004; Courchesne et al. 2007; Müller 2007). In particular, cross-sectional structural studies using diffusion tensor imaging (DTI) techniques in children with ASD show atypical development of white matter in the prefrontal cortex (Barnea-Goraly et al. 2004; Alexander et al. 2007; Ben Bashat et al. 2007; Keller et al. 2007; Sundram et al. 2008), and volumetric studies have shown abnormal white matter volumes, particularly in boys (Herbert et al. 2003, 2004). Thus, the present fcMRI investigation of inhibition in children with ASD is motivated both by findings of reduced functional connectivity in adults with ASD during an inhibition task and evidence of a prolonged and, in the case of ASD, atypical developmental trajectory for neural structures that likely subserve inhibitory functions in the brain.
Although group average functional MRI (fMRI) data analysis can reveal differences in brain regions consistently engaged during task performance, an fcMRI analysis can reveal differences in interregional synchronization, which serves as an estimate for connectivity of these regions (Friston 1994; Rogers et al. 2007). fcMRI analyses offer complementary information as 2 groups can show similar fMRI group maps but differences in fcMRI results. For example, a recent fcMRI study in typical adolescents and adults documented both groups engaging the same 3 functional subnetworks for a response inhibition task (parietal–premotor, fronto-striatal-thalamic, frontoparietal), but the synchronization of the subnetworks differed between age groups (Stevens et al. 2007).
Response inhibition lends itself to investigation of functional connectivity because it is thought to rely on a large neural network. Its neural basis includes a distributed functional network that is hypothesized to include a frontal–striatal–thalamic loop (Casey et al. 2001; Rubia et al. 2001, 2006; Bunge et al. 2002; Durston, Thomas, Worden, et al. 2002; Durston, Thomas, Yang, et al. 2002; Aron and Poldrack 2005, 2006; Booth et al. 2005; Vaidya et al. 2005; Wager et al. 2005; Stevens et al. 2007), which interfaces with superior and inferior parietal cortex (BA 7/39/40; superior and inferior parietal lobules; Bunge et al. 2002; Tamm et al. 2002; Booth et al. 2005; Wager et al. 2005; Stevens et al. 2007). Anterior regions supporting response inhibition include the IFC (BA 44/45/47), insula and dorsolateral prefrontal cortex (DLPFC; BA 9/46; midfrontal gyrus), and the presupplementary motor area (pSMA; BA 6) in medial frontal lobe. Finally, the anterior cingulate cortex (BA 32) has been reported to support successful response inhibition because this region in conjunction with the pSMA contributes to action selection (Rushworth et al. 2004).
Three lines of converging evidence suggest that the IFC, particularly the right IFC, is an important region for successful response inhibition performance. First, fMRI data in neurotypical adults reveal that increased IFC activation correlates with better behavioral performance (Durston, Thomas, Worden, et al. 2002). Second, patients with lesions to IFC demonstrate poorer response inhibition performance relative to patients with lesions to other frontal areas (Aron et al. 2003). Third, diffusion-weighted imaging tractography in neurotypical adults indicates that the IFC is 1 of 3 regions required for successful response inhibition performance (Aron et al. 2007).
The present study seeks to explore in children the previously reported finding of decreased synchronization between the right IFC and other frontal regions (i.e., right insula and anterior cingulate) in adults with ASD (Kana et al. 2007). We investigated functional connectivity of IFC in school-aged children with and without ASD during performance of a response inhibition task (Go/NoGo). Although group differences in neural activation patterns may exist, the current study focused on regions consistently activated by both groups in order to reduce the effects of individual variability. Based on previous adult findings and the importance of the IFC (Casey et al. 2001; Rubia et al. 2001, 2006; Bunge et al. 2002; Durston, Thomas, Worden, et al. 2002; Durston, Thomas, Yang, et al. 2002; Aron et al. 2003, 2007; Aron and Poldrack 2005; Booth et al. 2005; Vaidya et al. 2005; Kana et al. 2007), we predicted that children with ASD would demonstrate reduced functional connectivity between left and right IFC regions and other frontal, striatal, or parietal regions active during the Go/NoGo task. For this reason, we used a coactivation method, correlating a seed IFC region's activity with the activity from a frontal, striatal, or parietal region-of-interest (ROI) that was derived from a group average map that combined data across diagnostic groups (Kennedy and Courchesne 2008). The present investigation also examined whether age or intellectual functioning was linearly related to behavioral performance or functional connectivity, because not only do children have greater variability in task performance than adults, but also individuals with ASD have greater variability in neural activation compared with neurotypical controls (Müller et al. 2003; Berl et al. 2006).
Methods
Participants
Twelve (9 males) children with ASD ages 8–12 years (M = 10.17, standard deviation [SD] = 1.57) with a mean full-scale IQ (FSIQ) in the High Average range (M = 113.33, SD = 17.33) and 12 (8 males) typically developing control children (Control) ages 8–12 years (M = 11.01, SD = 1.78) with a mean FSIQ in the High Average range (M = 114.92, SD = 10.28) matched on age, FSIQ, and gender participated in the study. Based on parent report on items from the Edinburgh Handedness Inventory (Oldfield 1971), the ASD group had 9 right-handed and 1 left-handed children (2 parents did not complete the measure); the Control group had 11 right-handed children (1 parent did not complete the measure). ASD diagnoses were confirmed with the Autism Diagnostic Observation Schedule (ADOS) (Lord et al. 2000) and Autism Diagnostic Interview—Revised (ADI-R) (Lord et al. 1994), as well as clinical judgment using the DSM-IV. With the exception of one child's score on the restricted, repetitive, behavior, and interests on the ADI-R, symptom severity was above cutoff for all children on all measures (see Supplementary Materials). The Control groups did not receive diagnostic measures for ASD but were screened for developmental delays, learning disorders, psychiatric disorders, and neurological conditions through a phone interview, the Behavior Assessment System for Children (BASC; Reynolds and Kamphaus 1998) and medical/family history questionnaire. The protocol was approved by the Institutional Review Board, parents provided consent, participants provided assent prior to MRI and diagnostic sessions, and participants received monetary compensation. Additional participant information is available in Supplementary Materials.
Task Procedure
Participants completed a Go/NoGo task that consisted of 6 alternating Go and NoGo blocks, each 25 s long. Each block began with task instructions (Go blocks: “Press for all letters”; NoGo blocks: “Do not press for X”) followed by a consonant letter on each trial (9 trials per block). The Go blocks did not contain the letter “X”; no letters repeated within a Go block. NoGo blocks contained the letter “X” for 25% of the trials (12.5% overall); no other letters but “X” repeated during NoGo blocks. Presentation rate was equal for Go and NoGo blocks (exposure presentation = 1000 ms; intertrial interval = 1500 ms). Stimuli were presented in e-Prime (Psychological Software Tools, Inc., Pittsburgh, PA) and viewed through a magnet compatible projector. Responses were recorded via a fiber optic button box held in the right hand. Head movement was minimized by placing small foam cushions on the sides of the subject's head as well as offering the option of a leg cushion to reduce back and neck strain or a weighted sandbag or sheet on the participant's legs.
Imaging Procedure
Functional images were acquired on a Siemens Trio 3T MRI scanner (Erlangen, Germany) using a T2*-sensitive gradient echo pulse sequence with the following parameters: time repetition = 2500 ms, time echo = 30 ms, 256 × 256 mm field of view, 64 × 64 acquisition matrix, and a 90 degree flip angle. Forty-two 3.7-mm thick slices were acquired descending in the transverse plane (width = 3.7 mm, gap width = 0.3 mm, effective width = 4 mm) for 122 time points (the first 2 time points were included for signal stabilization and were discarded from analysis). For each subject, 10 temporally contiguous volumes were collected in each block, resulting in a total of 120 volumes, 60 for Go blocks and 60 for NoGo blocks.
Data Analysis
Behavioral Data
For each child, 3 measures were computed: 1) errors of commission—responding to a NoGo stimulus (“X”); 2) errors of omission—failing to respond to a Go stimulus (any letter other than “X”); 3) median response time for Go trials in Go and NoGo blocks separately. To detect group differences, independent t-tests were conducted on errors of commission and omission. Median response times for Go trials were entered into a Block Type (Go, NoGo) × Group (ASD, Control) repeated measures analysis of variance (ANOVA), with Block Type as a within-subjects factor and Group as a between-subjects factor. We also conducted Pearson correlations between Age, FSIQ, and each of the behavioral measures of interest to determine whether these factors influenced response inhibition performance.
fMRI Data
Preprocessing and group analyses were conducted in SPM5 (Wellcome Department of Cognitive Neurology, London, UK) implemented in Matlab (Version 7.4, Mathworks, Inc., Sherborn, MA). Images were corrected for slice time acquisition differences, realigned (estimated and resliced), and then normalized into the Montreal Neurological Institute (MNI) standard anatomical space and interpolated to 2 × 2 × 2 mm cubic voxels. Normalized image volumes were spatially smoothed using an 8-mm full width at half maximum Gaussian kernel and temporally filtered (high-pass filter: 128 s). fMRI responses were modeled by a canonical hemodynamic response function; signal related to aliased biorhythms was removed with an autoregressive model (AR[1]) during parameter estimation. For each subject, activation maps were generated using a linear contrast identifying regions showing greater activation during NoGo relative to Go blocks, with realignment parameters (x, y, z, roll, pitch, and yaw) entered as covariates. Of note, fMRI results and group differences are not presented here because those results will be submitted for publication in a separate manuscript.
Functional Connectivity
The fcMRI methods were based on a previous study of connectivity during response inhibition in adults with ASD (Kana et al. 2007). We first determined a network of brain regions activated consistently during the NoGo versus Go contrast for both groups by obtaining a whole-brain activation map from a single random effects model derived from individual activation maps averaged across participants in both groups (henceforth, “combined group”). Then, parameter estimates for significant activation clusters in frontal, striatal, and parietal regions derived from the combined group map were entered into t-tests with Group as the between-subjects factor to ensure activations did not differ by group. With the exception of the right cingulate cortex, which showed greater activation in the ASD than control group, t22 = 2.52, P < 0.05, no other regions’ activation differed significantly between groups (all other Ps > 0.05; however, pSMA and right DLPFC were marginally different with the ASD group activating more than controls, 0.05 < Ps < 0.10) (see Fig. 1). Right cingulate cortex was excluded from the connectivity analyses as differences involving the right cingulate cortex could reflect group differences in activation (Müller 2007).
Figure 1.

ROI parameter estimates for ASD and CON groups in each ROI.
Our response inhibition network included 10 ROIs derived from the activation clusters from the combined group map. Two of the activation clusters (left and right IFC) served as seed regions for the subsequent connectivity analyses. The remaining 8 ROIs included: left DLPFC (BA 9/46), right DLFPC (BA 9/46), bilateral pSMA (BA 6), left cingulate (BA 32), right caudate, left inferior parietal cortex (BA 40), right inferior parietal cortex (BA 40), and a second right inferior parietal cortex cluster (BA 39) (for coordinates, see Table 1). The pSMA was a single ROI because the cluster was medial and spanned both hemispheres equally. The ROIs were consistent with regions reported in past studies of response inhibition in typical individuals (Casey et al. 2001; Rubia et al. 2001, 2006; Bunge et al. 2002; Durston, Thomas, Yang et al. 2002; Aron and Poldrack 2005; Booth et al. 2005; Vaidya et al. 2005; Kana et al. 2007). Both seed and nonseed ROIs were defined by taking the peak voxel of activation within the significant clusters from the combined group map and then drawing a sphere around the cluster; spheres varied from 4 to 12 mm based on the cluster size. ROIs were visually inspected to insure that all voxels lay inside the brain. Finally, time series data for each subject were extracted for each ROI with MarsBar (Brett et al. 2002) and individually correlated with the 2 seed regions (left IFC and right IFC).
Table 1.
Regional activation for the NoGo versus Go trials in the combined group map
| Region of activation | Brodmann's area | Talairach coordinates | Volume (mm3) | z score | ||
| x | y | z | ||||
| pSMA | 6 | 5 | 6 | 42 | 7248 | 3.72 |
| Left IFC | 47 | −32 | 18 | −10 | 256 | 2.51 |
| Right IFC | 47 | 31 | 14 | −13 | 4160 | 3.10 |
| Left DLPFC | 9/46 | −27 | 35 | 13 | 2176 | 3.23 |
| Right DLPFC | 9/46 | 29 | 27 | 20 | 2144 | 3.99 |
| Left cingulate | 32 | −13 | 15 | 19 | 560 | 3.31 |
| Right caudate | NA | −8 | 2 | 9 | 2128 | 3.00 |
| Right inferior parietal | 39 | 54 | −46 | 22 | 4224 | 3.66 |
| Left inferior parietal | 40 | −53 | −26 | 39 | 3992 | 3.57 |
| Right inferior parietal | 40 | 42 | −27 | 42 | 4176 | 4.25 |
Note: Talairach coordinates converted from MNI space with Yale's Nonlinear MNI to Talairach algorithm. All regions significant at P < 0.05 uncorrected, k = 20.
To determine group differences, each correlation coefficient was transformed to Fisher's z’ score and submitted into separate repeated measures ANOVA's for left and right IFC. The between-subjects’ variable was Group (ASD vs. Control), and the within-subjects’ variable was ROI seed pair (e.g., right IFC–pSMA). Then, we entered Age and FSIQ as covariates in a repeated measure analysis of covariance (ANCOVA) to examine their effects on group differences in connectivity. If Age or FSIQ influenced the ANCOVAs, we conducted follow-up correlation analyses to determine whether these influences affected groups equally. We also used spearman's rho to correlate the Fisher's z’ of each ROI pair with core symptom domains from the ADI-R.
Results
Behavioral Results
Due to computer failure, behavioral data were lost on 3 participants (2 Control, 1 ASD). Groups did not differ in their errors of omission during Go blocks (ASD: M = 0.81, SD = 1.08; Control: M = 1.60, SD = 1.65; t19 = 1.30, P = 0.21), in their errors of omission during NoGo blocks (ASD: M = 0.91, SD = 1.22; Control: M = 0.90, SD = 1.29; t19 = 0.02, P = 0.99), or in their errors of commission during NoGo blocks (ASD: M = 2.73, SD = 1.85; Control: M = 2.30, SD = 1.25; t19 = 0.61, P = 0.55). As expected, overall response time during Go trials was slower during the NoGo blocks (M = 459.45 ms, SD = 138.21) than Go blocks (M = 536.55 ms, SD = 119.44; F1,19 = 35.71, P < 0.001), suggesting that participants’ responses may have been more cautious during the NoGo blocks. However, overall response time did not differ between the groups (ASD: M = 520.55 ms, SD: 147.69; Control: M = 473.20 ms, SD = 105.94; F1,19 = 0.73, P = 0.44), and the effect of Block type on response time did not differ between groups (ASD: Go M = 488.91 ms, SD = 160.62, NoGo M = 552.18 ms, SD = 134.77; Control: Go M = 427.05 ms, SD = 107.49, NoGo M = 519.35 ms, SD = 104.39; F1,19 = 1.24, P = 0.28).
Additionally, the ASD group had a significant positive relationship between age and errors of commission (r = 0.71, P < 0.05), but there was no significant relationship in the Control group (r = −0.12, P = 0.74), and the difference between the correlations was significant, zr1r2 = 2.12, P < 0.05. Thus, although performance on the Go/NoGo task did not differ between ASD and Control groups, there was a significant relationship between age and the ASD group's performance not seen in the Control group. To address concerns that this age by performance correlation in the ASD group may be driven by a difference in cognitive functioning within the ASD group, we conducted a split half analysis on FSIQ and the Attention subscale from the BASC. One child in the ASD group did not have BASC data. There were no significant differences between younger (8- to 10-year-old children: FSIQ mean standard score = 107.33; Attention subscale mean T score = 64.20) and older (11- to 12-year-old children: FSIQ mean standard score = 119.33; Attention subscale mean T score = 62.50) in the ASD group (FSIQ: t10 = 1.23, P = 0.25; Attention subscale: t9 = 0.31, P = 0.77).
fcMRI Results: Group Differences
Diagnostic groups did not differ in overall functional connectivity across correlation pairs between the left IFC seed region and all other ROIs (F1,22 = 0.00, P = 0.99) (see Fig. 2a). Furthermore, when we included age or FSIQ as covariates the connectivity between the left IFC seed region and all other ROIs still did not differ between diagnostic groups (Age: F1,21 = 0.09, P = 0.76; FSIQ: F1,21 = 0.00, P = 0.99).
Figure 2.
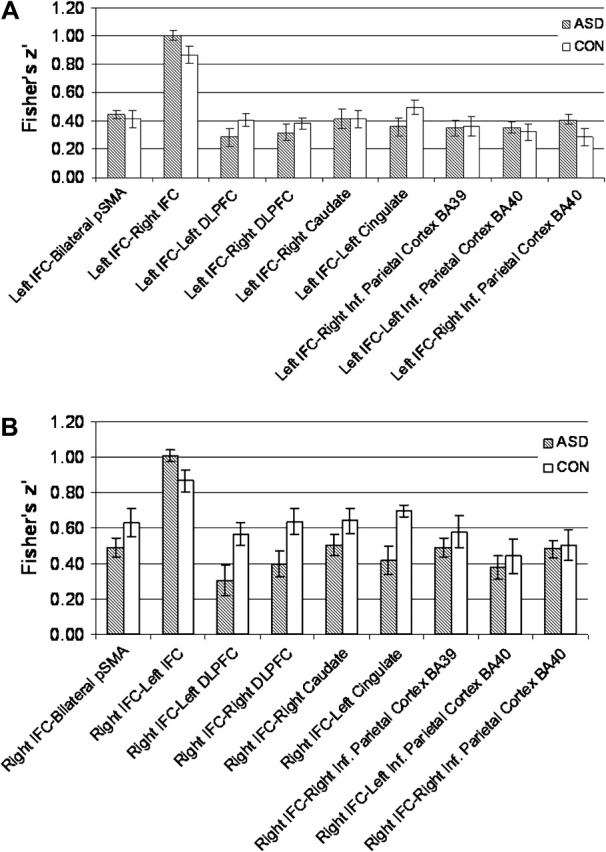
(a)Fisher's z’ transform correlations of the left IFC with all other ROIs. (b) Fisher z’ transform correlations of the right IFC with all other ROIs.
Diagnostic groups did not differ in overall functional connectivity across correlation pairs between the right IFC seed region and all other ROIs (F1,22 = 2.68, P = 0.12) (see Fig. 2b). However, in contrast to the findings in the left IFC, when we included age as a covariate with connectivity in the right IFC, we found a trend toward group differences, with the ASD group showing reduced connectivity compared with the Control group, F1,21 = 3.28, P = 0.08. There was no significant group by ROI interaction for the different right IFC–ROI correlation pairs (F10,12 = 0.79, P = 0.64). Diagnostic groups did not differ in connectivity when FSIQ was included as a covariate, F1,21 = 2.61, P = 0.12.
In order to examine whether the 1 left-handed child in the ASD group unduly influenced the fcMRI results, we reanalyzed our data excluding her. The pattern of results for the combined group map or the fcMRI results did not change when the left-handed child was excluded (data not shown).
fcMRI Results: Correlating Right IFC with Age
To examine further the relationship between functional connectivity and age, the right IFC pairs were entered into a correlation analysis. This analysis yielded significant negative relationships between age and 2 correlation pairs in the ASD group but none in the Control group. Diagnostic groups differed in the correlations between age and the 2 correlation pairs of 1) right IFC and bilateral pSMA (zr1r2 = 2.59, P < 0.01; ASD: r = −0.76, P < 0.005; Control: r = 0.22, P = 0.49) and 2) right IFC and right caudate (zr1r2 = 2.03, P < 0.05; ASD: r = −0.70, P < 0.05; Control: r = 0.09, P = 0.79), with the ASD but not the Control group demonstrating significant negative relationships (see Fig. 3a,b). Although it may appear that an outlier in Figure 3b is significantly influencing results, the removal of the outlier does not affect the results (zr1r2 = 2.27, P < 0.05; ASD: r = −0.75, P < 0.05). The remaining correlations were not significant for either group (Ps > 0.05). We probed whether the diagnostic groups differed in the number of participants at each age by conducting a diagnostic group (ASD, Control) by age (8, 9, 10, 11 12 years old) χ2. The age distribution did not differ between groups (χ2(1, N = 24) = 2.95, P = 0.57), which confirms that our age by correlation pair findings (e.g., age by right IFC right caudate) are not driven by a systematic difference in the ages of our diagnostic groups. To address whether the age-related correlations were driven by the age-related behavioral findings, accuracy data were entered as a covariate on a trial by trial basis for the ASD group. The pattern of results did not change (see Supplementary Materials).
Figure 3.
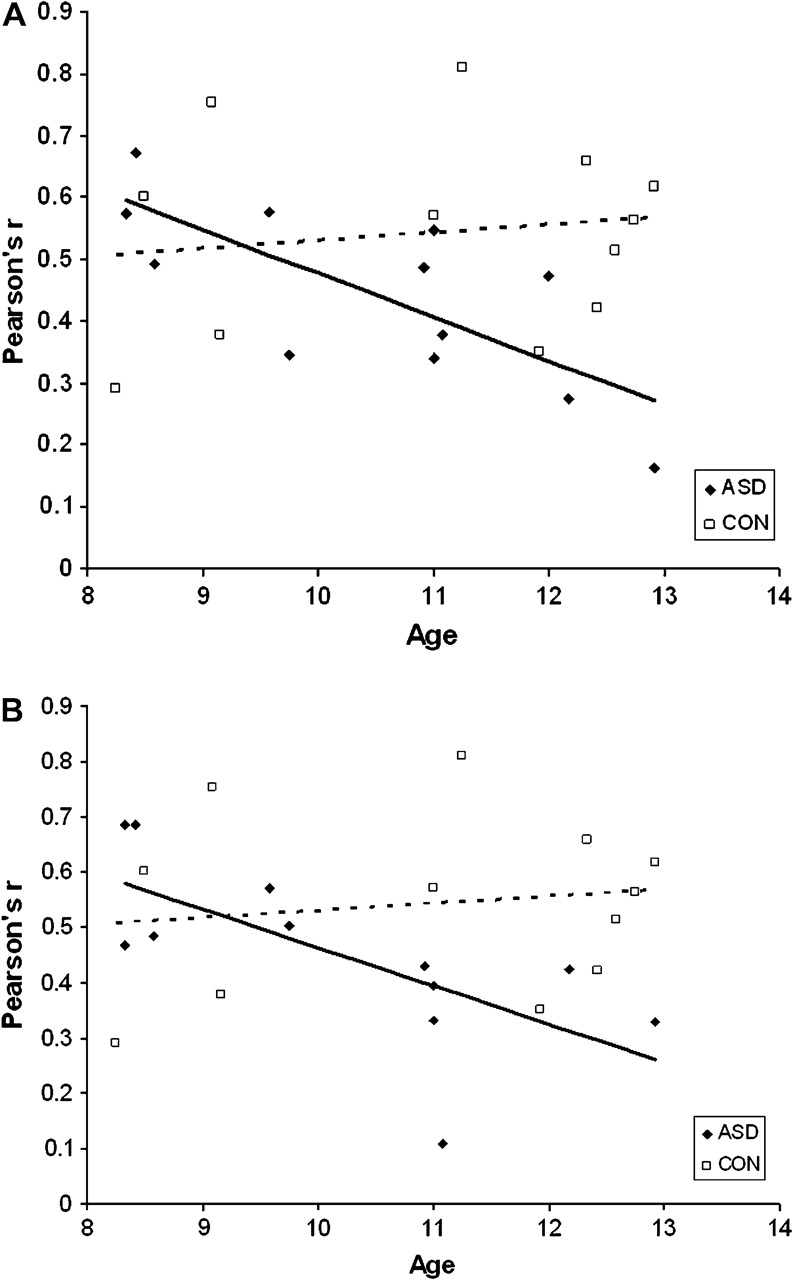
(a) Relationship of age to right IFC–bilateral pSMA correlation (Pearson's r). (b) Relationship of age to right IFC–right caudate correlation (Pearson's r).
fcMRI Results: Correlating Right IFC with ADI-R Scores
To examine the relationship between ASD symptoms and connectivity, we correlated the ADI-R with each ROI pair. This analysis yielded significant negative relationships between ADI-R Social domain and 2 correlation pairs in the ASD group: 1) ADI-R Social and right IFC and pSMA (Spearman's rho = −0.61, P < 0.05) and 2) ADI-R Social and left IFC and pSMA (Spearman's rho = −0.65, P < 0.05). All other correlations with all other ADI-R domains were nonsignificant (Ps > 0.20).
Discussion
This study probed the functional connectivity of motor response inhibition in children with and without ASD. In contrast to adult findings, the functional connectivity of response inhibition in children with ASD did not differ for the left or right IFC in comparison to matched controls. Furthermore, when accounting for FSIQ, we did not find group differences in functional connectivity. However, when accounting for age, we found evidence for reduced functional connectivity in the ASD group compared with controls for the right, but not the left, IFC. Functional connectivity decreased with age selectively for the ASD group, in particular, between the right IFC and motor planning regions (caudate and pSMA). This age-related finding in functional connectivity was not driven by differences in age or FSIQ between younger and older children in the ASD group. Furthermore, this age-related change in functional connectivity had a behavioral correlate such that older children in the ASD, but not the control, group tended to make more response inhibition errors than younger children. However, this behavioral correlate did not explain the age-related change in the functional connectivity pairings because the age by connectivity pair correlations remained significant when accuracy was partialled out of the relationship. Finally, the functional connectivity of the pSMA to the left and to the right IFC was negatively correlated with social symptoms as reported on the ADI-R.
The current findings have several implications for our understanding of the functional anatomy of ASD. First, lack of group differences in functional connectivity in the present study were observed for regions in which magnitude of activation differed marginally (e.g., pSMA; BA 6) and did not differ (e.g., left DLPFC; BA 46) between groups. This observation clarifies notions about functional connectivity in ASD to some extent. Specifically, in past studies, regions showing group differences in functional connectivity also differed in magnitude of activation between groups (Castelli et al. 2002; Just et al. 2004, 2007; Koshino et al. 2005, 2008; Villalobos et al. 2005; Kana et al. 2006, 2007; Mason et al. 2008). A difference in the magnitude of activation between 2 groups may bias connectivity results toward finding group differences (Müller 2007). Although activation differences are often inevitable when comparing disordered with typically developing populations, we attempted to control for this issue by selecting ROIs equivalently activated in ASD and control children. Although 2 of the 9 regions included in the analysis were marginally different (pSMA and right DLPFC), groups did not differ in overall functional connectivity.
Second, our finding that functional connectivity changes selectively for right frontal and right frontostriatal regions across age highlights the importance of studying functional connectivity as a developmental phenomenon. Previous structural investigations using DTI techniques have generally reported decreased white matter in the corpus callosum and other white matter tracts in children and adolescents with ASD (Barnea-Goraly et al. 2004; Alexander et al. 2007; Keller et al. 2007; Sundram et al. 2008; but see Ben Bashat et al. 2007). The implications of these DTI findings are complicated by small sample size, lack of cognitive characterization, and/or variability in sample characteristics (e.g., combining low- and high-functioning children or children and adults into one group). To the best of our knowledge, the current investigation is the first to examine functional connectivity in a well characterized, exclusively high-functioning pediatric population of ASD, and our findings suggest that age may play a role in the synchronization of frontal and frontal-striatal brain regions supporting response inhibition.
In addition, there was a developmental trend in the behavioral data. Our finding of reduced response inhibition with increasing age, however, is inconsistent with past cross-sectional studies documenting improved inhibition with development of the prefrontal cortex in typical individuals (Bunge et al. 2002; Durston, Thomas, Yang, et al. 2002). Thus, regression of response inhibition with age in ASD in the present study suggests either an anomalous developmental trajectory or a progressive deterioration of prefrontal cortex during late childhood. The results from the current investigation, however, could not distinguish between these 2 possibilities. This age observation may also relate to neuropsychological hypotheses suggesting that cognitive deficits are more visible at later ages in ASD (Griffith et al. 1999; Dawson et al. 2002; Yerys et al. 2007).
Third, our selective age-related findings within frontal and frontal-striatal regions also provide preliminary evidence of atypical development in the functional connectivity of proximal frontal network regions. Whereas past functional connectivity research emphasizes distal frontoparietal disruptions in ASD (Cherkassky et al. 2006; Just et al. 2004, 2007; Koshino et al. 2005, 2008; Kana et al. 2006, 2007; Mason et al. 2008), the present study's findings align with recent DTI evidence suggesting that local U-fibers connecting regions within the frontal lobes are more disrupted in children with ASD than long-range connections to posterior regions such as the superior and inferior parietal lobules (Sundram et al. 2008). Past studies in typically developing children characterize the 8- to 12-year-age range as a period of considerable development for the prefrontal cortex, including rapid increases in white matter and decreases in gray matter (Giedd et al. 1996, 1999; Paus et al. 1999; Gogtay et al. 2004). Therefore, assessing functional connectivity of frontal and frontal-striatal networks while participants are actively engaged in tasks drawing upon those regions, such as response inhibition, may be particularly useful for detecting subtle developmental changes. More definitive evidence will come from longitudinal investigations studying the developmental trajectory of short-range cortico-subcortical connections in the frontal lobe (for a study on adults with ASD, see Turner et al. 2006).
Fourth, the selective functional connectivity changes across age were associated with right IFC but not left IFC. This converges with past evidence implicating an increasingly specified role for the right IFC in response inhibition across development (Bunge et al. 2002; Aron and Poldrack 2005; Rubia et al. 2006). A normative cross-sectional study of children (8–12 years old) and adults demonstrated a shift from left IFC activation during successful response inhibition performance for children to right IFC activation for adults (Bunge et al. 2002).
The above findings are consistent with some aspects of the underconnectivity hypothesis in ASD. The underconnectivity hypothesis states that reduced interarea communication in individuals with ASD contributes to social and nonsocial phenotypic behaviors (Just et al. 2004, 2007; Koshino et al. 2005, 2008; Kana et al. 2006; Mason et al. 2008; but see Turner et al. 2006; Müller 2007). The negative correlation between autism symptoms and the functional connectivity of the pSMA with both IFC seeds links poorer functional connectivity with an increase in core ASD symptoms. There was not a significant relationship between age and the Social domain symptoms (data not shown). Although this finding supports the underconnectivity hypothesis, the exploratory nature of this analysis requires confirmation in other datasets.
Whereas several studies have reported reduced functional connectivity in adults with ASD, the current study is not the first to report null findings in functional connectivity analyses (Welchew et al. 2005; Mizuno et al. 2006; Turner et al. 2006; Kennedy and Courchesne 2008). As mentioned earlier, the preliminary DTI study of preschoolers with ASD revealed increased white matter in the prefrontal cortex, and this also argues against the underconnectivity hypothesis (Ben Bashat et al. 2007). One interpretation of our age-related findings within the underconnectivity theory is that reductions emerge across development in line with developmental changes to the prefrontal cortex. However, the fact that age-related changes only occurred in select pairings argues against this interpretation. An alternative interpretation could argue for progressive deterioration of connectivity from childhood into adulthood. However, this hypothesis seems unlikely as volumetric and white matter integrity abnormalities have been reported throughout childhood (Herbert et al. 2003, 2004; Barnea-Goraly et al. 2004; Alexander et al. 2007; Ben Bashat et al. 2007; Keller et al. 2007; Sundram et al. 2008). The age-related findings reported in the present study suggest that the underconnectivity hypothesis requires additional testing in large pediatric populations to determine whether functional and structural connectivity is abnormal at early ages (0–3 years old) when social and cognitive symptoms are already prominent, unfolds later in childhood, or is a progressive deterioration.
Although the present findings point to the importance of examining functional anatomy in ASD in a developmental context, a number of limiting factors should be noted. Small sample size may have limited our ability to identify differences in activation of specific regions of the brain between the 2 groups; however, our sample size was adequate to detect a linear relationship with age and it was similar to sample sizes in past studies showing atypical functional connectivity between groups (Villalobos et al. 2005; Kana et al. 2006, 2007; Turner et al. 2006; Mizuno et al. 2006). The present study did not systematically manipulate age, and therefore, whether the age-related findings characterize ASD in general or our sample in particular needs to be resolved in future studies. The present study also differed from the previous adult fcMRI investigation of response inhibition in ASD because the adult study included a modified Go/NoGo block with high working memory demands that only affected their ASD group's performance. Therefore, reduced functional connectivity in adults with ASD could result from the increased working memory demands in their “1-back” inhibition task rather than response inhibition (Koshino et al. 2005, 2008 demonstrated reduced functional connectivity in an ASD group during working memory tasks). Finally, the current investigation recruited high-functioning children with a mean FSIQ in the High Average range, and the results reported in this investigation may not apply to low-functioning children with ASD.
There are also general limitations related to the fcMRI method used in the current study. First, the fcMRI method cannot provide information on the direction or structural nature of the connectivity—that is, the linkage may not be direct (monosynaptic). Second, the present study's functional connectivity method differs from resting state methods (Friston 1994; Greicius et al. 2008; for review, see Fox and Raichle 2007), primarily because the data were influenced by task-related activity. Thus, this analysis is confined to the connectivity of IFC and brain regions specifically supporting response inhibition and may not speak to the broader functional connectivity of the IFC.
To confirm the current interpretation that connectivity decreases across age in ASD, future investigations should examine connectivity longitudinally on the same response inhibition task. Furthermore, the age-related findings reported here require future study to determine if they are characteristic of ASD or specific to the current high-functioning sample and cognitive process. Future studies of functional connectivity should recruit a large sample, tightly controlled for age, and probe connectivity of multiple cognitive processes as well as employ other imaging methodologies, such as DTI, to investigate correspondence between functional connectivity and structural development.
Supplementary Material
Supplementary material can be found at: http://www.cercor.oxfordjournals.org/.
Funding
Frederick and Elizabeth Singer Foundation and the Studies for the Advancement of Autism Research and Treatment (STAART: NIMH U54 MH066417); Intellectual and Developmental Disabilities Research Center at Children's National Medical Center (NIH IDDRC P30HD40677); the General Clinic Research Center (NIH GCRC M01-RR13297); and T-32 post-doctoral to B.E.Y. through the IDDRC (NIH T32HD046388).
Acknowledgments
We thank the children and families that offered their time and energy for the current study. We thank Banke Adeyemo, Jessica Ehrlich, Leah Mozier, and Kathryn F. Jankowski for their efforts in data collection and analysis. Conflict of Interest: None declared.
References
- Alexander AL, Lee JE, Lazar M, Boudos R, DuBray MB, Oakes TR, Miller JN, Lu J, Jeong E-K, McMahon WM, et al. Diffusion tensor imaging of the corpus callosum in autism. Neuroimage. 2007;34:61–73. doi: 10.1016/j.neuroimage.2006.08.032. [DOI] [PubMed] [Google Scholar]
- Aron AR, Behrens TE, Smith S, Frank MJ, Poldrack RA. Triangulating a cognitive control network using diffusion-weighted magnetic resonance imaging and functional MRI. J Neurosci. 2007;27:3743–3752. doi: 10.1523/JNEUROSCI.0519-07.2007. [DOI] [PMC free article] [PubMed] [Google Scholar]
- Aron AR, Dowson J, Sahakian BJ, Robbins TW. Stop-signal inhibition disrupted by damage to right inferior frontal gyrus in humans. Nat Neurosci. 2003;6:115–116. doi: 10.1038/nn1003. [DOI] [PubMed] [Google Scholar]
- Aron AR, Poldrack RA. The cognitive neuroscience of response inhibition: relevance for genetic research in attention-deficit/hyperactivity disorder. Biol Psychiatry. 2005;57:1285–1292. doi: 10.1016/j.biopsych.2004.10.026. [DOI] [PubMed] [Google Scholar]
- Aron AR, Poldrack RA. Cortical and subcortical contributions to stop signal response inhibition: role of the subthalamic nucleus. J Neurosci. 2006;26:2424–2433. doi: 10.1523/JNEUROSCI.4682-05.2006. [DOI] [PMC free article] [PubMed] [Google Scholar]
- Barnea-Goraly N, Kown H, Menon V, Eliez S, Lotspeich L, Reiss AL. White matter structure in autism: preliminary evidence from diffusion tensor imaging. Biol Psychiatry. 2004;55:323–326. doi: 10.1016/j.biopsych.2003.10.022. [DOI] [PubMed] [Google Scholar]
- Belmonte MK, Allen G, Beckel-Mitchener A, Boulanger LM, Carper RA, Webb SJ. Autism and abnormal development of brain connectivity. J Neurosci. 2004;24:9228–9231. doi: 10.1523/JNEUROSCI.3340-04.2004. [DOI] [PMC free article] [PubMed] [Google Scholar]
- Ben Bashat D, Kronfeld-Duenias V, Zachor DA, Ekstein PM, Hendler T, Tarrasch R, Even A, Levy Y, Ben Sira L. Accelerated maturation of white matter in young children with autism: a high b value DWI study. Neuroimage. 2007;37:40–47. doi: 10.1016/j.neuroimage.2007.04.060. [DOI] [PubMed] [Google Scholar]
- Berl MM, Vaidya CJ, Gaillard WD. Functional imaging of developmental and adaptive changes in neurocognition. Neuroimage. 2006;30:679–691. doi: 10.1016/j.neuroimage.2005.10.007. [DOI] [PubMed] [Google Scholar]
- Brett M, Anton J, Valabregue R, Poline J. Region of interest analysis using an SPM toolbox. Neuroimage. 2002;16:S497. [Google Scholar]
- Booth JR, Burman DD, Meyer JR, Lei Z, Trommer BL, Davenport ND, Li W, Parrish TB, Gitelman DR, Mesulam M-M. Larger deficits in brain networks for response inhibition than for visual selective attention in attention deficit hyperactivity disorder (ADHD) J Child Psychol Pscyhiatry. 2005;46:94–111. doi: 10.1111/j.1469-7610.2004.00337.x. [DOI] [PubMed] [Google Scholar]
- Bunge SA, Dudukovic NM, Thomason ME, Vaidya CJ, Gabrieli JD. Immature frontal lobe contributions to cognitive control in children: evidence from fMRI. Neuron. 2002;33:301–311. doi: 10.1016/s0896-6273(01)00583-9. [DOI] [PMC free article] [PubMed] [Google Scholar]
- Casey BJ, Durston S, Fossella JA. Evidence for a mechanistic model of cognitive control. Clin Neurosci Res. 2001;1:267–282. [Google Scholar]
- Castelli F, Frith C, Happé F, Frith U. Autism, asperger syndrome and brain mechanisms for the attribution of mental states to animated shapes. Brain. 2002;125:1839–1849. doi: 10.1093/brain/awf189. [DOI] [PubMed] [Google Scholar]
- Cherkassky VL, Kana RK, Keller TA, Just MA. Functional connectivity in a baseline resting-state network in autism. Neuroreport. 2006;17:1687–1690. doi: 10.1097/01.wnr.0000239956.45448.4c. [DOI] [PubMed] [Google Scholar]
- Christ SE, Holt DD, White DA, Green L. Inhibitory control in children with autism spectrum disorders. J Autism Dev Disord. 2006;37:1155–1165. doi: 10.1007/s10803-006-0259-y. [DOI] [PubMed] [Google Scholar]
- Courchesne E, Pierce K, Schumann CM, Recay E, Buckwalter JA, Kennedy DP. Mapping early brain development in autism. Neuron. 2007;56:399–413. doi: 10.1016/j.neuron.2007.10.016. [DOI] [PubMed] [Google Scholar]
- Dawson G, Munson J, Estes A, Osterling J, McPartland J, Toth K, Carver L, Abbott R. Neurocognitive function and joint attention ability in young children with autism spectrum disorder versus developmental delay. Child Dev. 2002;73:345–358. doi: 10.1111/1467-8624.00411. [DOI] [PubMed] [Google Scholar]
- Durston S, Thomas KM, Worden MS, Yang Y, Casey BJ. The effect of preceding context on inhibition: an event-related fMRI study. Neuroimage. 2002;16:449–453. doi: 10.1006/nimg.2002.1074. [DOI] [PubMed] [Google Scholar]
- Durston S, Thomas KM, Yang Y, Uluğ AM, Zimmerman RD, Casey BJ. A neural basis for the development of inhibitory control. Dev Sci. 2002;5:F9–F16. [Google Scholar]
- Friston KJ. Functional and effective connectivity in neuroimaging: a synthesis. Hum Brain Mapp. 1994;2:56–78. [Google Scholar]
- Fox MD, Raichle ME. Spontaneous fluctuations in brain activity observed with functional magnetic resonance imaging. Nat Rev Neurosci. 2007;8:700–711. doi: 10.1038/nrn2201. [DOI] [PubMed] [Google Scholar]
- Geurts HM, Verté S, Oosterlaan J, Roeyers H, Sergeant JA. How specific are executive function deficits in attention deficit hyperactivity disorder and autism? J Child Psychol Psychiatry. 2004;45:836–854. doi: 10.1111/j.1469-7610.2004.00276.x. [DOI] [PubMed] [Google Scholar]
- Giedd JN, Blumenthal J, Jeffries NO, Castellanos FX, Liu H, Zijdenbos A, Paus T, Evans AC, Rapoport JL. Brain development during childhood and adolescence: a longitudinal MRI study. Nat Neurosci. 1999;2:861–863. doi: 10.1038/13158. [DOI] [PubMed] [Google Scholar]
- Giedd JN, Rumsey JM, Castellanos FX, Rajapakse JC, Kaysen D, Vaituzis AC, Vauss YC, Hamburger SD, Rapoport JL. A quantitative MRI study of the corpus callosum in children and adolescents. Dev Brain Res. 1996;91:274–280. doi: 10.1016/0165-3806(95)00193-x. [DOI] [PubMed] [Google Scholar]
- Gogtay N, Giedd JN, Lusk L, Hayashi KM, Greenstein D, Vaituzis AC, Nugent TF, III, Herman DH, Clasen LS, Toga AW, et al. Dynamic mapping of human cortical development during childhood through early adulthood. Proc Natl Acad Sci USA. 2004;101:8174–8179. doi: 10.1073/pnas.0402680101. [DOI] [PMC free article] [PubMed] [Google Scholar]
- Greicius MD, Supekar K, Menon V, Dougherty RF. Resting-state functional connectivity reflects structural connectivity in the default mode network. Cereb Cortex. 2008 doi: 10.1093/cercor/bhn059. doi:10.1093/cercor/bhn059. [DOI] [PMC free article] [PubMed] [Google Scholar]
- Griffith EM, Pennington BF, Wehner EA, Rogers SJ. Executive function in young children with autism. Child Dev. 1999;70:817–832. doi: 10.1111/1467-8624.00059. [DOI] [PubMed] [Google Scholar]
- Happé F, Booth R, Charlton R, Hughes C. Executive function deficits in autism spectrum disorders and attention-deficit/hyperactivity disorder: examining profiles across domains and ages. Brain Cogn. 2006;61:25–39. doi: 10.1016/j.bandc.2006.03.004. [DOI] [PubMed] [Google Scholar]
- Herbert MR, Ziegler A, Deutsch CK, O'Brien LM, Lange N, Bakardjiev A, Hodgson J, Adrien KT, Steele S, Kennedy MD, et al. Dissociations of cerebral cortex, subcortical, and cerebral white matter volumes in autistic boys. Brain. 2003;126:1182–1192. doi: 10.1093/brain/awg110. [DOI] [PubMed] [Google Scholar]
- Herbert MR, Ziegler A, Makris N, Filipek PA, Kemper TL, Normandin JJ, Sanders HA, Kennedy DN, Caviness VS., Jr Localization of white matter volume increase in autism and developmental language disorder. Ann Neurol. 2003;55:530–540. doi: 10.1002/ana.20032. [DOI] [PubMed] [Google Scholar]
- Just MA, Cherkassky VL, Kana RK, Minshew NJ. Functional and anatomical cortical underconnectivity in autism: evidence from an fMRI study of an executive function task and corpus callosum morphometry. Cereb Cort. 2007;17:951–961. doi: 10.1093/cercor/bhl006. [DOI] [PMC free article] [PubMed] [Google Scholar]
- Just MA, Cherkassky VL, Keller TA, Minshew NJ. Cortical activation and synchronization during sentence comprehension in high functioning autism: evidence of underconnectivity. Brain. 2004;127:1811–1821. doi: 10.1093/brain/awh199. [DOI] [PubMed] [Google Scholar]
- Kana RK, Keller TA, Cherkassky VL, Minshew NJ, Just MA. Sentence comprehension in autism: thinking in pictures with decreased functional connectivity. Brain. 2006;129:2484–2493. doi: 10.1093/brain/awl164. [DOI] [PMC free article] [PubMed] [Google Scholar]
- Kana RK, Keller TA, Minshew NJ, Just MA. Inhibitory control in high-functioning autism: decreased activation and underconnectivity in inhibition networks. Biol Psychiatry. 2007;62:198–206. doi: 10.1016/j.biopsych.2006.08.004. [DOI] [PMC free article] [PubMed] [Google Scholar]
- Keller TA, Kana RK, Just MA. A developmental study of the structural integrity of white matter in autism. Neuroreport. 2007;18:23–27. doi: 10.1097/01.wnr.0000239965.21685.99. [DOI] [PubMed] [Google Scholar]
- Kennedy DP, Courchesne E. The intrinsic functional organization of the brain is altered in autism. Neuroimage. 2008;39:1877–1885. doi: 10.1016/j.neuroimage.2007.10.052. [DOI] [PubMed] [Google Scholar]
- Koshino H, Carpenter PA, Minshew NJ, Cherkassky VL, Keller TA, Just MA. Functional connectivity in an fMRI working memory task in high-functioning autism. Neuroimage. 2005;24:810–821. doi: 10.1016/j.neuroimage.2004.09.028. [DOI] [PubMed] [Google Scholar]
- Koshino H, Kana RK, Keller TA, Cherkassky VL, Minshew NJ, Just MA. fMRI investigation of working memory for faces in autism: visual coding and underconnectivity with frontal areas. Cereb Cortex. 2008;18:290–300. doi: 10.1093/cercor/bhm054. [DOI] [PMC free article] [PubMed] [Google Scholar]
- Lord C, Risi S, Lambrecht L, Cook EH, Jr, Leventhal BL, DiLavore PC, Pickles A, Rutter M. The autism diagnostic observation schedule-generic: a standard measure of social and communication deficits associated with the spectrum of autism. J Autism Dev Disord. 2000;30:205–223. [PubMed] [Google Scholar]
- Lord C, Rutter M, Le Couteur A. Autism Diagnostic Interview-Revised: a revised version of a diagnostic interview for caregivers of individuals with possible pervasive developmental disorders. J Autism Dev Disord. 1994;24:659–685. doi: 10.1007/BF02172145. [DOI] [PubMed] [Google Scholar]
- Luna B, Doll SK, Hegedus SJ, Minshew NJ, Sweeney JA. Maturation of executive function in autism. Biol Psychiatry. 2007;61:474–481. doi: 10.1016/j.biopsych.2006.02.030. [DOI] [PubMed] [Google Scholar]
- Mason RA, Williams DL, Kana RK, Minshew NJ, Just MA. Theory of mind disruption and recruitment of the right hemisphere during narrative comprehension in autism. Neuropsychologia. 2008;46:269–280. doi: 10.1016/j.neuropsychologia.2007.07.018. [DOI] [PMC free article] [PubMed] [Google Scholar]
- Mesulam MM. The human frontal lobes: transcending the default mode through contingent encoding. In: Stuss DT, Knight RT, editors. Principles of frontal lobe function. Oxford: Oxford University Press; 2002. [Google Scholar]
- Mizuno A, Villalobos ME, Davies MM, Dahl BC, Müller RA. Partially enhanced thalamocortical functional connectivity in autism. Brain Res. 2006;1104:160–174. doi: 10.1016/j.brainres.2006.05.064. [DOI] [PubMed] [Google Scholar]
- Müller RA. The study of autism as a distributed disorder. Ment Retard Dev Disabil Res Rev. 2007;13:85–95. doi: 10.1002/mrdd.20141. [DOI] [PMC free article] [PubMed] [Google Scholar]
- Müller R-A, Kleinhans N, Kemmotsu N, Pierce K, Courchesne E. Abnormal variability and distribution of functional maps in autism: an fMRI study of visuomotor learning. Am J Psychiatry. 2003;160:1847–1862. doi: 10.1176/appi.ajp.160.10.1847. [DOI] [PubMed] [Google Scholar]
- Oldfield RC. The assessment and analysis of handedness: the Edinburgh inventory. Neuropsychologia. 1971;9:97–113. doi: 10.1016/0028-3932(71)90067-4. [DOI] [PubMed] [Google Scholar]
- Ozonoff S, Strayer DL. Inhibitory function in non-retarded children with autism. J Autism Dev Disord. 1997;27:59–77. doi: 10.1023/a:1025821222046. [DOI] [PubMed] [Google Scholar]
- Ozonoff S, Strayer DL, McMahon WN, Filloux F. Executive function abilities in autism and tourette syndrome: an information processing approach. J Child Psychol Psychiatry. 1994;35:1015–1032. doi: 10.1111/j.1469-7610.1994.tb01807.x. [DOI] [PubMed] [Google Scholar]
- Paus T, Zijdenbos A, Worsley K, Collins DL, Blumenthal J, Giedd JN, Rapoport JL, Evans AC. Structural maturation of neural pathways in children and adolescents: in vivo study. Sci. 1999;283:1908–1911. doi: 10.1126/science.283.5409.1908. [DOI] [PubMed] [Google Scholar]
- Reynolds CR, Kamphaus RW, editors. Behavior Assessment System for Children. Circle Pines (MN): American Guidance Service; 1998. [Google Scholar]
- Rogers BP, Morgan VL, Newton AT, Gore AC. Assessing functional connectivity in the human brain by fMRI. Magn Reson Imaging. 2007;25:1347–1357. doi: 10.1016/j.mri.2007.03.007. [DOI] [PMC free article] [PubMed] [Google Scholar]
- Rubia K, Russell T, Overmeyer S, Brammer MJ, Bullmore ET, Sharma T, Simmons A, Williams SCR, Giampietro V, Andrew CM, et al. Mapping motor inhibition: conjunctive brain activations across different versions of go/nogo and stop tasks. Neuroimage. 2001;13:250–261. doi: 10.1006/nimg.2000.0685. [DOI] [PubMed] [Google Scholar]
- Rubia K, Smith AB, Woolley J, Nosarti C, Heyman I, Taylor E, Brammer M. Progressive increase of fronto-striatal brain activation from childhood to adulthood during event related tasks of cognitive control. Hum Brain Mapp. 2006;27:973–993. doi: 10.1002/hbm.20237. [DOI] [PMC free article] [PubMed] [Google Scholar]
- Rushworth MFS, Walton ME, Kennerly SW, Bannerman DM. Action sets and decisions in the medial frontal cortex. Trends Cogn Sci. 2004;8:410–417. doi: 10.1016/j.tics.2004.07.009. [DOI] [PubMed] [Google Scholar]
- Schmitz N, Rubia K, Daly E, Smith A, Williams S, Murphy DG. Neural correlates of executive function in autistic spectrum disorders. Biol Psychiatry. 2006;59:7–16. doi: 10.1016/j.biopsych.2005.06.007. [DOI] [PubMed] [Google Scholar]
- Stevens MC, Kiehl KA, Pearlson GD, Calhoun VD. Functional neural networks underlying response inhibition in adolescents and adults. Behav Brain Res. 2007;181:12–22. doi: 10.1016/j.bbr.2007.03.023. [DOI] [PMC free article] [PubMed] [Google Scholar]
- Sundram SK, Kumar A, Makki MI, Behen ME, Chugani HT, Chugani DC. Diffusion tensor imaging of frontal lobe in autism spectrum disorder. Cereb Cortex. 2008;18:2659–2665. doi: 10.1093/cercor/bhn031. [DOI] [PMC free article] [PubMed] [Google Scholar]
- Tamm L, Menon V, Reiss AL. Parietal attentional system aberrations during target detection in adolescents with attention deficit hyperactivity disorder: event-related fMRI evidence. Am J Psychiatry. 2002;163:1033–1043. doi: 10.1176/ajp.2006.163.6.1033. [DOI] [PubMed] [Google Scholar]
- Turner KC, Frost L, Linsenbardt D, McIlroy JR, Müller RA. Atypically diffuse functional connectivity between caudate nuclei and cerebral cortex in autism. Behav Brain Funct. 2006;2:34. doi: 10.1186/1744-9081-2-34. [DOI] [PMC free article] [PubMed] [Google Scholar]
- Vaidya CJ, Bunge SA, Dudukovic NM, Zalecki CA, Elliott GR, Gabrieli JD. Altered neural substrates of cognitive control in childhood ADHD: evidence from functional magnetic resonance imaging. Am J Psychiatry. 2005;162:1605–1613. doi: 10.1176/appi.ajp.162.9.1605. [DOI] [PMC free article] [PubMed] [Google Scholar]
- Villalobos ME, Mizuno A, Dahl BC, Kemmotsu N, Müller RA. Reduced functional connectivity between V1 and inferior frontal cortex associated with visuomotor performance in autism. Neuroimage. 2005;25:916–925. doi: 10.1016/j.neuroimage.2004.12.022. [DOI] [PMC free article] [PubMed] [Google Scholar]
- Wager TD, Sylvester CY, Lacey SC, Nee DE, Franklin M, Jonides J. Common and unique components of response inhibition. Neuroimage. 2005;27:323–340. doi: 10.1016/j.neuroimage.2005.01.054. [DOI] [PubMed] [Google Scholar]
- Welchew DE, Ashwin C, Berkouk K, Salvador R, Suckling J, Baron-Cohen S, Bullmore E. Functional disconnectivity of the medial temporal lobe in asperger's syndrome. Biol Psychiatry. 2005;57:991–998. doi: 10.1016/j.biopsych.2005.01.028. [DOI] [PubMed] [Google Scholar]
- Yerys BE, Hepburn SL, Pennington BF, Rogers SJ. Executive function in preschoolers with autism: evidence consistent with a secondary deficit. J Autism Dev Disord. 2007;37:1068–1079. doi: 10.1007/s10803-006-0250-7. [DOI] [PMC free article] [PubMed] [Google Scholar]
Associated Data
This section collects any data citations, data availability statements, or supplementary materials included in this article.