

Abstract
In primates, a split of the horizontal meridian (HM) representation at the V2 rostral border divides this area into dorsal (V2d) and ventral (V2v) halves (representing lower and upper visual quadrants, respectively), causing retinotopically neighboring loci across the HM to be distant within V2. How is perceptual continuity maintained across this discontinuous HM representation? Injections of neuroanatomical tracers in marmoset V2d demonstrated that cells near the V2d rostral border can maintain retinotopic continuity within their classical and extra-classical receptive field (RF), by making both local and long-range intra- and interareal connections with ventral cortex representing the upper visual quadrant. V2d neurons located <0.9–1.3 mm from the V2d rostral border, whose RFs presumably do not cross the HM, make nonretinotopic horizontal connections with V2v neurons in the supra- and infragranular layers. V2d neurons located <0.6–0.9 mm from the border, whose RFs presumably cross the HM, in addition make retinotopic local connections with V2v neurons in layer 4. V2d neurons also make interareal connections with upper visual field regions of extrastriate cortex, but not of MT or MTc outside the foveal representation. Labeled connections in ventral cortex appear to represent the “missing” portion of the connectional fields in V2d across the HM. We conclude that connections between dorsal and ventral cortex can create visual field continuity within a second-order discontinuous visual topography.
Keywords: feedback connections, horizontal connections, marmoset, retinotopy, short-range connections, surround
Introduction
In the primate visual cortex, the cortical representation of visual field loci across the vertical meridian (VM) is split between the 2 hemispheres. In several extrastriate areas, such as V2, but not in V1 or MT, the representation of visuotopically neighboring loci across the horizontal meridian (HM) is also split, but within the same hemisphere. This is due to a split of the HM representation at the fovea, which, in the case of area V2, divides this area into dorsal (V2d) and ventral (V2v) halves, representing the lower and upper visual field, respectively (Figs 1 and 2). As a result, the HM is represented both at the rostral V2d and V2v borders (macaque: Cragg 1969; Zeki 1977; Gattass et al. 1981; new world primates: Spatz et al. 1970; Allman and Kaas 1971, 1974; Rosa et al. 1997).
Figure 1.

Alternative hypotheses for connectivity at/near the HM representation of area V2. Left panels in (a–c): diagrams of the central 8° of the right visual hemifield. Here and in all remaining figures, the star marks the location of the fovea, (+) (−) indicate the upper and lower visual quadrants, respectively, the dashed horizontal line is the HM, the solid vertical line is the VM, the dotted contours are the iso-eccentricity lines whose eccentricity is indicated. Right panels in (a–c): representations of the right upper and lower visual quadrants onto an outline of unfolded and flattened marmoset striate (V1) and extrastriate cortex (V2 and areas rostral to it). The locations of the ±4° and ±8° eccentricity lines (dotted contours) are shown in V2 (modified from Rosa et al. 2005). For sake of illustration, here and in all remaining figures, the flattened right and left hemispheres are both oriented with the posterior pole on the left. The thick dashed contours and solid contours indicate the location of the HM and VM representations, respectively, the star is the representation of the fovea, (+) (−) are the representation of the upper and lower visual quadrants, respectively, the thin dashed outline is the outline of the dorso-lateral surface of visual cortex prior to unfolding, and the thin solid outline is the outline of unfolded medial and ventral cortex. The light gray area rostral to V2d marked as “DM+?” indicates the location of the upper quadrant representation of area DM according to Rosa et al. (2005). This is a region where the existence of an upper or lower visual field representation is still being debated as detailed in Supplementary Figure 1 (Lyon and Kaas 2001; Rosa et al. 2005). (a) Cells with RFs located at/near the rostral V2d border do not make connections with cortical regions in ventral cortex representing the upper visual field. These cells only make local connections (dark gray oval) and long-range intra-areal connections (light gray oval) within V2d, representing the lower visual field. They also make reciprocal connections only with retinotopically matching regions in the lower visual field representation of other cortical areas (black ovals in V1 and MT). The visual field map of these local and horizontal V2 connections is shown on the right visual hemifield (left panel) as half-ovals of matching shades of gray. (b) V2 cells near the rostral V2d border make local connections with visuotopically neighboring cells in the lower and upper visual quadrants, but long-range connections only with regions of lower visual field representation. The visual field map to the left shows retinotopic continuity of the local connections but not of horizontal connections. (c) V2 cells near the rostral V2d border make local and long-range connections with visuotopically matched and mismatched regions in dorsal and ventral cortex. The visual field map to the left shows retinotopic continuity of both local and horizontal connections.
Figure 2.

CO staining of marmoset visual cortex reveals V1, V2, and MT boundaries. Digitized image of unfolded and flattened marmoset visual cortex stained for CO. The image is a merge of 3 sections through different cortical layers. To avoid obscuring the staining pattern, the same image is shown unlabeled in (a) and labeled in (b). (b) The solid contours mark the representation of the VM at the V1/V2 border and at the outer border of MT. The thick dashed contours mark the approximate location of the HM representation at the border between dorsal and ventral V1, V2, and MT. The shaded gray area represents the CO-defined transition zone, which encompasses the most posterior and anterior V2 rostral borders drawn by 3 different subjects only on the basis of CO-staining. The thin dashed outline marks the medial and lateral folds of cortex, respectively. The approximate location of iso-eccentricity lines in V2 and MT is indicated by white dotted contours, and is based on the electrophysiological maps of Rosa et al. (1997, 2005). The black dotted contour marks the border ofDM+ according to Rosa et al. (2005). Other conventions are as in Figure 1.
V2 cells whose receptive fields (RFs) are located away from the meridians make short-range or local intrinsic connections (i.e. within 1 mm of a cell—see Lund et al. 2003) with neighboring cells having overlapping RFs, as well as long-range patchy horizontal connections (i.e. extending >1 mm from the parent pyramidal cell body) with other V2 neurons having retinotopically mismatched RFs (Rockland 1985; Levitt et al. 1994; Malach et al. 1994). V2 cells receive feedforward afferents from V1, and feedback afferents from cortical areas downstream of V2, including areas V3 (or VLP and DM), V4 (or DL/VLA), MT, and MT (e.g. owl monkey: Kaas and Lin 1977; squirrel monkey: Tigges et al. 1981; Cusick and Kaas 1988; macaque: Kennedy and Bullier 1985; Stepniewska and Kaas 1996; Gattas et al. 1997). (Note that different nomenclature and parcellation schemes have been proposed for new world primate extrastriate cortex. In Supplementary Fig. 1, we illustrate 2 different parcellation schemes proposed for the marmoset extrastriate cortex and provide, for comparison, a diagram of macaque monkey extrastriate cortex.) Feedforward and local circuits contribute to the tuning properties of the cortical cells’ classical RF, while horizontal and feedback connections (with a likely contribution of feedforward connections) are thought to underlie the nonclassical surround of cortical neurons (for a review see Angelucci and Bressloff 2006). An important question is how cells whose RFs are located at or near the discontinuous representation of the meridians maintain retinotopic continuity within and outside their classical RF. Although much is known about the topography of connections across the VM, analogous studies of connections at/near the HM are still lacking.
Callosal connections in primate V1 (and in many nonprimate species) are thought to serve the role of local circuits, by relaying information from the ipsilateral visual field to cells whose RFs cross the VM (Myers 1962; Lund et al. 1975; Cusick et al. 1984; Lewis and Olavarria 1995; Olavarria 1996; Bosking et al. 2000). Callosal connections in primate V2 are more extensive than in V1, connecting cells whose RFs are widely displaced across the 2 hemispheres; thus, they are thought to serve the role of both local and horizontal connections elsewhere in V2 (macaque: Myers 1962; Cragg 1969; Zeki 1970; Van Essen and Zeki 1978; Van Essen et al. 1982; Kennedy et al. 1986; Kennedy and Dehay 1988; Abel et al. 2000; new world primates: Cusick et al. 1984; Gould et al. 1987; Cusick and Kaas 1988). Interareal callosal connections have also been described for area V2 (e.g. Kennedy et al. 1986).
No study to date has addressed in a systematic fashion the topography of connections made by neurons with RFs crossing the HM. There have been a few sporadic and inconsistent reports of transported label near the rostral V2v border following injections of anatomical tracers or local heat lesions at the rostral V2d border, just caudal to it, or just rostral to it. However, in most of these previous studies connections between dorsal and ventral V2 were either observed exclusively following tracer injections at the foveal representation of V2 (in squirrel monkey: Cusick and Kaas 1988; in macaque: Stepniewska and Kaas 1996; Felleman et al. 1997; Gattas et al. 1997), or could have arisen from the injection (or lesion) involving the white matter or straddling into the upper visual field representation of cortex rostral to V2 (macaque: Zeki 1971; Felleman et al. 1997; squirrel monkey: Tigges et al. 1974; galago: Collins et al. 2001). Furthermore, no study to date has addressed the issue of whether these connections serve the role of local or long-range circuits elsewhere in V2.
The purpose of the present study was to determine whether cells at/near the HM representation of V2 can maintain retinotopic continuity of their classical and nonclassical RF, by making connections with visuotopically neighboring cells that are physically separated by large cortical distances. Because the HM is known to be represented at the V2 rostral border, we have addressed this issue by examining the topographic distribution of intra- and interareal connections labeled by anatomical tracer injections placed at, or near the rostral border of marmoset V2d. Because a region of upper visual field representation in area DM (DM+; Fig. 1—see also Supplementary Fig. 1a) has been proposed to abut rostrally part of V2d (Rosa and Schmid 1995; Rosa et al. 2005), to avoid this confound, our tracer injections were also placed in regions of V2d known to incontrovertibly abut areas of lower visual field representation (i.e. medially and laterally to the presumed location of DM+).
In Figure 1 we schematically depict 3 possible outcomes. First, cells at/near the HM representation of V2d do not make connections with cells in ventral cortex, and thus do not maintain retinotopic continuity of their visual RFs (Fig. 1a). Second, like V1 callosal connections, V2 cells at/near the HM make local, but not horizontal, intra-areal connections nor interareal feedback connections with cells in ventral cortex, thus serving the purpose of local circuits (Fig. 1b). Third, like V2 callosal connections, V2 cells at/near the HM make both local and long-range intra- and interareal connections with cells in ventral cortex, thus serving the purpose of both local and long-range horizontal and feedback circuits (Fig. 1c). Our results support the third hypothesis, suggesting that connections between V2d and V2v, of both the local and long-range type, can create visual field continuity within a second-order discontinuous visual topography. Continuity of visual field representation across the HM can also be maintained by most, although perhaps not all, interareal connections.
Materials and Methods
Animals
We chose the marmoset monkey (Callithrix jacchus) as the primate model for this study because its lissencephalic cortex allows for easy access to extrastriate visual areas and easy unfolding and flattening of the entire visual cortex. A total of 23 adult marmosets, obtained from an in-house colony, were injected with up to 4 different anatomical neuronal tracers, for a total of 46 injections. We included in our analysis only the injections (n = 24 from 11 animals, 4 females and 7 males; see Table 1) that met the following 4 criteria: 1) the injection did not encroach on the white matter, 2) the injection was located in V2d or just anterior to the V2d rostral border, 3) the tracer was transported outside the injected cortical area, and 4) the visual cortex was successfully unfolded and flattened. All experimental procedures conformed to National Institutes of Health guidelines for animal experimentation.
Table 1.
Summary of injection sites
| Case no. | Tracer injected | Area injected | CO stripe | Layers injected | Ecc. (°) | Diameter (mm) | Figures | |
| Injections at/near the V2d rostral border | M248 | CTB488 | DM+ | — | 1–6 | +8 | 0.9 | — |
| M248 | CTBg | Adl | — | 1–6 | −2.5 | 0.9 | 6, 9 | |
| M233 | CTBg | V2d/Adm/DM+ | Tk/P | 1–6 | −5.5/−5/+10 | 1.08 | — | |
| M248 | FB | V2d/Adm | NI | 1–6 | −8/−8 | 0.87 | — | |
| M232 | FR | V2d/Adm | P/Tk | 1–6 | −6/−4 | 0.8 | 5, 9, sup 2a–b | |
| M231 | CTB | V2d/Adl? | P/Tn/Tk | 1–6 | −1.5/−2 | 1.13 | — | |
| M262 | FB | V2d/DM+? | P/Tk | 1–6 | −4/+6? | 1.27 | — | |
| M248 | DY | V2d/Adl? | Tk | 1–5 | −1, −1.5 | 0.59 | 6, 9 | |
| M263 | CTB488 | V2d | Tk/P | 1–4 | −0.5, −1 | 0.6 | 7, 9, sup 2e–f | |
| M250 | CTBg | V2d | Tn | 1–5 | −3.5 | 0.5 | 4, 9, sup 2c–d | |
| M263 | FB | V2d | P/Tk | 1–5 | −1 | 1.6 | 7, 9, sup 2g–h | |
| M250 | CTB488 | V2d | Tk/P | 1–5 | −4.5 | 0.4 | — | |
| M250 | FB | V2d | Tk/P | 1–5A | −7 | 0.62 | 4, 9 | |
| M233 | CTB488 | V2d | Tn/P | 1–6 | −2, −2.5 | 0.67 | — | |
| Injections away from the V2d rostral border | M271 | CTBg-l | V2d | P | 1–5 | −1.5, −2 | 0.49 | 9 |
| M261 | FB | V2d | P/Tn/Tk | 2–6 | −4 | 0.57 | 8, 9 | |
| M260 | CTBg-l | V2d | Tk/P | 2–4 | −2 | 0.58 | 9 | |
| M260 | CTB488-l | V2d | Tk/P | 1–4 | −1.5, −2 | 0.76 | — | |
| M271 | CTB488-m | V2d | Tk/P | 1–5/6 | −3 | 0.47 | 9 | |
| M260 | CTB488-m | V2d | P | 1–4 | −2.5 | 0.92 | — | |
| M262 | CTB488 | V2d | NI | 1–6 | −3, −3.5 | 0.25 | 9 | |
| M260 | CTBg-m | V2d | Tk | 1–5A | −3 | 0.65 | — | |
| M271 | CTBg-m | V2d | Tn | 1–4 | −3.5, −4 | 0.47 | — | |
| M261 | CTB488 | V2d/V1d | P/Tk | 1–3 (V2), 4–6 (V1) | −3.5 | 0.4 | 8, 9 |
Note: P, Tk, Tn: pale, thick, and thin CO stripe, respectively; NI, CO stripe not identifiable. Adm, anterior dorsal cortex medial to DM+; Adl, anterior dorsal cortex lateral to DM+. “?” indicates that, due to border uncertainty, the injection site may or may not involve the indicated area. In the eccentricity column,“/” separates eccentricities at the injection site in different cortical areas, whereas “,” separates a range of eccentricities at the injection site in the same cortical area.
Surgery and Anatomical Tracer Injections
Animals were premedicated with dexamethasone (0.5 mg/kg i.m.), atropine (0.05 mg/kg i.m.) and antibiotics, preanesthetized with ketamine (25 mg/kg i.m.), intubated with an endotracheal tube and placed in a stereotaxic apparatus. Animals were artificially ventilated and anesthesia was maintained with 0.5–2% isofluorane in a mixture of 1:1 oxygen and nitrous oxide. Throughout the experiment, end-tidal CO2, ECG, blood oxygenation, and rectal temperature were monitored continuously, and repeated subdermal injections of lactated Ringers solution were made to maintain proper hydration.
A small craniotomy and durotomy were made under sterile conditions over the target region of the occipital cortex identified by means of stereotaxic coordinates. We used our own atlas of the marmoset visual cortex that we constructed over several years based on at least 50 tracer injections delivered to the visual cortex of about 20 adult marmosets. The following retrograde and anterograde anatomical tracers were used for injections (Table 1): 1% cholera toxin subunit B (CTB, low salt, List Biological Labs, Campbell, CA; n = 2) in 0.1 M phosphate buffer (PB) pH 6.0, 3% CTB-alexa-488 (CTB488, Invitrogen, Carlsbad, CA; n = 9) in distilled water, 0.1% gold-conjugated CTB (CTBg, List Biological Labs; n = 7) in distilled water, 10% fluororuby (FR, dextran tetramethylrhodamine 3000 and 10 000 MW mixed 1:1, Invitrogen; n = 1) in 0.1 M PB saline pH 7.3, 2% or 5% fast blue (FB, EMS-Chemie-Deutschland-GmbH, Groβ-Umstadt, Germany; n = 5) in distilled water, and 2% diamidino yellow (DY, Sigma-Aldrich, Saint Louis, MO; n = 1) in distilled water. The tracers were delivered either iontophoretically (using glass micropipettes of ∼15–20 μm tip inner diameter, and positive current in 7 s on/off cycles of 2 μA for 8–10 min for CTB, and of 5 μA for 10–15 min for FR) or through pressure injections (CTBg: 30–350 nL; CTB488: 15–40 nL; FB: 30–200 nL; DY: 150 nL; using micropipettes of ∼30–50 μm tip inner diameter), at a depth of 1.1 mm from the pial surface, and repeated at 0.5-mm depth, to involve all cortical layers within the same cortical column. These parameters typically yielded tracer uptake zones of ∼0.4–0.8 mm diameter, with one smaller and a few larger injections (Table 1). On completion of the injections, the craniotomy was filled with sterile Gelfoam, covered with sterilized parafilm and sealed with dental acrylic, and the wound was sutured closed.The animals were recovered from anesthesia, and after 8–14 days survival (case M260 survived 2 days), they were lightly perfused transcardially with saline containing 0.5% sodium nitrate, followed by 2% paraformaldehyde in 0.1 M PB, pH 7.3, for 5–7 min.
Histology
Visual cortex was unfolded and flattened, postfixed between glass slides for 1–2 h, cryoprotected in 30% sucrose, and frozen sectioned tangentially at 40 μm. Alternating sections were divided into 3 series; one series was reacted for cytochrome oxidase (CO) (Wong-Riley 1979), the remaining 2 series were reacted to reveal the injected neuronal tracers. When fluorescent tracers were injected, one series was mounted unstained, coverslipped using Gel Mount (Electron Microscopy Sciences, Hartfield, PA), and analyzed under fluorescence microscopy. CTB was revealed immunohistochemically following the protocol of Angelucci et al. (1996). Immunohistochemistry to reveal CTB488 and FR was carried out by incubating sections for 24–48 h in the specific primary antibody (1:7000 rabbit anti alexa-488 IgG, or rabbit anti fluororuby IgG, respectively), then for 1 h in 1:200 biotinylated donkey anti-rabbit IgG, followed by standard ABC-DAB reactions. CTBg was revealed using silver intensification (Llewellyn-Smith et al. 1990) on the immunoreacted sections and/or on the CO-stained sections. In the latter case CO staining was digitized prior to reacting for CTBg.
Data Analysis
Identification of Areas V1,V2, MT, and DM
Our goal was to determine whether injections at/near the HM representation at the rostral border of area V2d (representing the lower visual field) result in intra- and interareal label in ventral cortex representing the upper visual field. Thus, for this study it was essential to define the borders of areas V1, V2, and MT and the border between dorsal and ventral cortex. To avoid the potential confound of DM+, which could generate false positives in our study (see Introduction), we needed to also identify the caudal border of DM+.
To identify these areal boundaries, CO staining was visualized at low magnification (1.25×) under brightfield illumination, and digitized using a camera mounted onto a Zeiss light microscope and an image analysis software package (Image Pro Plus, Media Cybernetics, Silver Spring, MD). A minimum of 3 images of serial CO sections were overlaid by aligning the radial blood vessels, and merged in Adobe Photoshop (e.g. Fig. 2). Areas V1, V2, and MT were identified on these images, primarily based on their distinct CO-staining pattern, that is, CO blobs in the V1 upper layers or uniform dark CO staining in layer 4C of V1 (Horton and Hubel 1981; Humphrey and Hendrickson 1983), CO stripes in V2 (Tootell et al. 1983), and a CO-dark elliptical patchy region corresponding to MT (Tootell et al. 1985) (Fig. 2).
Delineation of dorsal versus ventral cortex was based on previous electrophysiological mapping studies of retinotopy in marmoset striate and extrastriate cortex. These studies showed that the representation of the upper and lower visual fields in area V2, and areas between V2 and MT are split at the foveal representation. The foveal representation in V1 is identifiable on CO-staining as the apogee of the curvature made by the V1/V2 border on the lateral surface of the brain (star in Figs 1 and 2). From this point, the HM crosses V2 almost in a direct caudo-rostral direction and then curves rostro-dorsally to reach the caudal tip of MT, where the fovea is represented. In MT the HM splits the dark CO oval region into a dorsal and ventral half representing the lower and upper visual field, respectively (Figs 1 and 2). In addition to these landmarks, the pattern of label resulting from tracer injections also aided us in delineating dorsal versus ventral cortex. The distortions caused by the relieving cuts needed to flatten V1, did not allow us to localize the HM representation in V1 with accuracy. Thus, in general we avoided estimating the size of label in ventral V1 (V1v), nor did we perform detailed counts of cells in this region. Cell counts reported in Table 2 are semiquantitative, and could be subject to a greater error in V1v than in other areas.
Table 2.
Area location of transported label
 |
The location of DM+ was identified using a combination of CO-staining pattern (dark CO region directly abutting V2d rostrally—Fig. 2) and distance from the midline and the foveal representation of V1, using as reference previous studies from Rosa et al. (2005).
Identification of the V2 Rostral Border
Because the conclusions of the present study rely on the identification of the V2 rostral border, we devoted much effort to determine as accurately as possible where this border was located in each case. CO staining allowed us to readily identify the caudal, but not the rostral border of V2, because in several cases it was difficult to determine with precision where the V2 CO stripe pattern ends. Thus, instead of a sharp border, we delineated a CO-defined transition zone (represented as a light gray region in Figs 2, 4–8,10) encompassing the most anterior and posterior CO borders drawn for each case by 3 different subjects. By measuring the width of this transition zone at the mediolateral location of each tracer injection site, we determined that there is on average an ambiguity of 0.46 ± 0.043 mm (excluding one outlier case; in most cases ranging between 0.21 and 0.64 mm) in the position of the CO-defined V2 rostral border (see Fig. 3). However, we were able to reduce the positional ambiguity of the V2 rostral border to an average of 0.19 ± 0.032 mm (in most cases ranging between 0 and 0.37 mm- see Fig. 3 and Table 2), by using, in addition to CO staining, as many of the 5 criteria described below as possible. First, we used measurements taken from identifiable CO features (i.e. the V1 foveal representation, the V1/V2 border, the V2 and MT borders, and the midline of the brain), using as reference previously published retinotopic maps of marmoset areas V1, V2, and MT (Fritsches and Rosa 1996; Rosa et al. 1997; Rosa and Elston 1998; Rosa et al. 2005); this criterion allowed us to constrain the location of the rostral V2 border to a region approximately 1 mm wide (±0.5 mm of the reference border). This is acceptable in view of previous data showing a strong degree of constancy across animals in the retinotopic maps of marmoset V2 relative to a number of landmarks (Rosa et al. 1997). Second, for tracer injections located at approximate eccentricities of >3°, we used the laminar distribution of retrogradely labeled cells in V1 to determine whether the injection was confined to V2d, to DM (corresponding to the location of V3d, according to Lyon and Kaas 2001—see Supplementary Fig. 1), or straddled both areas. This is possible because injections in marmoset V2 label cells primarily in V1 upper layers 2/3, with a very small projection arising from layers 4A–B (this study; Federer et al. 2007, 2008); instead the V1 laminar pattern is reversed following injections into area DM, with denser projections arising from layer 4B than 2/3 (this study; Jeffs et al. 2005; Rosa et al. 2005). However, for injections located at eccentricities <3°, the V1 laminar pattern was not helpful in determining if the injection straddled areas V2d and cortex just rostral to it (corresponding, at this eccentricity, to the dorsal half of area VLP according to Rosa and Tweedale 2000, or to parts of areas V3d and DL according to Lyon and Kaas 2001—see Supplementary Fig. 1), as both areas receive projections from the same V1 layers (this study and Jeffs et al. 2005). Third, for dorsal, but not ventral V2, we used the retinotopic pattern of transported label resulting from the tracer injections to help us determine if an injection was confined to a single area or straddled 2 areas, and to constrain the location of the V2d border. For example, in several cases injections straddling V2d and cortex just anterior to it encompassed different eccentricities in the 2 different areas, producing a retinotopic pattern of label in dorsal extrastriate cortex reflective of the separate eccentricities involved at the injection site. Fourth, for both dorsal and ventral V2, we used the pattern and laminar distribution of transported label in V2 and cortex just anterior to it to further constrain the location of the V2 rostral border. The following are examples of how the label pattern helped us define the V2 border: 1) injections close to the V2d rostral border, on either side of the border, often showed a distribution of intra-areal label that appeared incomplete or “cut-off” at the border (e.g. M250-CTBg in Fig. 4 and M248-CTBg in Fig. 6); 2) in many cases the pattern of label in V2d appeared stripe-like and contrasted with the patch-like pattern of label in cortex just anterior to V2d (M248-CTBg in Fig. 6). The following are examples of how the laminar distribution of label helped us define the V2 border: 1) intra-areal retrograde label involved the full depth of layers 5/6, whereas interareal feedback label was more restricted to the layer 5/6 border; 2) in layer 4, intra-areal anterograde label was very sparse (see Results), whereas interareal anterograde label was very dense and spatially restricted. Using the criteria described above allowed us to delineate a “label-defined” transition zone, which was narrower than the CO-defined transition zone and which we refer to in the Results section as the V2d rostral border. Finally, in order to make our conclusions less dependent on a strict definition of the V2 rostral border, we performed quantitative analyses that: 1) allowed for uncertainty in the location of the V2d rostral border (Tables 2 and 3 and Figs 3, 10), 2) used the V2d caudal border as reference (Table 3), and 3) did not require localizing the rostral border of V2v (Table 3 and Fig. 10).
Figure 4.
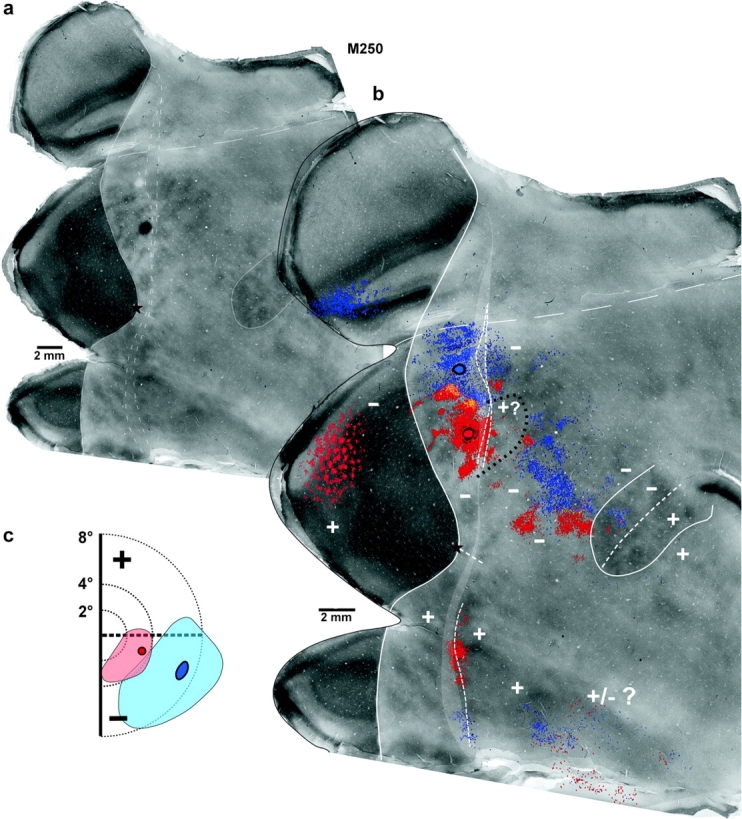
Central and medial retrograde tracer injections near the V2d rostral border label connections in ventral cortical regions representing the upper visual field. Case M250. (a) CO image resulting from the merging of 3 CO-stained sections. To avoid obscuring the CO-staining pattern, only the caudal V2 and the MT borders (solid contours) are delineated, together with the posterior and anterior boundaries of the CO-defined transition zone (dashed contours) at the V2 rostral border. The 2 injection sites are visible on this CO image: the FB injection corresponds to the CO-pale spot in the medial part of V2d, whereas the CTBg injection is the black spot below it (this CO section was silver intensified to reveal the CTBg injection site). (b) The same image as in (a) is showed enlarged, with overlaid composite injection sites (encircled in black) and the mapped cell label resulting from each injection (FB-blue, CTBg-red, yellow are regions where the 2 labels overlap). Note that although FB label in V1 appears only on the medial flap of unfolded V1, some of this label likely involves parts of V1v, which ended up in the medial V1 flap because of the unfolding method. The posterior and anterior boundaries of the labeled-defined transition zone are shown as dashed white contours overlying the CO-defined transition zone (the latter shown as a light gray area here and in Figs 5–8). (c) Visual field map of the CTBg (red circle) and FB (blue circle) injection sites and resulting intra-areal label in V2d+V2v (pale red and blue, respectively). Visual field coordinates in V2 were estimated based on the electrophysiological maps of (Rosa et al. 2005). All other conventions are as in Figures 1 and 2.
Figure 5.
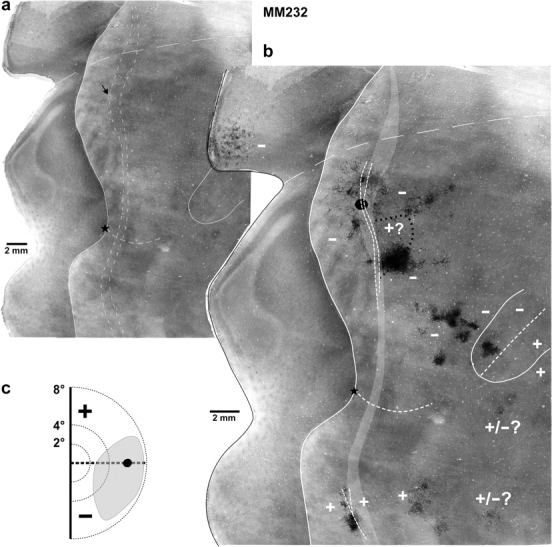
Medial anterograde tracer injection near the V2d rostral border labels connections in ventral cortical regions representing the upper visual field. Case M232. (a) Image merge of 3 CO sections with light delineation of the V2 and MT borders. The black arrow points at the CO-pale spot in V2d corresponding to the location of the FR injection site. (b) The same CO image is shown enlarged with overlaid composite injection site (filled black oval) and resulting map of the anterograde fiber label (black). Again the medial flap of unfolded V1 likely includes some label in V1v. (c) Visual field map of the FR injection site (black circle) and resulting intra-areal label in V2d + V2v (gray area). Other conventions are as in Figure 4.
Figure 6.

Lateral tracer injections near the V2d rostral border label connections in ventral cortical regions representing the upper visual field. Case M248. (a) An image merge of 3 overlaid CO sections (silver intensified to reveal the CTBg injection site). The yellow arrow points at the CO-pale spot in V2d corresponding to the DY injection site. The much larger black spot just anterior to the CO-defined transition zone is the CTBg injection site. A third injection site (FB) is also visible as a pale CO spot medially in the middle of the CO-defined transition zone. The FB injection case is included in Tables 1 and 2 but is not shown in (b). (b) The same CO image is shown enlarged with overlaid 2 composite injection sites (encircled in black) and the mapped label (DY—yellow, CTBg—red) resulting from them. DY cell label in some sections was not mapped but only circled due to artifactual glial label. (c) Visual field map of the DY (yellow circle) injection site and resulting intra-areal label in V2d and V2v (pale yellow). For the CTBg injection site in cortex rostral to V2d (red circle) we show the visual field map of both the intra-areal label (pink) in dorsal and ventral cortex abutting V2d rostrally (based on the electrophysiological retinotopic maps of Rosa and Tweedale 2000), and the interareal label (pale red) in V2d. All other conventions are as in Figure 4.
Figure 7.
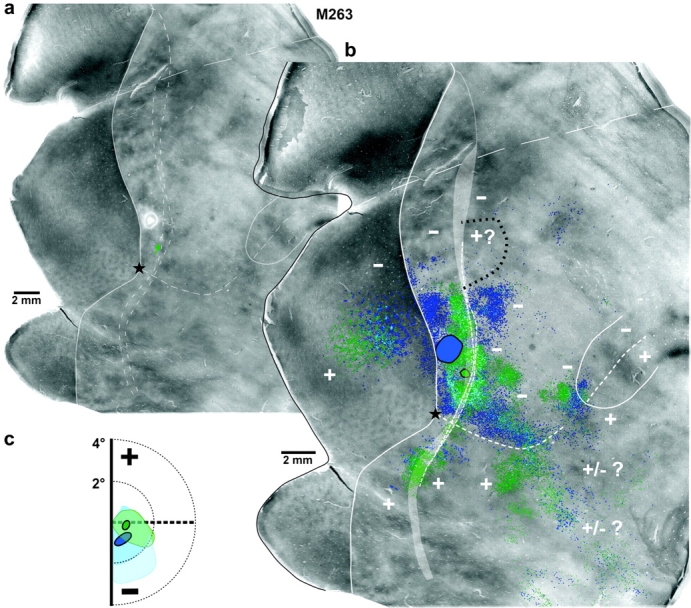
Two additional examples of foveal lateral injection cases. Case M263. (a) CO image. The green arrow points at the small CO-pale spot in V2d corresponding to the CTB488 injection site. The much larger CO-pale spot just above it is the FB injection site. (b) The same CO image is shown enlarged with overlaid 2 composite injection sites (encircled in black) and the mapped label (CTB488—green, FB—blue) resulting from them. Light blue shows regions of overlap of the 2 different labels. (c) Visual field map of the CTB488 (green circle) and FB (blue oval) injection sites and resulting intra-areal label in V2d and V2v (pale green and blue, respectively; lighter blue indicates less dense FB label). Other conventions are as in Figure 4.
Figure 8.

Tracer injections away from the V2d rostral border do not label connections in ventral cortical regions representing the upper visual field. Case M261. (a) CO image (same as shown in Fig. 2). The green arrow points at a small CO-pale spot at the V1/V2 border corresponding to the CTB488 injection site. The much larger CO-pale spot above and anterior to it is the FB injection site. (b) The same CO image is shown enlarged with overlaid 2 composite injection sites (encircled in black) and the mapped label (CTB488– green, FB –blue) resulting from them. (c) Visual field map of the CTB488 (green oval) and FB (blue oval) injection sites and resulting intra-areal label in V2d (pale green and blue, respectively). Other conventions are as in Figure 4.
Figure 3.

Presence or absence of transported label in V2v depends on the distance of the injection site from the V2d rostral border. Distance of the injection site from the posterior and anterior boundaries of the CO-defined (gray segments) or label-defined (white and black segments) transition zones at the V2d rostral border. “0 mm” indicates the position of the V2 rostral border, with negative values indicating that the injection was located posterior to this border, that is, in V2d, and positive values that the injection was anterior to this border, that is, in DM+ or anterior dorsal cortex. White and black segments indicate cases that showed, or did not show, respectively, transported label in upper visual field regions of the upper and lower layers of V2v. The case number is indicated on the right; in bold are the cases that showed label in layer 4 of V2v. The “asterisk” indicates cases for which we did not look at layer 4 label separately. The vertical gray bar represents an uncertainty region; injections placed in this region did or did not produce label in the upper and lower layers of V2v, whereas injections to the right (to the left) of this region unequivocally produced (did not produce) label in the upper and lower layers of V2v. The vertical light gray bar represents an uncertainty region for the presence or absence of transported label in layer 4 of V2v; injections to the right of this region produced label in V2v layer 4, whereas injections to the left did not; injections in the light gray region gave mixed results.
Table 3.
Extent of label in V2d and V2v: injections at/near the V2d rostral border
| Case no. | Distance of injection (rostral edge) from V2d borders (mm) |
Width of V2d at site of injection (mm) | Half-width & half-length of label in V2d (mm) |
Full length of label in V2v/V3v(VLP) (mm) |
Figure | |||
| Rostral post., ant. | Caudal | Post., ant. | SRC (AP–ML) | LRC (AP–ML) | In layer 4 | In all other layers | ||
| M232-FR | 0, 0 | 3.79 | 3.34, 3.54 | 0.40–0.69 | 1.4–2.8 | 2.27a | 3.7 | 10–11 |
| M231-CTB | 0, −0.13 | 3.15 | 2.97, 3.28 | 0.90–1.0 | 1.4–3.4 | 2.3a | 3.9 | 11 |
| M248-DY2 | 0, 0 | 2.15 | 2.01, 2.12 | ?–0.9 | 1.3–3.2 | Yes | Yes | — |
| M263-CTB488 | −0.14, −0.28 | 1.98 | 2.11, 2.24 | 0.76–1.0 | 1.2–5.0 | 0.85 | 4.8 | 11 |
| M250-CTBg | −0.59, −0.89 | 2.92 | 3.51, 3.80 | 0.50–0.52 | 0.8–2.8 | 0.35 | 4.3 | 10–11 |
| M263-FB | −0.61, −0.79 | 1.59 | 2.20, 2.37 | 0.80–0.90 | 1.0–5.0 | 0 | 2.5 | 11 |
| M250-CTB488 | −0.65, −0.70 | 3.89 | 4.54, 4.58 | 0.54–0.63 | 1.5–2.8 | 1.9a | 4.0 | 11 |
| M250-FB | −0.80, −1.17 | 3.24 | 4.03, 4.39 | 0.80–0.80 | 2.0–2.4 | 0 | 1.9 | 11 |
| M233-CTB488 | −0.90, −1.35 | 3.15 | 4.07, 4.52 | 0.39–0.38 | 1.1–4.0 | 0 | Yesa | — |
AP: half-width measured along the CO stripes; ML: half-length measured across the CO stripes.
Extent is of anterograde label; retrograde label in layer 4 was sparser and more restricted.
For these cases we do not report all measures because the label was not fully mapped; “yes” indicates presence of label.
Figure 10.

The extent of label in V2v/V3v (VLPv) is inversely correlatedwith the injection's distance from the V2d rostral border. Scatter plots of the length of supra- and infragranular label in V2v/V3v(VLPv) versus the distance of the rostral edge of the injections site from the V2d rostral border. In (a) the injection's distance is expressed as absolute distance from the posterior and anterior boundaries of the label-defined transition zone; thus each case is identified as 2 points linked by a segment. The trend line was calculated from the mean of the 2 distances for each injection site. In (b) the injection's distance is normalized to the width of V2d, the latter defined as the distance of the V1/V2 border from the anterior and posterior boundaries of the label-defined transition zone at the location of the injection site (the smaller of the 2 injection distances was normalized to the smaller of the 2 widths of V2d). The trend line was calculated from the mean of the 2 normalized distances for each injection site.
Identification of Other Cortical Areas between V2 and MT
As most recent studies in New World primates (Kaas and Morel 1993; Sereno et al. 1994; Rosa and Elston 1998) recognize its existence and agree about its location, we also identified MTc as a small stripe-like area immediately surrounding MT of lighter CO-staining than MT and about 1.5 mm wide after correcting for tissue shrinkage. This area corresponds in part to Old World monkeys’ area V4t (Desimone and Ungerleider 1986; Perkel et al. 1986; Gattass et al. 1988) (see Supplementary Fig. 1). We did not attempt to identify with precision other cortical areas anterior to V2, as their identity and location is still being debated. Thus, label abutting anteriorly the rostral border of V2v was assigned to ventral area V3 (or VLP; see Supplementary Fig. 1a) (Rosa and Tweedale 2000; Lyon and Kaas 2001), whereas label anterior to this cortical region was designated “anterior ventral cortex.”The latter consists of at least 2 or 3 areas, including but not limited to area VLA (or V4) of Rosa and Tweedale (2000), and area DL of Kaas and collaborators (reviewed in Kaas 1997) (see Supplementary Fig. 1a). We excluded from our definition of anterior ventral cortex the nonretinotopic label located in inferior temporal cortex (IT), as this region of cortex includes a number of areas representing the lower visual field (Jeffs et al., unpublished observations; Rosa and Tweedale 2000). We did not assign any areal location to label located rostrally to our definition of “anterior ventral cortex” and ventrally to MTc. Similarly, in dorsal cortex we designated the cortical area/s just anterior to the rostral border of V2d as “anterior dorsal cortex” either medial (Adm) or lateral (Adl) to the presumptive location of DM+ of Rosa et al. (2005). Cortical regions between Adl, Adm, and DM+ posteriorly and MTc anteriorly (encompassing area VLA or V4 or DL—see Supplementary Fig. 1) were not identified.
Mapping of Injection Sites and Transported Label
Tracer injection sites were mapped on each individual tissue section, aligned using radial blood vessels and collapsed onto a 2D plane. The composite injection site was overlaid onto images of CO staining, and its areal location, cortical layers involved, and diameter (extent of longest axis—Table 1) were determined. The effective tracer uptake zone for CTB, CTB488, and FR was defined as the region at the injection site where no labeled cell bodies or fibers could be discerned (Ericson and Blomqvist 1988; Llewellyn-Smith et al. 1990; Luppi et al. 1990; Brandt and Apkarian 1992; Angelucci et al. 1996). For CTBg it was defined as the dark core seen under darkfield microscopy, and for FB and DY, it was the region of tissue damage caused by the pipette and by the injected tracer (Conde 1987) visible under fluorescence illumination. In addition most tracer injection sites were identifiable in CO-stained sections as spots lacking CO staining (e.g. white spots in Figs 4a, 5a, 7a, 8a). Supplementary Figure 2 shows micrographs of example injection sites and resulting label in V2v.
The distance of the injection site from the V2d rostral border (Tables 2 and 3) was measured as the shortest distance from the anterior and posterior boundaries of the label-defined transition zone to the closest anterior edge of the injection. A distance of −0 mm indicates that the injection site was located in V2d and touched, but did not cross the V2d border, whereas ±0 indicates that the injection crossed the border straddling 2 cortical areas.
The approximate eccentricity of the injection sites was determined by reference to the electrophysiological retinotopic mapping study of Rosa et al. (1997, 2005).
The location of retrogradely labeled cells and of anterogradely labeled fibers was plotted for most cases using a computerized drawing program (Neurolucida, MicroBrightField, Inc., Williston, VT). In 13 cases label was mapped throughout the visual cortex in every third tissue section, across all cortical layers; in 5 cases label was mapped in at least 50% of the sections through the depth of the cortex. Quantitative analysis was performed on a subset of these cases, that is, those showing transported label in ventral cortex. Plots of label were imported into Adobe Photoshop, overlaid onto each other and onto images of adjacent CO-stained sections, using blood vessels for alignment. Delineation of areal boundaries, cell counts and all measurements were performed onto these composite images. In 2 cases we mapped fewer sections, whereas in 5 cases we did not map cell label; the relevant cell counts included in Table 2 for these cases were performed directly under microscopic observation.
Measurements of the Extent of Label
In Table 3 we report the half-width and half-length of labeled short- and long-range connections in V2d. short range (or local) connections (SRCs) in V2d were defined as the annulus of dense and uniform (i.e. nonpatchy) label immediately surrounding the injection site, and their width was measured from the edge of the injection site to the outer border of this annulus, both parallel and perpendicular to the V2 CO stripes. The extent of long-range horizontal connections (LRCs) was determined as follows. First we drew 2 orthogonal lines through the center of the injection site, one oriented parallel, the other perpendicular to the CO stripes. By moving a 0.1 × 0.1 mm window along these lines toward the edge of the label, we defined the outer edge of the horizontal connection field as the point at which the density of labeled cells (or fibers segments for case M232-FR) fell below 5 cells (or fiber segments)/0.01 mm2. We then measured the distance from the medial edge of the injection site to the medial outer edge of the label (the half-length, measured along the line perpendicular to the CO stripes), and the distance from the caudal edge of the injection site to the caudal outer edge of the label (the half-width, measured along a line parallel to the CO stripes).
In Table 3 we also report measurements of the full medio-lateral (ML) length of label in all layers collapsed onto a single plane and encompassing areas V2v and Ventral V3 (V3v) or ventral VLP (VLPv). This was done by drawing a line through the middle of the label oriented parallel to the long axis of the label field (i.e. across the CO stripes). We then used the 0.1 × 0.1 mm window method described above to define the outer borders of the labeled field, and measured the distance between the medial and lateral edge of the composite labeled field. As the extent of this composite labeled field effectively reflects the longer extent of label in the supra- and infragranular layers, we often refer to this as the “supra- and infragranular layer label”. We also measured the full length (ML) of the labeled field in layer 4 of areas V2v and V3v (VLPv) using a similar method.
Results
Our results show that neurons located at or near the rostral border of area V2d (representing the lower visual field) can maintain retinotopic continuity within their classical and extra-classical RF across the HM by making intra-areal connections with neurons at/near the representation of the HM at the rostral border of V2v (representing the upper visual field). Additionally, we show that visual field continuity across the HM can also be maintained by some, but perhaps not all, interareal connections of V2d. These results are presented in several parts. We begin by discussing the pattern and laminar distribution of intra- and interareal connections resulting from injections placed in V2d. Then we present the topographic distribution of transported label. Finally, we present quantitative anatomical evidence demonstrating that intra-areal connections between V2d and V2v resulting from tracer injections at/near the V2d rostral border are both local and horizontal circuits.
Intra- and Interareal V2 Connections: Patterns and Laminar Distribution
Table 1 summarizes for each case the tracer injected, the area(s), V2 CO stripe(s), and cortical layers involved by each injection site, the estimated eccentricity and the diameter of each injection site. Cases in which the injection site was located in cortex just anterior to the V2d rostral border, that is, in “anterior dorsal cortex” (see Methods) or in DM+, are shaded in gray.
Intra-areal Connections
Tracer injections in V2d resulted in retrograde and anterograde (for CTB488 and FR only) label within V2d and, for injections that were near the V2d rostral border, in V2v. The pattern of intra-areal label typically consisted of a ring (0.4–1.0 mm in width—see Table 3) of dense and uniform label immediately surrounding the injection site (e.g. M250-CTBg in Fig. 4) to which we refer as SRCs. In several cases, as the label was too dense, we did not plot individual neurons throughout this region but simply circled it or circled parts of it (e.g. Fig. 8). Outside this ring, and only in the supra- and infragranular layers of V2d, but not in layer 4, labeled cells and terminals usually showed a pattern of patches and bands, as previously described for V2 LRCs in other primate species (e.g. in macaque Levitt et al. 1994). This clustered pattern was not observed for horizontal connections labeled by tracer injections nearest the fovea (e.g. Fig. 7) or was less striking with tracers such as FB (e.g. Figs 4, 8). Horizontal connections had an anisotropic distribution in V2d, being elongated across the CO stripes (the half-length along this axis measured about 3−4 mm; see Table 3).The mean anisotropy ratio of horizontal connections outside the fovea, that is, at >1° eccentricity was 2.4 ± 0.33, reaching up to 4–5 at <1° eccentricity. This anisotropy ratio is consistent with the anisotropy in cortical magnification factor reported by Rosa et al. (1997) for marmoset V2 (equal to 2–3 between 8° and 2° eccentricity, respectively, and 4 at <1° eccentricity).
As previously reported for macaque V2 (Levitt et al. 1994), LRCs were absent in layer 4; retrograde tracer injections involving all layers of V2d labeled just a few neurons immediately surrounding the injection site in the upper part of layer 4, and few or no cells in the bottom half of this layer, indicating very short or no lateral branching. However, bidirectional tracer injections in V2d also produced sparse fiber and terminal label throughout the depth of layer 4, whose lateral extent exceeded that of the retrograde label, but was still shorter than that of horizontal connections in the supra- and infragranular layers. Thus, there are non-reciprocal interlaminar projections arising from outside layer 4, which travel laterally for longer distances in layer 4 than the axons of layer 4 cells.
The distribution of intra-areal label in the supra- and infragranular layers and in layer 4 of V2v produced by tracer injections near the V2d rostral border (see Results below) was similar to that described above for connections in V2d. Labeled connections in the upper and lower layers of V2v often had a patchy appearance, but “bands” of label, as seen in V2d, were not observed in V2v. As for horizontal connections in V2d, patchy connections in the supra- and infragranular layers of V2v were not seen following tracer injections in V2d near the foveal representation or when FB was the injected tracer. The extent of labeled connections in V2v is addressed separately at the end of the Results section.
Interareal Connections
Tracer injections in V2d also labeled retrogradely the cells of origin in V1 of feedforward connections to V2, and the cells of origin in extrastriate cortex of feedback connections to V2. CTB488 and FR in addition labeled anterogradely in V1 the terminals of feedback connections from V2, and the terminals in extrastriate cortex of feedforward connections from V2. In V1, the cell and terminal labels were in register and showed a patchy pattern (e.g. Figs 4, 5, 7); the patches of label aligned preferentially with the CO blobs following tracer injections in the V2 thin CO stripes and with the interblobs after injections in the thick or pale CO stripes (this is similar to what was previously described in macaque for feedforward connections from V1 to V2; Sincich and Horton 2002). Labeled cells were located primarily in layers 2/3 with sparser patchy label in layers 4A and 4B, and occasional labeled cells in layer 6. Details of the laminar distribution in V1 of the cells of origin of feedforward connections to V2, and of their spatial relationship with the CO maps are beyond the scope of this study and are reported in a separate study (Federer et al. 2007, 2008).
Feedback connections to V2d from dorsal and ventral extrastriate cortex arose from layers 2/3 and the layer 5/6 border, and often (but not always) showed a patchy distribution. Feedforward connections from V2 terminated in layer 4 and lower 3 of extrastriate cortex and showed a dense, focused and patchy terminal pattern.
Intra- and Interareal V2 Connections: Topographic Distribution
For each injection site, we measured the distance of the anterior edge of the injection from the posterior and anterior boundaries of the labeled-defined transition zone (see Methods). Figure 3 shows these distances arranged from right to left in order of decreasing distance (for injections rostral to the V2d rostral border) or increasing distance (for injections at or caudal to the V2d border) of the injection site from the posterior boundary of the labeled-defined transition zone. White and black segments in the figure indicate cases that showed or did not show, respectively, labeled connections in upper visual field regions of V2, that is, in V2v. For comparison, in Figure 3 we also provide for each injection its distance from the posterior and anterior boundaries of the CO-defined transition zone (gray segments). In the remainder of the paper we will refer to the labeled-defined transition zone simply as the V2d rostral border. A glance at Figure 3 conveys one of the main results of this study, that is, that injection sites placed at <0.9 mm from the V2d rostral border showed label in the upper and lower layers of V2v representing the upper visual field, whereas injection sites located at about 1.2–1.3 mm or farther from the border did not. There is an uncertainty region between 0.9 and 1.2–1.3 mm from the border where injections could or could not produce label in the upper and lower layers of V2v. This uncertainty region could be due to the uncertainty in the exact location of the V2d rostral border, as well as to additional factors, such as interanimal variability, RF scatter and the specific CO stripe involved by the injection site.
Table 2 reports for each case the distance of the anterior edge of the injection site from the posterior and anterior boundaries of the V2d rostral border. Injections are listed in the same order as in Figure 3 (with the rightmost case in Fig. 3 placed at the top of Table 2). Table 2 also indicates for each case the presence or absence of transported label in V1v, V2v, V3v (VLPv), ventral MT (MTv), ventral MTc (MTcv), and anterior ventral cortex, all representing the upper visual field, and in dorsal MT (MTd) and MTc (MTcd) representing the lower visual field. The numbers in the Table indicate the actual number of labeled cells when <50 cells were counted in a given area, with 0 indicating no labeled cells. Gray dots indicate sparse label (between 50 and 150 labeled cells), whereas black dots indicate dense label (>150 labeled cells). Although not indicated in the Table, all cases showed dense label (>150 labeled cells) in areas V1d and V2d, as well as additional dense label in dorsal cortex between area V2d and MTc. Label in MTd and MTcd was not quantified, and in Table 2 we simply report the presence (“yes”) or absence (“0”) of label in these areas, or the actual number of cells when <50 cells were labeled.
Table 2 shows in a semiquantitative way a similar result to that conveyed by Figure 3, that is, that injection sites placed at <0.9 mm from the rostral V2d border showed label in upper visual field regions of ventral cortex, whereas injection sites located at ≥1.2–1.3 mm from the border did not. The exceptions to this rule were areas MT and MTc, which in most cases did not show label in their ventral halves of upper visual representation, even when dense label was seen in the their dorsal halves of lower visual field representation.
These results are presented in 2 parts. We first describe the topographic distribution of label resulting from tracer injections placed at/near the V2d rostral border; we then present results from the placement of tracer injections away from the V2d rostral border.
Injections at/near the V2d Rostral Border
Tracer injections that were placed at <0.9–1.2 mm from the V2d rostral border (n = 14) were classified as central, medial or lateral. Central injections (n = 5) were those placed in V2d at (n = 2), or caudal (n = 3) to the V2d/DM+ border, that is, between −2° and −5° eccentricity. Medial injections (n = 3) were those placed medially to the V2d/DM+ border, and corresponding to eccentricities greater than approximately −5°. Lateral injections (n = 5) were placed laterally to the V2d/DM+ border, corresponding to eccentricities lesser than approximately −2°. One injection (case M248-CTB488) was placed in DM+ of Rosa et al. (2005), 0.82–1.17 mm rostral to the V2d border. This case was used as a control case, to compare label resulting from injections that clearly did not involve presumptive DM+ (i.e. medial and lateral injections) with label resulting from injections in DM+.
We begin with a short description of the central injection cases, followed by more detailed descriptions of medial and lateral injection cases.
Central injections.
Figure 4 shows one example (case M250-CTBg—red) of a central injection of CTBg located 0.59–0.89 mm caudal to the V2d rostral border, and involving primarily a V2 thin CO stripe (Table 1). A ring of dense, uniform cell label about 0.5 mm thick surrounded the injection site in V2d. Outside this ring of SRCs, the intra-areal label showed a band-like pattern, which extended medially up to 2.8 mm from the medial edge of the injection site; some of the medial “bands” reached posteriorly the V1–V2 border (representing the VM). Outside V2d, in dorsal cortex dense retrograde label was found in V1, MTc and cortical areas between V2d and MTcd; only a few cells (n = 30) were labeled in dorsal MT. Dense label in ventral cortical areas representing the upper visual field was found at the border between V2v and V3v (VLPv) (i.e. at the presumptive location of the HM representation), but not in anterior ventral cortex, MTv or MTcv; label in V1 appeared to reach across the HM representation, although the exact boundary between V1d and V1v could not be determined in our material (Table 2). Sparse label was seen in IT cortex, which is known to represent both the upper and lower visual field.
We believe that the injection site for this case was confined to V2d for the following reasons. First the laminar pattern of V1 label was consistent with that resulting from V2 but not DM injections, i.e. most labeled cells were located in layers 2/3 (see Methods). Second the labeled patches in V1 aligned with the CO blobs, a pattern not expected had the injection involved DM+ (see below). Third, there was little label in dorsal MT, consistent with the injection site being largely confined to a V2 thin CO stripe (Federer et al., 2007), but inconsistent with the injection involving cortex just anterior to V2d (see below and Krubitzer and Kaas 1990a, 1990b; Rosa and Tweedale 2000; Palmer and Rosa 2006a, 2006b). Fourth, unlike injections involving DM+ (see below), there was no label in ventral MT and MTc.
Three additional central injections were similarly located near the V2d border, but posterior to it, that is, in V2d (Tables 1 and 2). The cortical distribution of transported label in ventral cortex in these cases resembled that seen for case M250-CTBg, but labeled cells in most of these other cases were also found in anterior ventral cortex at the presumptive location of the HM representation (Table 2). The 2 remaining central injection cases straddled (M233-CTBg) or may have straddled (M262-FB) DM+; thus, label in upper visual field regions of ventral cortex in these cases could be attributed to the injection sites involving DM+. One case (not included in the Tables) in which the injection was near (0.68–0.85 mm) the V2d rostral border showed no label in ventral cortex (including ventral cortical regions of lower visual field representation, i.e. IT), or in dorsal MTc, and showed only very sparse label in MTd, even though the injection involved a thick CO stripe. Our interpretation of this case is that the lack of ventral label was due to poor transport of the tracer.
Our injection case that was located in presumptive area DM+ (case M248-CTB488) showed dense label in all ventral cortical areas representing the upper visual field (Table 2). Retrograde label in V1 and V2 was not confined to a single CO compartment, but encompassed both CO blobs and interblobs in V1 and both dark and pale stripes in V2. Unlike the central injections located in V2d (and unlike all of our medial and lateral injections at/near the rostral V2d border at eccentricities >1.5°—see Results below), this case also showed dense label in ventral MT and MTc. This suggests that this injection indeed involved a region of upper visual field representation. Furthermore, it suggests that the lack of label in ventral MT and MTc seen in most other injections located near the rostral V2d border is a true finding, and is not due to inaccuracy in locating the HM representation in these areas.
Medial injections.
Unlike central injections, medial injections did not suffer from the possible confound of the injection straddling DM+, as they were located in cortical regions known to incontrovertibly represent the lower visual field (Lyon and Kaas 2001; Rosa et al. 2005). Label in ventral cortex following medial injections near the V2d rostral border would thus provide incontrovertible evidence in support of retinotopic continuity of connections across the HM. These cases are presented below.
Figure 4 shows a second injection site in V2d, that is, an injection of FB (blue) that was located medial to the V2d/DM+ border (at approximately −7° eccentricity). The injection, 0.8–1.17 mm caudal to the V2d rostral border, straddled a thick and a pale CO stripe (Table 1). Intra-areal retrograde label in V2d extended up to 2.4 mm medial to the injection site. In dorsal cortex, label showed a similar areal distribution as that described above for the central injection of CTBg in the same case (red in Fig. 4), but there was more significant FB than CTBg label in MTd, which is consistent with the different CO stripes involved by the 2 injections. In ventral cortex, sparse label was seen at the border between V2v and V3v (VLPv), and at the presumptive location of the HM representation in anterior ventral cortex and in V1v; label was also seen in IT. Like all of our nonfoveal injections in V2d, we saw no transported label in ventral MT and MTc (Table 2).
Figure 5 shows one additional example (case M232) of a medial injection that was located in V2d at a similar eccentricity (−6°) as M250-FB, but straddled anterior dorsal cortex, Adm (Tables 1 and 2). This was an injection of a bidirectional tracer, FR. In the figure we show a map of anterogradely labeled fibers (only few cells were labeled retrogradely in this case). The topographic pattern of anterograde label in dorsal and ventral cortex resulting from this injection resembled that of retrograde label seen in other medial injection cases (Table 2; note that for this case “dense” and “sparse” in the table do not correspond to quantitative definitions, but to a qualitative judgment of fiber density). This also indicates that dorsal and ventral V2 show a similar pattern of intra-areal connectivity across the HM representation.
Our third medial injection case (M248-FB) which crossed the V2d rostral border at about −8° eccentricity, showed a distribution of transported label similar to that of other medial injections.
In summary, the topography of connections labeled by medial injections indicates that cells at/near the rostral V2d border (presumptive representation of the HM) make intra- and some interareal connections with cortical regions representing the upper visual field; these connections can provide an anatomical substrate for maintaining retinotopic continuity of the V2 cells’ classical and/or nonclassical RF across the HM.
Lateral injections.
Five additional tracer injections were placed laterally to the V2d/DM+ border, 4 in V2d (2 of these may have involved Adl) between approximately −0.5° and −1.5° eccentricity, and 1 in anterior dorsal cortex (Adl) at −2.5° eccentricity (Table 1). Like the medial injections, these injections did not suffer from the possible confound of involving DM+.
These injections also produced label in ventral cortical regions representing the upper visual field. However, unlike the central and medial injections, lateral injections located within the central −1.5° eccentricity showed at least some label in ventral MT and/or MTc (Table 2).
Figure 6 shows 2 such injections in case M248. An injection of DY (yellow in the figure) was located right at the rostral V2d border (and may have slightly encroached into Adl) and involved primarily a thick CO stripe. The field of labeled horizontal connections in V2d extended up to 3.2 mm medially from the medial edge of the injection site and 4.7 mm from the lateral edge of the injection to the HM representation at the V2d/V2v border, and posteriorly reached the V1/V2 border. The dashed yellow contour in Figure 6b indicates a region of dense labeled connections where we did not plot individual neurons because a significant amount of glial cell label was intermingled with neuronal label, something known to occur with this tracer (Keizer et al. 1983). Dense interareal label in dorsal cortex was seen in V1, MT, MTc, and cortex just abutting V2d rostrally. Dense intra-areal label involved the rostral half of V2v reaching to the V2v rostral border between approximately 0° and −2° eccentricity (Fig. 6c). Dense interareal label in cortex representing the upper visual field was seen in presumptive V1v and in V3v (VLPv), but not in anterior ventral cortex (as expected because V2 thick CO stripes are known not to project to area V4/DL/VLA), IT or MTcv. There appeared to be sparse label in foveal MTv, at the HM representation. However, in this case MT was not clearly discernible in CO-staining; in addition there is no anatomical landmark for the HM representation in MT, and this is especially difficult to locate at the foveal representation of this area. Thus, we cannot exclude that the label in MTv in this case was in fact due to uncertainty in locating the boundaries and the HM representation of MT. However, similar results from other foveal injection cases (see below) suggest that the label in ventral MT in this case was also a real finding.
The second injection (CTBg, red in Fig. 6b), was located 0.47–0.53 mm anterior to the rostral V2d border, in Adl at approximately −2.5° eccentricity. There is consensus that this cortical region, regardless of its identity, represents the lower visual field. Although we cannot entirely exclude that this injection involved V2d, we believe this to be highly unlikely for the following reasons. First, the injection site was rostral to the CO-defined transition zone. Second, resulting retrograde label in V1 aligned with the CO blobs; such a pattern can be observed following V2 injections, but only when the injection is confined to a thin CO stripe (Federer et al. 2007, 2008). Due to its large size (0.9 mm in diameter), it is unlikely that this tracer injection was confined to a thin stripe. Third, the posterior edge of the injection site was located about 3.5 mm rostral to the V1/V2 border, which is wider than the usual width of V2 near the fovea (Rosa et al. 1997). Fourth, resulting label in V2d was located caudally to the injection site and showed a band-like pattern that differed from the pattern of small patches located laterally to the injection site. The patchy intra-areal horizontal connections in Adl extended up to 5.47 mm laterally to the injection site, but extended only ∼1 mm and appeared “cut off” medially (suggesting an areal border at this location). Dense and patchy intra-areal label in V3v (VLPv) extended ∼2 mm along the width of this area, rather than being wrapped around the HM representation (like in our V2d injection cases). Our interpretation of the topography of the intra-areal ventral label in this case is that it represents the medial branch of the horizontal connection field that is “missing” at the border between presumptive DM+ and Adl. Electrophysiological mapping studies of this cortical region are consistent with this interpretation, because they showed that there is a representation of the HM at the rostrolateral border of presumptive DM+ (Rosa et al. 2005).
Interareal label in this case was dense in dorsal cortex, but very sparse in MTd, whereas it was sparse or absent in upper visual field regions of ventral cortex, except for V1v (Table 2). Albeit sparse, the label in MT extended the full width of the area (see also Fig. 9 case number 4), leaving no doubt that there were a few labeled cells in ventral MT. There was significant label in cortex rostral to anterior ventral cortex and in IT, which include representations of both the lower and upper visual fields.
Figure 9.

Summary of injection sites and topography of transported label in ventral cortex. For a color version of this figure see Supplementary Figure 3. Schematic diagram of the spatial relationship between the location of the different injection sites in dorsal V2 (or cortex just rostral to it) and labeled connections in ventral cortex representing the upper visual field.Note that we excluded from the figure all transported label in cortical regions of lower visual field representation. The outlines of areas V1, V2, DM+ (gray area) and MT are as in Figure 1, as are the representation of the fovea (star) and the location of the iso-eccentricities lines (dotted contours) in V2d, the HM (thick dashed contours) and the VM (thick solid contours). Numbered gray circles in dorsal cortex represent tracer injection sites, as follows: circles (6–7): medial injections in V2d at/near rostral V2d border; circle (5): central injection in V2d near the V2d rostral borer; circles (1–3): lateral injections in V2d at/near the V2d rostral border; circles (8–13): injections in V2d away from the V2d rostral border; circle (4): lateral injection in Adl near the V2d rostral border. Numbered gray patches in V2v, V3v/VLPv, anterior ventral cortex (Avc), MTv, and MTcv represent smoothed outlines of label resulted from each respective injection site (marked with the same number). Transported label in V1v instead is represented more schematically as semicircles along the HM representation at the label's eccentricity; this is because, in the absence of anatomical landmarks for the HM representation in V1 (see Methods), we did not attempt to determine the exact size of label in V1v. Numbers correspond to the following cases: (1) M263-CTB488, (2) M263-FB, (3) M248-DY, (4) M248-CTBg, (5) M250-CTBg, (6) M250-FB, (7) M232-FR, (8) M261-FB, (9) M260-CTBg-l, (10) M261-CTB488, (11) M262-CTB488, (12) M271-CTBg-l, (13) M271-CTB488-m. Other conventions are as in Figure 1.
Figure 7 shows 2 additional examples of lateral injections in case M263. A 0.6 mm diameter injection of CTB488 was made in foveal V2d at its rostral border, whereas a much larger FB injection (1.6 mm diameter) was located just medial to it, 0.61–0.79mm caudal to the V2d rostral border, its posterior edge touching the V1/V2 border. Both injections involved a thick and a pale CO stripe and produced dense label in dorsal cortex with similar topographic and areal distributions. Label in ventral cortex from the 2 injections also showed similar areal and topographic distributions, but FB label was significantly sparser in ventral cortex than CTB488 label. Like other foveal injections, label in V2v extended from the V2v rostral border well into V2v, occupying approximately half the width of this area. Both injections showed few labeled cells in MTv (<20 cells), but more significant label, albeit sparse, in ventral MTc.
Our fifth lateral injection case (M231-CTB, not shown), which was located at the V2d rostral border but at slightly more peripheral eccentricities than the other lateral injections, instead showed essentially no labeled cells and fibers in ventral MT and MTc, but otherwise had a label distribution in other ventral cortical areas similar to that of the other foveal injections (Table 2).
Injections Away from the V2d Rostral Border
Eleven tracer injections were placed at ≥0.9–1.2 mm from the V2d rostral border (Table 2). Except for one case (M233-CTB488 whose injection site was located 0.9–1.35 mm posterior to the V2d rostral border), all of these injections produced no label in ventral cortical regions of upper visual field representation (Table 2), but produced significant label in dorsal and, in most cases in ventral, cortical regions representing the lower visual field (e.g. IT). These injections were located well within V2d, between −1.5° and −4° eccentricity, and thus were either “lateral” or “central” injections. Two example injections are shown in Figure 8.Here, an injection of CTB488 was made at the V1/V2 border, 3.1–3.4 mm caudal to the V2d rostral border. This injection involved mainly V2 (layers 1–3), but straddled V1, involving layers 4–6 and possibly just touching the white matter under V1. The other was a FB injection located 1–1.2 mm caudal to the V2d rostral border. Both tracer injections labeled only a few scattered cells in the upper visual field regions of ventral cortex (Table 2). Ventral cortical regions representing the lower visual field (such as IT) showed significant CTB488 label and only a few FB-labeled cells.
Summary of Injection Sites and Topography of Resulting Label in Ventral Cortex
Figure 9 shows a summary diagram of the topographic relationship between the location of the tracer injection sites in V2d (and of one injection in Adl) and labeled intra- and interareal connections in the upper visual field regions of ventral cortex. For clarity of illustration only selected representative cases (n = 13) are included in this figure. The figure shows that tracer injection sites in V2d located ≥0.9–1.2 mm from the V2d rostral border (circles 8–13) did not produce any label in ventral cortical regions representing the upper visual field (except for case M233-CTB488, which is not included in the figure). Medial and central injection sites in V2d (circles 6–7 and circle 5, respectively) located up to a distance of 0.65–1.17 mm from the V2d rostral border produced label in ventral cortical areas of upper visual field representation, including V1v, V2v, V3v (VLPv) and anterior ventral cortex, but not in MTv or MTcv (even though they showed label in the dorsal halves of these areas—not shown in the figure). In areas V2v and V3v (VLPv) the transported label was consistently localized at the border between these 2 areas, which is known to represent the HM. Although the location of the HM in V1 and in anterior ventral cortex could not be identified with accuracy (see Methods), transported label in these areas was found at the presumptive location of the HM.
Lateral injection sites in V2d (circles 1–3) located up to a distance of 0.61–0.79 mm from the V2d rostral border produced a similar areal distribution of label in ventral cortex as the medial injections. Unlike the medial injections, however, lateral injections located at eccentricity ≤1.5° also produced label in ventral MT and MTc. Similar to the medial injections, transported label in V2v and V3v (VLPv) resulting from lateral (foveal) injections was located at the border between these 2 areas, thus presumably involving the HM representation, but it extended farther into both areas than transported label following medial injections. These differences may simply reflect differences in magnification factor between foveal and parafoveal V2. In other areas label was also located at the presumptive location of the HM.
Injections located in cortex just anterior to V2d lateral to presumptive DM+, that is, in Adl (e.g. injection 4 in Fig. 9), showed a similar areal distribution of label as our lateral foveal V2d injections (including very sparse label in MTv and MTcv), with the exception of anterior ventral cortex, which showed no label. Label in V3v (VLPv) however was denser and involved a greater portion of this area than label resulting from the lateral V2d injections.
Intra-areal Connections between V2d and V2v: Local or Horizontal Circuits?
We next addressed the issue of whether connections between dorsal and ventral V2 across the HM representation serve the purpose of SRCs or LRCs elsewhere in V2.
For each case in which label was plotted through an entire series of sections, and for which the injection was in V2d and produced label in V2v (n = 7), we measured the extent (half-width and half-length) of SRCs and LRCs in V2d. For the same cases, we also measured the full length of the composite label at the V2v/V3v (VLPv) border through all cortical layers (i.e. label in each tissue section aligned and collapsed onto one plane) or through layer 4. We measured the length of the labeled field encompassing both V2v and V3v (VLPv) (along its longest axis—see Methods; Table 3), rather than just the length of label in V2v, because we did not want our measurements to be affected by uncertainties in the exact location of the rostral V2v border.
We found no correlation between the extent of the supra- and infragranular layer label in V2v/V3v (VLPv), and the extent of SRC or LRC in V2d. Specifically, the full length of the V2v/V3v label measured about half that of LRC in V2d, but was about 2–3 times longer than the full length of SRC in V2d (Table 3). Even dividing the label into V2v and V3v (VLPv) fields, using criteria described in the Methods to identify the V2v rostral border, yielded no correlation between the extent of LRC or SRC in V2d and that of label in V2v. We thus reasoned that if the purpose of connections between V2d and V2v is to complete the visual classical or nonclassical RF across the HM, then the extent of label in V2v should approximate that of the portion of SRC and/or LRC that is “cut-off” at the V2d rostral border. In other words, label in V2v should represent the “missing” portion of the labeled fields in V2d. It follows that the closer the injection site is to the V2d rostral border, the more extensive would be the portion of the V2d connectional fields (both SRC and LRC) that is “cut-off” at the border, and therefore the longer should be the extent of transported label in V2v. The following were our specific predictions. 1) If connections between V2d and V2v serve the role of SRC across the HM, there will be transported label in all layers of V2v as long as the field of SRC in V2d is cut-off at the V2d rostral border; this label will have similar extent in the different V2v layers, and will disappear when the injection's distance from the V2d rostral border is greater than the half-width of SRC in V2d. This is because at such distance there would be no cut-off, and therefore no missing portion, in the field of SRC in V2d. 2) If, instead, V2d-to-V2v connections serve the role of LRC, there will be transported label in the upper and lower layers of V2v as long as the field of LRC in V2d is cut-off at the V2d rostral border; this upper- and lower-layer label will be more extensive than in V2v layer 4, and will disappear when the injection's distance from the V2d rostral border is greater than the half-width of LRC connections in V2d. 3) If label in upper visual field regions of ventral cortex indeed represents the missing portion of the labeled fields in dorsal cortex, which are cut-off at the HM, then the length of label in ventral cortex will be inversely correlated with the injection's distance from the V2d rostral border.
Across our cases, the half-width of SRC varied from 0.4 to 0.9 mm, and that of LRC from 0.8 to 1.5 mm (in one case, M250-FB, it reached 2 mm). We found label in layer 4 of V2v at injection distances of <0.6–0.9 mm from the V2d rostral border; this label disappeared at injection distances of ≥0.9 mm. Anterograde label in V2v layer 4 resulting from bidirectional tracer injections was more extensive than the retrograde label in this layer, but less extensive than label in the upper and lower layers (Table 3). These non-reciprocal interlaminar projections to layer 4 were also observed in V2d (see “Intra-areal connections” above). We found transported label in the upper and lower layers of V2v for injection distances of <0.9–1.3 mm, but no label in these V2v layers at injection distances of ≥1.2–1.3 mm (Fig. 3 and Table 3). (In case M250-FB, which showed wider LRC (2 mm half-width) and transported label in the supra- and infragranular layers of V2v, the injection's distance from the V2d rostral border was still smaller than the half-width of LRC; see Table 3.) These results suggest that connections between V2d and layer 4 of V2v serve the purpose of local circuits across the HM, whereas connections with supra- and infragranular V2v layers in addition serve the purpose of LRCs across the HM.
To quantitatively assess our third prediction, we examined how the length of label at the V2v/V3v border varied with the distance of the injection site from the V2d rostral border. Again, we did not attempt to measure the length of label specifically in V2v, because this measure could be affected by uncertainties in the position of the rostral V2v border. We argue that this is acceptable, because like the label in V2v, the length of interareal label should also show an inverse correlation with the injection distance from the V2d rostral border. This analysis was performed on the cases shown in Table 3, plus one additional case (M271-CTBg-l) which, among the cases showing no label in ventral cortex, was the one with the injection site nearest to the V2d rostral border. As predicted, we found that the distance of the injection site from the V2d rostral border was significantly and inversely correlated with the length of supra- and infragranular layer label at the V2v/V3v border. In Figure 10a the distance of the injection from the V2d rostral border is expressed as absolute distance, whereas in Figure 10b the injection's distance is normalized to the width of V2d. We used 2 additional measures of the position of the injection site in V2d (not shown in Fig. 10): the absolute distance of the rostral edge of the injection site from the V1/V2 border (a border that can be localized with great accuracy in CO—see Fig. 2), and the same distance normalized to the width of V2d at the position of the injection site. We found no correlation (r = −0.38, P = 0.349; Pearson's correlation) between the length of V2v/V3v label and the absolute distance of the injection site from the V1/V2 border. An obvious explanation for this finding is that, because the V1/V2 border is curved, the distance of the injection site from this border is not indicative of how close the injection is to the HM representation at the V2d rostral border. However, the length of label in V2v/V3v was inversely correlated with all 3 other measures of the location of the injection site in V2d, being slightly less well correlated with the absolute distance of the injection from the V2d rostral border (Fig. 10a; r = −0.71, P = 0.051) than with the 2 normalized distances (Fig. 10b; r = 0.76, P = 0.028). We conclude that the farther the injection from the V2d rostral border, the shorter the length of label in V2v/V3v, until a distance is reached of about 1.2–1.3 mm where there is no longer any label in V2v/V3v. These results suggest that label in ventral cortex indeed represents the “missing” portion of the field of LRC in V2d across the HM.
Discussion
We have shown that neurons located at/near the HM representation in cortex representing the lower visual field make local and long-range intra- and interareal connections with cortical regions representing the upper visual field. Local circuits between V2d and layer 4 of V2v are made by neurons located within 0.6–0.9 mm of the V2d rostral border, whereas horizontal connections between the supra- and infragranular layers of V2d and V2v are made by neurons located within 0.9–1.3 mm of the V2d rostral border. These local and long-range connections between regions of upper and lower visual field are ideally suited to create retinotopic continuity within the classical and extra-classical RF of neurons located near the discontinuous representation of the HM.
Connections between dorsal and ventral V2 across the HM Representation
To date, no study has addressed in a systematic fashion the topography of connections made by neurons with RFs near the HM. Previous reports of connections between dorsal and ventral V2 have been sporadic and the results inconsistent. Early studies suggested the existence of connections between V2d and V2v. Specifically, after lesions in macaque V2d, Zeki (1971) found degenerating fibers at the ventral half of the area 18/19 border, but believed this was due to the lesion having involved area 19. An early study in squirrel monkey (Tigges et al. 1974) observed degenerating fibers in ventral cortex, but only when the heat lesions involved the white matter. Furthermore, in the latter study the extent of the lesions with respect to the rostral V2d border was not verified histologically, thus the ventral focus of degeneration could have resulted from the lesion involving the upper visual field of area DM. Later studies, using modern tract-tracing techniques, did not confirm these early observations. In particular, more recent work in squirrel and macaque monkeys suggested that connections between the upper and lower visual field representations may only exist at the foveal representation of V2 (Cusick and Kaas 1988; Stepniewska and Kaas 1996; Felleman et al. 1997; Gattas et al. 1997). However, in several of those studies either the tracers were not injected in more peripheral locations of V2d near the V2d rostral border (Cusick and Kaas 1988; Stepniewska and Kaas 1996), or the eccentricity of some of the tracer injections that produced label in V2v was not reported (Felleman et al. 1997). Of 5 tracer injections placed near the HM representation in macaque V2, Gattass et al. (1997) found projections to ventral cortex (V1v, V2v, and V4v) only from one central (−2.6° eccentricity) injection, but not from a second central (+3.5° eccentricity) injection or from 3 peripheral (>15° eccentricity) injections. A more recent study in bush baby (Collins et al. 2001) showed projections from dorsal to ventral V2 following tracer injections located at more peripheral locations, but just posterior to the upper visual field representation of area DM, which thus could have been involved by the injection sites. Indeed, one interpretation for the inconsistent finding across studies of connections between V2d and V2v at the HM representation has been that these connections in fact represented projections to V2v from DM+, which was involved by the tracer injections (e.g. Rosa 1997). Similarly, connections between V2d and V2v at the foveal representation could result from the injections involving regions of both upper and lower visual field representation across the HM separating V2d from V2v.
In this study we have shown that both intra- and interareal connections between regions of upper and lower visual field representation occur at all eccentricities within the central 8° of visual field representation (we did not inject more peripheral locations), provided that the tracer injections are located within 0.9–1.3 mm of the V2d rostral border. Importantly, we have demonstrated that these connections also arise from regions of V2d known to exclusively abut areas of lower visual field representation (i.e. medially and laterally to the presumptive location of the upper visual field representation in area DM).
Intra-areal V2 Connections Across the HM Representation: Local or Long-Range Circuits?
To determine whether connections between V2d and V2v across the HM representation represent local or long-range horizontal circuits, we took advantage of known laminar differences in lateral axonal spread previously reported for V2. Specifically, although pyramidal cells in the supra- and infragranular layers of V2 send LRCs, the axons of neurons in layer 4 show very little lateral spread (Levitt et al. 1994). We found that label in layer 4 of V2v was of smaller extent than in the other V2v layers, and that it occurred only at injection distances of <0.6–0.9 mm from the V2d rostral border, which approximately corresponded to the half-width of SRCs in V2d across our population. Using previously published values (Rosa et al. 1997) of cortical magnification factor (CMF) along the width of marmoset V2 (CMF = 0.9 mm/° and 0.28 mm/° at 1° and 6°, respectively) and minimum RF size (mRF radius = 0.45° and 1.3° at 1° and 6°, respectively), one can estimate that the distance at which the mRFs of neurons at the edge of the injection site just cross the HM is about 0.4 mm. We (Tang et al. 2005) previously showed that in macaque V2 RF size measured using high contrast grating patches of increasing diameter is approximately twice as large as the mRF size (which is measured using small stimuli) for the same cells. Assuming a similar ratio in marmoset V2, then the distance at which the RF size of neurons at the edge of the injection site just cross the HM would be about 0.8 mm. This is approximately the distance at which injections in V2d no longer produced label in layer 4 of V2v. This suggests that connections between V2d and layer 4 of V2v are made by neurons whose RFs cross the HM, and link neurons with overlapping RFs, that is, they are local circuits.
On the other hand, label in the upper and lower V2v layers was of greater extent than in layer 4, and occurred at injection distances of <0.9–1.3 mm from the V2d rostral border, which approximately corresponded to the half-width of horizontal connections in V2d across our population. Again, using CMF and mRF sizes for marmoset V2, we estimated that 1.3 mm corresponds to over 3 times the mRF radius of neurons at the edge of the tracer injection; this suggests that connections between V2d and the upper and lower V2v layers are made by neurons whose RFs do not cross the HM, and link neurons with retinotopically mismatched mRFs, that is, they are horizontal connections.
We also found that the extent of label in the upper and lower layers of V2v/V3v was inversely correlated with the distance of the injection site from the V2d rostral border, but not with the injection's distance from the V2d caudal border. This suggests that connections between V2d and upper visual field regions of ventral cortex “complete” across the HM the “missing” portion of the connectional fields in dorsal cortex that are cut off at the V2d rostral border.
Interareal V2 Connections at the HM Representation
We have shown that V2 neurons located within 1.2–1.3 mm of the V2d rostral border also make interareal connections with regions of upper visual field representation near the HM in the ventral halves of areas V1, V3 (VLP) and anterior ventral cortex. However, with the exception of the foveal representation, V2 neurons near the rostral V2d border do not make connections with ventral MT and MTc.
Why would some, but not all cortical areas show connections between V2d and upper visual field regions of ventral cortex at the HM? One could argue that we simply did not correctly locate the HM in these areas. This is unlikely for MTc whose dorsal and ventral halves are unmistakably located above and below MT. Although the position of the HM in MT is more difficult to locate accurately, injections that involved presumptive DM+ clearly labeled ventral MT, suggesting that in our material we could distinguish between MTd and MTv.
In the marmoset, in areas that have a second-order transformation of the visual field, a strip of cortex near the HM is represented twice, both dorsally and ventrally. In V2 this double representation is about 1° wide (=0.9 mm of cortex) at the fovea and 2° wide (=0.5 mm of cortex) at 7–10° eccentricity (Rosa et al. 1997), whereas in V3 (VLP) and anterior ventral cortex it is wider (about 2° wide at the fovea; Rosa and Tweedale 2000). One hypothesis is that interareal connections between V2d and ventral cortex represent retinotopic connections between these cortical regions of double representation; this may also explain why upper visual field regions of cortical areas that have a first-order transformation of the visual field, such as MT, do not show connections with V2d. Although connections between cortical regions of double representation near the HM may indeed exist, our results indicate that connections between lower visual field regions of V2d and upper visual field regions of ventral cortex extend beyond the strip of double representation. In V2d the latter is about 0.5 mm wide at 7–10° eccentricity, yet we found connections with ventral cortex from tracer injections located outside this region, that is, up to 0.9–1.3 mm caudal to the V2d rostral border, indicating nonretinotopic connections. Furthermore, V2d showed connections with upper visual field regions of V1, an area that, like MT, has a first-order transformation of the visual field. In contrast, area MTc, despite having a second-order transformation of the visual field and a double representation of visual field regions near the HM (Rosa and Elston 1998), like MT did not show connections between V2d and its ventral half outside the foveal region. An alternative explanation for why ventral MT and MTc did not show connections with V2d outside the foveal representation is that the large nonfoveal RFs of MT and MTc neurons near the HM cross the latter to include fairly large portions of the upper visual field (Rosa and Elston 1998). The large RFs of these feedback neurons are well suited to maintain retinotopic continuity of the V2d cells extra-classical RF across the HM; thus, additional input from ventral MT and MTc may simply not be needed.
Whereas tracer injections in marmoset MT have demonstrated a precise topographic organization of its connections (Palmer and Rosa 2006a, 2006b), the few published data on marmoset MTc seem to indicate an irregular representation of the visual field in this area (Rosa and Elston 1998), and loose topography of its connections. Specifically, injections in the upper visual field regions of V1 and DM either failed to label MTc, or showed a bias in connectivity with the lower visual field representation of MTc (Lyon and Kaas 2001; M.G.P. Rosa, personal communication). Such a bias in the connectivity of MTc with the lower visual field representation of early visual cortical areas may represent an additional explanation for the lack of connections between V2d and ventral MTc observed in this study.
Conclusions
Our results indicate that, like V2 callosal connections across the VM, V2 neurons located near the discontinuous representation of the HM maintain retinotopic continuity within and outside their classical RF, by making both local and long-range intra- and interareal connections with neurons in ventral cortex representing the upper visual quadrant. It is possible that such continuity provides a means for figure ground segregation and/or binding of similar image features across the HM.
Supplementary Material
Supplementary material can be found at: http://www.cercor.oxfordjournals.org/.
Funding
National Science Foundation (IBN0344569) to A.A.; National Eye Institute (EY015262) to A.A. and (EY015609) to J.I.; and Research to Prevent Blindness, Inc., grant to the Department of Ophthalmology, University of Utah.
Acknowledgments
We thank Kesi Sainsbury for expert technical assistance. Conflict of Interest: None declared.
References
- Abel PL, O'Brien BJ, Olavarria JF. Organization of callosal linkages in visual area V2 of macaque monkey. J Comp Neurol. 2000;428:278–293. doi: 10.1002/1096-9861(20001211)428:2<278::aid-cne7>3.0.co;2-r. [DOI] [PubMed] [Google Scholar]
- Allman JM, Kaas JH. Representation of the visual field in striate and adjoining cortex of the owl monkey (Aotus trivirgatus) Brain Res. 1971;35:89–106. doi: 10.1016/0006-8993(71)90596-8. [DOI] [PubMed] [Google Scholar]
- Allman JM, Kaas JH. The organization of the second visual area (V II) in the owl monkey: a second order transformation of the visual hemifield. Brain Res. 1974;76:247–265. doi: 10.1016/0006-8993(74)90458-2. [DOI] [PubMed] [Google Scholar]
- Allman JM, Kaas JH. The dorsomedial cortical visual area: a third tier area in the occipital lobe of the owl monkey (Aotus trivirgatus) Brain Res. 1975;100:473–487. doi: 10.1016/0006-8993(75)90153-5. [DOI] [PubMed] [Google Scholar]
- Angelucci A, Bressloff PC. The contribution of feedforward, lateral and feedback connections to the classical receptive field center and extra-classical receptive field surround of primate V1 neurons. Prog Brain Res. 2006;154:93–121. doi: 10.1016/S0079-6123(06)54005-1. [DOI] [PubMed] [Google Scholar]
- Angelucci A, Clasca F, Sur M. Anterograde axonal tracing with the subunit B of cholera toxin: a highly sensitive immunohistochemical protocol for revealing fine axonal morphology in adult and neonatal brains. J Neurosci Methods. 1996;65:101–112. doi: 10.1016/0165-0270(95)00155-7. [DOI] [PubMed] [Google Scholar]
- Beck PD, Kaas JH. Cortical connections of the dorsomedial visual area in new world owl monkeys (Aotus trivirgatus) and squirrel monkeys (Saimiri sciureus) J Comp Neurol. 1998;400:18–34. doi: 10.1002/(sici)1096-9861(19981012)400:1<18::aid-cne2>3.0.co;2-w. [DOI] [PubMed] [Google Scholar]
- Bosking WH, Kretz R, Pucak ML, Fitzpatrick D. Functional specificity of callosal connections in tree shrew striate cortex. J Neurosci. 2000;20:2346–2359. doi: 10.1523/JNEUROSCI.20-06-02346.2000. [DOI] [PMC free article] [PubMed] [Google Scholar]
- Brandt HM, Apkarian AV. Biotin-dextran: a sensitive anterograde tracer for neuroanatomic studies in rat and monkey. J Neurosci Methods. 1992;45:35–40. doi: 10.1016/0165-0270(92)90041-b. [DOI] [PubMed] [Google Scholar]
- Burkhalter A, Felleman DJ, Newsome WT, Van Essen DC. Anatomical and physiological asymmetries related to visual areas V3 and VP in macaque extrastriate cortex. Vision Res. 1986;26:63–80. doi: 10.1016/0042-6989(86)90071-4. [DOI] [PubMed] [Google Scholar]
- Collins CE, Stepniewska I, Kaas JH. Topographic patterns of v2 cortical connections in a prosimian primate (Galago garnetti) J Comp Neurol. 2001;431:155–167. [PubMed] [Google Scholar]
- Conde F. Further studies on the use of the fluorescent tracers fast blue and diamidino yellow: effective uptake area and cellular storage sites. J Neurosci Methods. 1987;21:31–43. doi: 10.1016/0165-0270(87)90100-2. [DOI] [PubMed] [Google Scholar]
- Cragg BG. The topography of the afferent projections in the circumstriate visual cortex of the monkey studied by the Nauta method. Vision Res. 1969;9:733–747. doi: 10.1016/0042-6989(69)90011-x. [DOI] [PubMed] [Google Scholar]
- Cusick CG, Gould HJ, 3rd, Kaas JH. Interhemispheric connections of visual cortex of owl monkeys (Aotus trivirgatus), marmosets (Callithrix jacchus), and galagos (Galago crassicaudatus) J Comp Neurol. 1984;230:311–336. doi: 10.1002/cne.902300302. [DOI] [PubMed] [Google Scholar]
- Cusick CG, Kaas JH. Cortical connections of area 18 and dorsolateral visual cortex in squirrel monkeys. Vis Neurosci. 1988;1:211–237. doi: 10.1017/s0952523800001486. [DOI] [PubMed] [Google Scholar]
- Desimone R, Ungerleider LG. Multiple visual areas in the caudal superior temporal sulcus of the macaque. J Comp Neurol. 1986;248:164–189. doi: 10.1002/cne.902480203. [DOI] [PMC free article] [PubMed] [Google Scholar]
- Ericson H, Blomqvist A. Tracing of neuronal connections with cholera toxin subunit B: light and electron microscopic immunohistochemistry using monoclonal antibodies. J Neurosci Methods. 1988;24:225–235. doi: 10.1016/0165-0270(88)90167-7. [DOI] [PubMed] [Google Scholar]
- Federer F, Ichida JM, Jeffs J, Angelucci A. Three separate streams of anatomical projections from primary visual cortex to the cytochrome oxidase stripes of marmoset area V2. Soc Neurosci Abstr Online. 2007;122.3 [Google Scholar]
- Federer FC, Ichida JM, Jeffs J, Angelucci A Forthcoming. Multiple output pathways from V1 layer 4B to V2 CO stripes. Soc Neurosci Abstr Online. 2008 [Google Scholar]
- Felleman DJ, Burkhalter A, Van Essen DC. Cortical connections of areas V3 and VP of macaque monkey extrastriate visual cortex. J Comp Neurol. 1997;379:21–47. doi: 10.1002/(sici)1096-9861(19970303)379:1<21::aid-cne3>3.0.co;2-k. [DOI] [PubMed] [Google Scholar]
- Fritsches KA, Rosa MG. Visuotopic organisation of striate cortex in the marmoset monkey (Callithrix jacchus) J Comp Neurol. 1996;372:264–282. doi: 10.1002/(SICI)1096-9861(19960819)372:2<264::AID-CNE8>3.0.CO;2-1. [DOI] [PubMed] [Google Scholar]
- Gattass R, Gross CG, Sandell JH. Visual topography of V2 in the macaque. J Comp Neurol. 1981;201:519–539. doi: 10.1002/cne.902010405. [DOI] [PubMed] [Google Scholar]
- Gattass R, Sousa AP, Gross CG. Visuotopic organization and extent of V3 and V4 of the macaque. J Neurosci. 1988;8:1831–1845. doi: 10.1523/JNEUROSCI.08-06-01831.1988. [DOI] [PMC free article] [PubMed] [Google Scholar]
- Gattas R, Sousa AP, Mishkin M, Ungerleider LG. Cortical projections of area V2 in the macaque. Cereb Cortex. 1997;7:110–129. doi: 10.1093/cercor/7.2.110. [DOI] [PubMed] [Google Scholar]
- Gould HJ, 3rd, Weber JT, Rieck RW. Interhemispheric connections in the visual cortex of the squirrel monkey (Saimiri sciureus) J Comp Neurol. 1987;256:14–28. doi: 10.1002/cne.902560103. [DOI] [PubMed] [Google Scholar]
- Horton JC, Hubel DH. Regular patchy distribution of cytochrome oxidase staining in primary visual cortex of macaque monkey. Nature. 1981;292:762–764. doi: 10.1038/292762a0. [DOI] [PubMed] [Google Scholar]
- Humphrey AL, Hendrickson AE. Background and stimulus-induced patterns of high metabolic activity in the visual cortex (area 17) of the squirrel and macaque monkey. J Neurosci. 1983;3:345–358. doi: 10.1523/JNEUROSCI.03-02-00345.1983. [DOI] [PMC free article] [PubMed] [Google Scholar]
- Jeffs J, Ichida JM, Angelucci A. Additional anatomical evidence for an upper and lower visual field representation bordering dorsal V2 in the marmoset. Soc Neurosci Abstr Online. 2005 Program No. 854.11. [Google Scholar]
- Kaas JH. Theories of visual cortex organization in primates. In: Rockland KS, Kaas JH, Peters A, editors. Extrastriate cortex in primates. New York: Plenum Press; 1997. pp. 91–125. [Google Scholar]
- Kaas JH, Lin C-S. Cortical connections of area 18 in owl monkeys. Vis Res. 1977;17:739–741. doi: 10.1016/s0042-6989(77)80013-8. [DOI] [PubMed] [Google Scholar]
- Kaas JH, Morel A. Connections of visual areas of the upper temporal lobe of owl monkeys: the MT crescent and dorsal and ventral subdivisions of FST. J Neurosci. 1993;13:534–546. doi: 10.1523/JNEUROSCI.13-02-00534.1993. [DOI] [PMC free article] [PubMed] [Google Scholar]
- Keizer K, Kuypers HG, Huisman AM, Dann O. Diamidino yellow dihydrochloride (DY. 2HCl); a new fluorescent retrograde neuronal tracer, which migrates only very slowly out of the cell. Exp Brain Res. 1983;51:179–191. doi: 10.1007/BF00237193. [DOI] [PubMed] [Google Scholar]
- Kennedy H, Bullier J. A double-labeling investigation of the afferent connectivity to cortical areas V1 and V2 of the macaque monkey. J Neurosci. 1985;5:2815–2830. doi: 10.1523/JNEUROSCI.05-10-02815.1985. [DOI] [PMC free article] [PubMed] [Google Scholar]
- Kennedy H, Dehay C. Functional implications of the anatomical organization of the callosal projections of visual areas V1 and V2 in the macaque monkey. Behav Brain Res. 1988;29:225–236. doi: 10.1016/0166-4328(88)90027-7. [DOI] [PubMed] [Google Scholar]
- Kennedy H, Dehay C, Bullier J. Organization of the callosal connections of visual areas V1 and V2 in the macaque monkey. J Comp Neurol. 1986;247:398–415. doi: 10.1002/cne.902470309. [DOI] [PubMed] [Google Scholar]
- Krubitzer LA, Kaas JH. Convergence of processing channels in the extrastriate cortex of monkeys. Vis Neurosci. 1990a;5:609–613. doi: 10.1017/s0952523800000778. [DOI] [PubMed] [Google Scholar]
- Krubitzer LA, Kaas JH. Cortical connections of MT in four species of primates: areal, modular and retinotopic patterns. Vis Neurosci. 1990b;5:165–204. doi: 10.1017/s0952523800000213. [DOI] [PubMed] [Google Scholar]
- Krubitzer LA, Kaas JH. The dorsomedial visual area of owl monkeys: connections, myeloarchitecture, and homologies in other primates. J Comp Neurol. 1993;334:497–528. doi: 10.1002/cne.903340402. [DOI] [PubMed] [Google Scholar]
- Levitt JB, Yoshioka T, Lund JS. Intrinsic cortical connections in macaque visual area V2: evidence for interaction between different functional streams. J Comp Neurol. 1994;342:551–570. doi: 10.1002/cne.903420405. [DOI] [PubMed] [Google Scholar]
- Lewis JW, Olavarria JF. Two rules for callosal connectivity in striate cortex of the rat. J Comp Neurol. 1995;361:119–137. doi: 10.1002/cne.903610110. [DOI] [PubMed] [Google Scholar]
- Llewellyn-Smith IJ, Minson JB, Wright AP, Hodgson AJ. Cholera toxin B-gold, a retrograde tracer that can be used in light and electron microscopic immunocytochemical studies. J Comp Neurol. 1990;294:179–191. doi: 10.1002/cne.902940203. [DOI] [PubMed] [Google Scholar]
- Lund JS, Angelucci A, Bressloff PC. Anatomical substrates for functional columns in macaque monkey primary visual cortex. Cereb Cortex. 2003;13:15–24. doi: 10.1093/cercor/13.1.15. [DOI] [PubMed] [Google Scholar]
- Lund JS, Lund RD, Hendrickson AE, Bunt AH, Fuchs AF. The origin of efferent pathways from primary visual cortex, area 17, of the macaque monkey as shown by retrograde transport of horseradish peroxidase. J Comp Neurol. 1975;164:287–304. doi: 10.1002/cne.901640303. [DOI] [PubMed] [Google Scholar]
- Luppi PH, Fort P, Jouvet M. Iontophoretic application of unconjugated cholera toxin B subunit (CTb) combined with immunohistochemistry of neurochemical substances: a method for transmitter identification of retrogradely labeled neurons. Brain Res. 1990;534:209–224. doi: 10.1016/0006-8993(90)90131-t. [DOI] [PubMed] [Google Scholar]
- Lyon DC, Kaas JH. Connectional and architectonic evidence for dorsal and ventral V3, and dorsomedial area in marmoset monkeys. J Neurosci. 2001;21:249–261. doi: 10.1523/JNEUROSCI.21-01-00249.2001. [DOI] [PMC free article] [PubMed] [Google Scholar]
- Lyon DC, Kaas JH. Evidence for a modified V3 with dorsal and ventral halves in macaque monkeys. Neuron. 2002;33:453–461. doi: 10.1016/s0896-6273(02)00580-9. [DOI] [PubMed] [Google Scholar]
- Malach R, Tootell RB, Malonek D. Relationship between orientation domains, cytochrome oxidase stripes, and intrinsic horizontal connections in squirrel monkey area V2. Cereb Cortex. 1994;4:151–165. doi: 10.1093/cercor/4.2.151. [DOI] [PubMed] [Google Scholar]
- Myers RE. Commissural connections between occipital lobes of the monkey. J Comp Neurol. 1962;118:1–16. doi: 10.1002/cne.901180102. [DOI] [PubMed] [Google Scholar]
- Olavarria JF. Non-mirror-symmetric patterns of callosal linkages in areas 17 and 18 in cat visual cortex. J Comp Neurol. 1996;366:643–655. doi: 10.1002/(SICI)1096-9861(19960318)366:4<643::AID-CNE6>3.0.CO;2-4. [DOI] [PubMed] [Google Scholar]
- Palmer SM, Rosa MG. Quantitative analysis of the corticocortical projections of the middle temporal area in the marmoset monkey: evolutionary and functional implications. Cereb Cortex. 2006a;16:1361–1375. doi: 10.1093/cercor/bhj078. [DOI] [PubMed] [Google Scholar]
- Palmer SM, Rosa MG. A distinct anatomical network of cortical areas for analysis of motion in far peripheral vision. Eur J Neurosci. 2006b;24:2389–2405. doi: 10.1111/j.1460-9568.2006.05113.x. [DOI] [PubMed] [Google Scholar]
- Perkel DJ, Bullier J, Kennedy H. Topography of the afferent connectivity of area 17 in the macaque monkey: a double-labelling study. J Comp Neurol. 1986;253:374–402. doi: 10.1002/cne.902530307. [DOI] [PubMed] [Google Scholar]
- Rockland KS. A reticular pattern of intrinsic connections in primate area V2 (area 18) J Comp Neurol. 1985;235:467–478. doi: 10.1002/cne.902350405. [DOI] [PubMed] [Google Scholar]
- Rosa MG, Fritsches KA, Elston GN. The second visual area in the marmoset monkey: visuotopic organisation, magnification factors, architectonical boundaries, and modularity. J Comp Neurol. 1997;387:547–567. doi: 10.1002/(sici)1096-9861(19971103)387:4<547::aid-cne6>3.0.co;2-2. [DOI] [PubMed] [Google Scholar]
- Rosa MG, Palmer SM, Gamberini M, Tweedale R, Pinon MC, Bourne JA. Resolving the organization of the New World monkey third visual complex: the dorsal extrastriate cortex of the marmoset (Callithrix jacchus) J Comp Neurol. 2005;483:164–191. doi: 10.1002/cne.20412. [DOI] [PubMed] [Google Scholar]
- Rosa MG, Schmid LM. Visual areas in the dorsal and medial extrastriate cortices of the marmoset. J Comp Neurol. 1995;359:272–299. doi: 10.1002/cne.903590207. [DOI] [PubMed] [Google Scholar]
- Rosa MG, Tweedale R. Visual areas in lateral and ventral extrastriate cortices of the marmoset monkey. J Comp Neurol. 2000;422:621–651. doi: 10.1002/1096-9861(20000710)422:4<621::aid-cne10>3.0.co;2-e. [DOI] [PubMed] [Google Scholar]
- Rosa MGP. Visuotopic organization of primate extrastriate cortex. In: Rockland KS, Kaas JH, Peters A, editors. Extrastriate cortex in primates. New York (NY): Plenum; 1997. pp. 127–203. [Google Scholar]
- Rosa MGP, Elston GN. Visuotopic organisation and neuronal response selectivity for direction of motion in visual areas of the caudal temporal lobe of the marmoset monkey (Callithrix jacchus): middle temporal area, middle temporal crescent, and surrounding cortex. J Comp Neurol. 1998;393:505–527. [PubMed] [Google Scholar]
- Sereno MI, McDonald CT, Allman JM. Analysis of retinotopic maps in extrastriate cortex. Cereb Cortex. 1994;4:601–620. doi: 10.1093/cercor/4.6.601. [DOI] [PubMed] [Google Scholar]
- Sincich LC, Horton JC. Divided by cytochrome oxidase: a map of the projections from V1 to V2 in macaques. Science. 2002;295:1734–1737. doi: 10.1126/science.1067902. [DOI] [PubMed] [Google Scholar]
- Spatz WB, Tigges J, Tigges M. Subcortical projections, cortical associations, and some intrinsic interlaminar connections of the striate cortex in the squirrel monkey (Saimiri) J Comp Neurol. 1970;140:155–174. doi: 10.1002/cne.901400203. [DOI] [PubMed] [Google Scholar]
- Stepniewska I, Kaas JH. Topographic patterns of V2 cortical connections in macaque monkeys. J Comp Neurol. 1996;371:129–152. doi: 10.1002/(SICI)1096-9861(19960715)371:1<129::AID-CNE8>3.0.CO;2-5. [DOI] [PubMed] [Google Scholar]
- Tang Z-H, Ichida JM, Jeffs J, Levitt JB, Angelucci A. Spatial extent of the receptive field center and surround of macaque V2 neurons. Soc Neurosci Abstr Online. 2005;389.7 [Google Scholar]
- Tigges J, Spatz WB, Tigges M. Efferent cortico-cortical fiber connections of area 18 in the squirrel monkey (Saimiri) J Comp Neurol. 1974;158:219–235. doi: 10.1002/cne.901580208. [DOI] [PubMed] [Google Scholar]
- Tigges J, Tigges M, Anschel S, Cross NA, Letbetter WD, McBride RL. Areal and laminar distribution of neurons interconnecting the central visual cortical areas 17, 18, 19, and MT in squirrel monkey (Saimiri) J Comp Neurol. 1981;202:539–560. doi: 10.1002/cne.902020407. [DOI] [PubMed] [Google Scholar]
- Tootell RB, Silverman MS, De Valois RL, Jacobs GH. Functional organization of the second cortical visual area in primates. Science. 1983;220:737–739. doi: 10.1126/science.6301017. [DOI] [PubMed] [Google Scholar]
- Tootell RBH, Hamilton SL, Silverman MS. Topography of cytochrome oxidase activity in owl monkey cortex. J Neurosci. 1985;5:2786–2800. doi: 10.1523/JNEUROSCI.05-10-02786.1985. [DOI] [PMC free article] [PubMed] [Google Scholar]
- Van Essen DC, Newsome WT, Bixby JL. The pattern of interhemispheric connections and its relationship to extrastriate visual areas in the macaque monkey. J Neurosci. 1982;2:265–283. doi: 10.1523/JNEUROSCI.02-03-00265.1982. [DOI] [PMC free article] [PubMed] [Google Scholar]
- Van Essen DC, Zeki SM. The topographic organization of rhesus monkey prestriate cortex. J Physiol. 1978;277:193–226. doi: 10.1113/jphysiol.1978.sp012269. [DOI] [PMC free article] [PubMed] [Google Scholar]
- Wong-Riley M. Changes in the visual system of monocularly sutured or enucleated cats demonstrable with cytochrome oxidase histochemistry. Brain Res. 1979;171:11–28. doi: 10.1016/0006-8993(79)90728-5. [DOI] [PubMed] [Google Scholar]
- Zeki SM. Interhemispheric connections of prestriate cortex in monkey. Brain Res. 1970;19:63–75. doi: 10.1016/0006-8993(70)90237-4. [DOI] [PubMed] [Google Scholar]
- Zeki SM. Cortical projections from two prestriate areas in the monkey. Brain Res. 1971;34:19–35. doi: 10.1016/0006-8993(71)90348-9. [DOI] [PubMed] [Google Scholar]
- Zeki SM. Simultaneous anatomical demonstration of the representation of the vertical and horizontal meridians in areas V2 and V3 of rhesus monkey visual cortex. Proc R Soc Lond B Biol Sci. 1977;195:517–523. doi: 10.1098/rspb.1977.0024. [DOI] [PubMed] [Google Scholar]
Associated Data
This section collects any data citations, data availability statements, or supplementary materials included in this article.