

Abstract
Objective. To study the HRQOL in veterans with prevalent total knee arthroplasty (TKA) or total hip arthroplasty (THA) and compare them with age- and gender-matched US population and control veteran population without these procedures.
Methods. A cohort study and cross-sectional survey on veterans obtained demographics and HRQOL with Short-Form 36 for veterans (SF-36V). Veterans were categorized into: primary TKA; primary THA; combination group (≥1 primary and/or any revision TKA/THA); and control population (no THA/TKA). Multivariable regression compared the physical and mental component summary scores (PCS and MCS scores, respectively) in each group.
Results. Response rate was 58% (40 508/70 334): 531 with TKA, 254 with THA, 461 constituted the combination and 39 262, the control group. Mean PCS scores in veterans with THA, TKA, and combination group were 2 s.d. lower than the US mean (29.5 ± 0.8; 30.1 ± 1.1 and 27.1 ± 0.8). MCS scores were similar to the US mean (47.3 ± 0.9; 49.1 ± 1.2 and 45.6 ± 0.9). Compared with controls, significantly more veterans in TKA, THA or combination groups had multivariable-adjusted PCS ≤ 30 (55, 64, 71 and 76%; P < 0.0001); similar proportion had MCS ≤ 30 (15, 12, 8 and 16%; P = 0.29); and mean scores on SF-36 physical domains (P ≤ 0.0011), but not mental/emotional domains (P ≥ 0.01) were statistically and clinically lower.
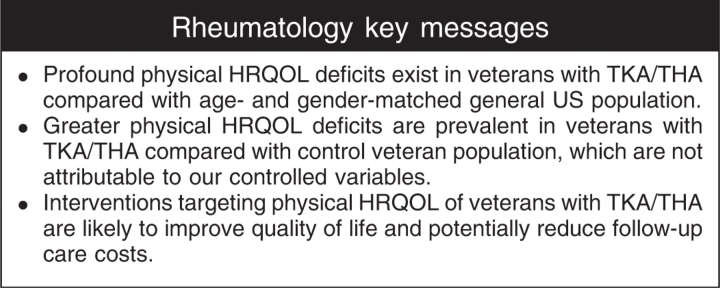
Conclusions. Profound physical HRQOL deficits exist in veterans with TKA/THA and in combination group compared with age- and gender-matched general US population and with veteran controls. In these groups, these deficits are not attributable to differences in sociodemographics, comorbidity and healthcare access/utilization. Arthroplasty status may be a surrogate for poorer HRQOL and worse outcomes. Future studies are indicated to determine HRQOL deficit causes and interventions to improve HRQOL in patients with arthroplasty.
Keywords: Health related quality of life, Veterans, Total knee arthroplasty, Total hip arthroplasty
Introduction
Total knee arthroplasty (TKA) and total hip arthroplasty (THA) are among the most common orthopaedic procedures performed in the United States to relieve pain and improve the function of patients with end-stage arthritis [1]. OA, the most common underlying arthritic diagnosis in patients undergoing TKA or THA, is the fifth most common condition among veterans [2] and arthritis ranked among the top five conditions among the 3.4 million veterans who received care in fiscal year 1999 [3]. Approximately 208 600 primary THA and 402 100 primary TKA procedures were performed in the United States in 2005, projected to increase by 174% to 572 000 primary THA and 673% to 3.48 million primary TKA procedures per year by 2030 [4]. With increasing longevity and younger age at procedure, the number of revision THA and TKA procedures is also projected to increase by 137% and 601% by 2030 [4].
TKA and THA are associated with significant improvement in pain, function and health-related quality of life (HRQOL) comparing pre- with post-surgery scores [5–11]. Very few studies have reported the HRQOL of patients with prevalent TKA or THA, and even fewer have compared that with control population without these procedures or with the age- and gender-matched general population. We know of no other large survey study using the Short Form-36 or Short Form-36 for veterans (SF-36® or SF-36V) that examined HRQOL in prevalent TKA/THA compared with a control group controlled for demographic, comorbidity and health care access/utilization. Most of the previous studies did not include community-based sample, but rather hospital-based samples. A community-based approach asks the specific questions: i.e. what is the health status of patients with THA or TKA living in the community and how does it compare with the rest of the population?
The current data regarding HRQOL of TKA/THA patients compared with the general population is contradictory, with some studies showing a similar [6, 12, 13] and some a lower HRQOL than population norms [7, 14]. Four of these five studies used SF-36® [7, 12–14]. The follow-up duration was variable, 3 months to 10 yrs [12, 13] vs 6 months to 1 yr [7, 14]. All studies had sample sizes of <600 subjects and all except one study [14] included hospital-based rather than community-based cohorts, thereby introducing a referral bias. Many studies assessed only THA [13] or only TKA [12]. Thus, studies of community-based cohorts of patients with prevalent TKA/THA are needed to better understand HRQOL of this cohort.
In a population-based cohort of veterans with TKA or THA, our objectives were to: (i) describe physical and mental/emotional HRQOL; (ii) compare the physical and mental/emotional HRQOL with a control veteran population (controlling for sociodemographics, comorbidity and health care access/utilization) and to age- and gender-matched US general population.
Methods
Population
A cohort of veterans utilizing Upper Midwest Veterans Integrated Service Network (VISN-13: Minnesota, North Dakota and South Dakota, and selected counties in Iowa, Nebraska, Wisconsin and Wyoming) for healthcare services between 1 October 1996 and 31 March 1998 with valid mailing addresses was identified. We conducted a cross-sectional survey by mail: querying demographics, self-reported physician-diagnosed comorbidity and HRQOL using SF-36V (Details previously published as VISN 13 Veterans Quality of Life Study [15]). Non-responders received the same survey 10 weeks after the first mailing. The study was approved by the Minneapolis VA Institutional Review Board (IRB). Based on the survey content, the IRB felt consent was not necessary and waived it.
Data sources
Survey
Demographic questions included: education level, race and current use of cigarettes. SF-36® is a generic measure of HRQOL that is valid, reliable and responsive to change in patients with OA, RA and PsA [16–19]; summing 36 questions into eight domains: physical functioning (PF), role physical (role limitations due to physical problems; RP), bodily pain (BP), general health (GH), energy/vitality (VT), social functioning (SF), role emotional (role limitations due to emotional problems; RE) and mental health [MH; ranging from 0 (worst) to100 (best)], and physical and mental component summary scores (PCS and MCS scores, respectively), with normative distributions of 50 and s.d. of 10 in the US population. SF-36V is a modified version, validated in veterans [2, 20, 21], where RP and RE domains were changed from dichotomous to 5-choice ordinal scales to avoid floor and ceiling effects, similar to version 2.0 of SF-36® [22]. Survey data were supplemented by data obtained from the national VA databases, as given subsequently.
VA administrative and clinical databases
The VA inpatient and outpatient administrative and clinical data sets provided the following: (i) demographic characteristics (gender, age, race, marital status, employment status); (ii) service-connected status (refers to disability occurring during active military duty and ranges from 0% to 100%; above 50%, one is given priority to health care access at VA facilities); (iii) VA medical site use (single- vs multi-site use for inpatient and outpatient health care utilization for 1 yr after the survey); and (iv) International Classification of Diseases (ICD)-9 and Current Procedural Terminology (CPT) codes for THA and TKA prior to the survey. These databases have been shown to be reliable for demographics and valid for most common [23] and specific diagnoses [24, 25].
Education level, self-reported physician diagnosis of six common diseases—arthritis, asthma/COPD, diabetes, depression, heart disease and hypertension—activities of daily living limitation and HRQOL were obtained from the survey.
Study outcomes
Outcomes of this current study included the SF-36V domain, PCS and MCS scores from the 1998 survey as continuous and categorical variables comparing the veterans with THA, TKA and the combination group vs the control group. We used the National VA inpatient (available from 1988 to 1998) and outpatient (available from 1991 to 1998) Patient Care databases at the Austin Automation Center (AAC) to identify the presence of CPT and ICD codes for THA or TKA prior to the survey: 00.70–00.76, 00.8–00.84, 81.51–81.55; 27 437, 27 438, 27 440–27 443, 27 445–27 447, 27 486, 27 487, 27 125, 27 130, 27 132, 27 134, 27 137, 27 138 and 27 236. For each patient, we identified the earliest date for knee or hip surgery; if they underwent any additional surgery (among the codes above) after their first THA or TKA, they were classified in the combination group. The control population had no documentation of THA or TKA.
Clinically meaningful differences were based on definitions for minimal clinically important differences (MCID) of 5–10 points in domain and 2.5–5 points in summary component scores of SF-36® derived from published randomized controlled trials and consistently similar in RA, OA, PsA and SLE [26–29]. The values for MCID represent the minimum improvement ‘perceptible’ to patients enrolled in clinical trials, and thus offer a reasonable benchmark for comparisons across patient and disease populations.
Confounding variables
The HRQOL estimates were adjusted in the multivariable analyses for the following potential confounders and covariates: (i) database-derived sociodemographic variables: age (in years), gender (male, female), employment status (employed, unemployed, retired, unknown), marital status (married, not married); (ii) survey-derived sociodemographics: race (white, non-white), education level (less than eighth grade, some high school, high school graduate, college and beyond); (iii) current smoking status: current smoker vs non-smoker; and (iv) survey-derived self-reported physician-diagnosed comorbidity: arthritis, asthma/chronic obstructive pulmonary disease (COPD), diabetes, depression, hypertension and heart disease (presence/absence).
Database-derived variables were available for most of the sample (∼70 000). Survey-derived variables were available for ∼35 000–40 000 responders to the questionnaire; range is provided since the response rate for each survey question varied slightly.
Statistical analyses
Continuous and categorical variables among subjects with and without TKA/THA were compared between survey responders and non responders using Student's t-test and chi-square test. Comparisons with age- and gender-matched US general population were made using the published norms by Ware et al. [30], and comparing the mean values for men matched for age categories as described by them. Linear regression analyses using least squares means were done for SF-36V domain and summary scores to compare the HRQOL in subjects with TKA/THA with that of controls. All regression analyses adjusted for the following confounders/covariates: sociodemographic (age, gender, race, education level, employment status and marital status), comorbidity (arthritis, asthma/COPD, diabetes, depression, heart disease and hypertension), current smoking status and health care access variables (single vs multiple site use and percent service connection). All analyses were performed using SPSS, version 11.5 (Chicago, IL, USA) and SAS, version 9.0 (Cary, NC, USA). Due to multiple comparisons performed, P-values <0.01 were considered statistically significant. Since the results from unadjusted analyses did not differ from the multivariable-adjusted regression analyses, we present both, but discuss only the multivariable-adjusted regression estimates.
Results
Demographic characteristics
Overall 58% responded to the survey (40 508 of the 70 334 population). Of these, 531 had TKA, 254 had THA, 461 constituted the combination group and 39 262, the control group—HRQOL and functional data are reported from this subset. Veterans with TKA or THA were 9–11 yrs older than the control population, were more likely married, had higher service connection, were less likely to be smokers or employed and were less educated (Table 1). Veterans with TKA or THA were more likely to have arthritis, diabetes and heart disease, but had a similar prevalence of asthma/COPD, depression and hypertension. The overall comorbidity load, as assessed by number of comorbid conditions or the proportion with ≥2 comorbidities, was higher in veterans with TKA or THA (Table 1). Minor differences in race and gender were noted among the groups.
Table 1.
Demographic and clinical characteristics of subjects with and without TKA/THA
| Control (n = 38 146–29 262) | Primary TKA (n = 516–531) | Primary THA (n = 247–254) | Combination groupa (n = 447–461) | P-valueb | |
|---|---|---|---|---|---|
| Age, mean ± s.d., yrs | 60.7 ± 15.4 | 71.6 ± 9 | 69.4 ± 11.2 | 72.2 ± 9.1 | <0.001 |
| Years since first arthroplasty surgery, mean ± s.d. | N/A | 2.3 ± 2.6 | 2.3 ± 2.5 | 3.0 ± 2.8 | <0.001 |
| Malec, % | 95 | 97 | 97 | 97 | 0.003 |
| Whitec, % | 94 | 96 | 99 | 98 | <0.001 |
| Married, % | 52 | 70 | 60 | 67 | <0.001 |
| Currently smokec, % | 24 | 11 | 16 | 13 | <0.001 |
| Employment status | <0.001 | ||||
| Employed, % | 34 | 19 | 21 | 15 | |
| Unemployed, % | 23 | 11 | 17 | 12 | |
| Retired, % | 36 | 65 | 58 | 70 | |
| Unknown, % | 7 | 5 | 4 | 3 | |
| Education levelc | <0.001 | ||||
| <8th grade, % | 16 | 31 | 31 | 27 | |
| Some high school, % | 12 | 13 | 13 | 15 | |
| High school graduate, % | 36 | 36 | 34 | 34 | |
| College and beyond, % | 36 | 36 | 21 | 25 | |
| Presence of self-reported physician diagnosis of | |||||
| Arthritis, % | 53 | 86 | 84 | 84 | <0.001 |
| Asthma/COPD, % | 26 | 27 | 24 | 25 | 0.72 |
| Depression, % | 28 | 31 | 26 | 31 | 0.31 |
| Diabetes, % | 18 | 26 | 16 | 22 | <0.001 |
| Hypertension, % | 35 | 36 | 39 | 40 | 0.056 |
| Heart disease, % | 34 | 42 | 33 | 42 | <0.001 |
| Number of comorbid conditions, mean ± s.d. | 1.7 ± 1.2 | 2.1 ± 1.2 | 1.9 ± 1.2 | 2.1 ± 1.2 | <0.001 |
| Percentage of with ≥2 comorbidities, % | 53 | 66 | 56 | 67 | <0.001 |
| Number of ADLs with limitations, mean ± s.d. | 1.5 ± 1.9 | 2.3 ± 1.8 | 2.6 ± 2 | 2.6 ± 1.9 | <0.001 |
| Percentage of Service-connectiond, % | <0.001 | ||||
| 0% or no | 61 | 49 | 63 | 54 | |
| 1–49% | 25 | 26 | 18 | 20 | |
| 50–100% | 14 | 25 | 20 | 26 |
aCombination group, ≥1 primary or 1 primary plus ≥1 revision TKA or THA. bP-values denote comparisons between subjects with and without TKA/THA (all three survey-derived measures). Survey-derived measures were available for 36 978–39 297 subjects; All other measures were available from administrative databases for ∼70 542–70 991 subjects. cRace data were available for 40 506 subjects without TKA/THA and 1448 with TKA/THA/combination; current smoking status (from survey data) was available for 35 852 subjects without TKA/THA and 1126 TKA/THA/combination; gender data were available for 69 238 subjects without and 1753 with TKA/THA/combination; education status was available for 38 102 subjects without TKA/THA and 1195 with TKA/THA/combination. dMean ± s.d. for percentage of service-connection was as follows: TKA, 25 ± 33%; THA, 18 ± 31%; Combination group, 25 ± 34%; and control, 16 ± 28%; the range for percentage of service-connection was none–100% for all four categories. ADLs: activities of daily living.
Survey non-responders were similar to responders in most characteristics except that they were significantly younger (56.3 yrs vs 64.5 yrs), less likely to be married (47% vs 64.9%) and less likely to be retired (26.7% vs 43.9%) as compared with responders.
Comparison with age- and gender-matched US general population
Veterans with TKA, THA and in the combination group had physical domain scores 50–67% lower (mean scores ranging from 28.7 to 38.3), psychosocial domain scores 4–51% lower (mean scores ranging from 41.2 to 74.7), and general health/vitality scores 30–53% lower (mean scores ranging from 32.9 to 45.6) than age- and gender-matched US general population (Fig. 1).
Fig. 1.

SF-36® V subscale scores of veterans with TKA, THA, combination group compared with age- and gender-matched US population. Worst health = 0, best health = 100.
Physical but not mental/emotional HRQOL is worse in TKA/THA patients compared with veteran controls
Veterans with TKA or THA or combination group had statistically significantly lower PF, BP and RP subscale scores than the controls, although only the PF scale differences reached MCID of >5-points for comparison of each of the three groups vs controls (7.2–12.1; Table 2). Differences for BP and RP scales exceeded MCID only for comparison between controls and the combination group (5.6 and 6.8, respectively). For GH scale, differences were statistically but not clinically meaningful, and for the rest of the SF-36V subscales differences were neither statistically nor clinically meaningful. PCS scores were both statistically and clinically lower in TKA/THA groups compared with controls, but MCS scores were statistically and clinically similar among groups. The PCS scores were statistically and marginally clinically lower (difference of 2.4) in primary TKA group compared with controls.
Table 2.
Multivariable-adjusted* and unadjusted least square means values (±s.e.) for each SF-36V subscale and summary scale score for survey-respondent veterans (n = 15 817–15 073)
| Multivariable-adjusted |
Unadjusted |
|||||||||
|---|---|---|---|---|---|---|---|---|---|---|
| Subscale and summary scores | Control population | Primary TKA | Primary THA | Combination group | P-value | Control population | Primary TKA | Primary THA | Combination group | P-value |
| PF | 49.3 ± 0.2 | 42.1 ± 1.7 | 40.9 ± 2.4 | 37.2 ± 1.8 | <0.0001 | 49.6 ± 0.2 | 34.3 ± 1.9 | 38.3 ± 2.7 | 28.8 ± 2 | <0.0001 |
| BP | 47.9 ± 0.2 | 45.2 ± 1.4 | 45 ± 2.1 | 42.3 ± 1.5 | 0.0003 | 48.1 ± 0.2 | 40.3 ± 1.6 | 42.9 ± 2.3 | 36.7 ± 1.7 | <0.0001 |
| RP | 46.4 ± 0.2 | 46.4 ± 1.7 | 42.5 ± 2.5 | 39.6 ± 1.8 | 0.0011 | 46.6 ± 0.2 | 39.8 ± 2 | 41.1 ± 2.8 | 32 ± 2.1 | <0.0001 |
| GH | 47 ± 0.2 | 51.1 ± 1.3 | 47.3 ± 1.9 | 45.6 ± 1.4 | 0.0109 | 47.1 ± 0.2 | 48.8 ± 1.5 | 49 ± 2.2 | 42.4 ± 1.6 | 0.0127 |
| VT | 42.1 ± 0.2 | 43.8 ± 1.3 | 43.1 ± 1.9 | 40.7 ± 1.4 | 0.4190 | 42.1 ± 0.2 | 42 ± 1.5 | 44.4 ± 2.1 | 37.8 ± 1.6 | 0.0314 |
| SF | 60.8 ± 0.2 | 61.6 ± 1.7 | 58 ± 2.4 | 56.7 ± 1.8 | 0.0802 | 60.8 ± 0.2 | 60.8 ± 1.9 | 60.8 ± 2.8 | 53.7 ± 2 | 0.0081 |
| RE | 63 ± 0.2 | 62.4 ± 1.8 | 65.7 ± 2.5 | 59.1 ± 1.9 | 0.1376 | 63.1 ± 0.3 | 59.8 ± 2 | 67 ± 2.9 | 54.2 ± 2.2 | <0.0001 |
| MH | 65.6 ± 0.1 | 66.1 ± 1.2 | 67.4 ± 1.7 | 64.8 ± 1.2 | 0.6356 | 65.6 ± 0.2 | 67.9 ± 1.4 | 70.7 ± 2 | 64.8 ± 1.5 | 0.0310 |
| PCS | 34.1 ± 0.1 | 32.7 ± 0.7 | 31.1 ± 0.9 | 30.5 ± 0.7 | <0.0001 | 34.2 ± 0.1 | 29.5 ± 0.8 | 30.1 ± 1.1 | 27.1 ± 0.8 | <0.0001 |
| MCS | 45.4 ± 0.1 | 46.2 ± 0.7 | 46.9 ± 1 | 45.5 ± 0.7 | 0.2855 | 45.3 ± 0.1 | 47.3 ± 0.9 | 49.1 ± 1.2 | 45.6 ± 0.9 | 0.0031 |
Significant differences are in bold.
*Adjusted for marital status, age, race, gender, education, employment status, smoking status, presence of arthritis, asthma/COPD, depression, diabetes, hypertension and heart disease; single vs multiple site use and percent service connection.
After multivariable adjustment, a significantly higher proportion of veterans with TKA or THA or combination group had PCS ≤ 30 (difference was also clinically meaningful, P < 0.0001), but similar proportion had MCS ≤ 30 (P = 0.2875; Table 3 and Fig. 2). Similar proportion of veterans had adjusted PCS and MCS scores below population mean of 50. This was statistically significant (P < 0.001) but the differences were not clinically meaningful.
Table 3.
Proportion of patients with PCS and MCS below mean and 2 s.d. below US population mean of 50 (n = 15 097)
| Multivariable-adjusted |
Unadjusted |
|||||||||
|---|---|---|---|---|---|---|---|---|---|---|
| Proportion with | Control population | Primary TKA | Primary THA | Combination group | P-value | Control population | Primary TKA | Primary THA | Combination group | P-value |
| PCS ≤ 30, % | 55.5 | 64.4 | 70.8 | 75.6 | <0.0001 | 40.4 | 58.9 | 58.2 | 69.8 | <0.0001 |
| MCS ≤ 30, % | 15.4 | 12.3 | 8.1 | 15.7 | 0.2875 | 14 | 8.1 | 4.5 | 12.3 | 0.0004 |
| PCS < 50, % | 97.7 | 98 | 99.8 | 99.1 | 0.0013 | 88.6 | 96 | 99.1 | 98.8 | <0.0001 |
| MCS < 50, % | 83 | 81.2 | 83.5 | 84 | 0.8163 | 59.2 | 56.2 | 54.5 | 62.6 | 0.4372 |
Significant differences are in bold.
Fig. 2.

Proportion of THA, TKA, combination and control groups with PCS and MCS scores 2 s.d. below mean (PCS ≤ 30). P < 0.001 for comparison of groups for PCS ≤ 30 and P = 0.2875 for MCS ≤ 30.
Discussion
The primary finding of this research is that community-dwelling veterans with prevalent TKA and THA report profound deficits in their physical well-being. While this result might seem intuitively credible, the evidence to date has been mixed. Published studies that compared the HRQOL of THA/TKA patients with population norms have reported variable findings; some showing that HRQOL is similar [12, 13] and others finding that it is lower than norms [7, 14]. The remainder of this discussion puts the key findings from this study into perspective of the literature and clinical realities.
Limitations
These findings, while based on large population-based samples, may not be generalizable to non-veterans, females or to other VA service networks. Non-response bias limits generalizability. Since this was a cross-sectional survey, residual confounding due to unmeasured variables (i.e. other comorbidities such as alcohol use, BMI, post-traumatic stress disorder, metabolic syndrome, renal failure, etc.) is possible. We did not have any measure of severity of arthritis, incidence/prevalence of arthritis in the opposite knee, hip or other joints or rehabilitation status, strength and joint motion status, adequacy of pain control and access to rehabilitation pre- and post-operatively, which may have had an impact on HRQOL.
HRQOL differences compared with age- and gender-matched US population
Significantly lower scores on all physical domains with smaller differences in psychosocial domains compared with age- and gender-matched US population were evident. Results from previous studies are contradictory. In a cohort study of 151 Australian veterans, among the younger patients (55–74 yrs), significantly and profoundly lower 1-yr post-operative SF-36® scores in physical domains and non- significantly lower psychosocial domains after TKA (but not THA) were reported, compared with general population norms [7]. Similarly, in a community-based sample of 504 US patients who underwent THA or TKA, despite large improvements in SF-36® physical domains, scores did not reach age- and sex-matched population norms 6-months post-arthroplasty (difference of 10–20 points for PF and RP scales for both TKA and THA and 10 points for BP for TKA; no statistical test reported) [14].
In contrast, scores similar to population norms or age-matched population norms have been reported on SF-36® subscales at 10-yr post-TKA in 208 patients [12], and on the SF-36® physical component summary in 104 older Australian patients at 12 weeks post-THA [13]. Results from our study in veterans support the findings from the study in Australian veterans only with regards to TKA [7] and US community-based sample for both TKA and THA [14] and are in contrast to other studies [12, 13]. Patients with THA have a survival advantage over age-, gender-, race- and comorbidity-matched Medicare controls [31], indicating that although patients with arthroplasty may survive longer, their HRQOL is poorer than controls.
The deficits in physical HRQOL observed in our study were more profound than those typically seen in literature, even in advanced cancer patients [32].
Comparison with control population
In addition, veterans with TKA and THA have significantly poorer physical HRQOL but similar mental/emotional HRQOL compared with veteran controls. Since these differences in physical HRQOL are not attributable to differences in age, gender, race, other sociodemographics, comorbidity and healthcare access/utilization, further studies to investigate the reasons for these differences are needed. If modifiable factors are identified, targeted interventions are likely to improve the HRQOL of veterans with arthroplasty.
Comparisons with non-veteran populations
In general, US veterans have reported worse HRQOL and have more comorbidity than non-veteran populations [15, 33]. Veterans undergoing arthroplasty have poorer pre-operative functional status and are older at the time of arthroplasty than non-veterans [34]. Higher comorbidity, older age and poorer pre-operative function are negatively associated with outcomes following arthroplasty [10, 35, 36]. In another study by Heck et al. [37] that compared veterans with non-veterans undergoing TKA for OA, despite being younger, veterans had increased length of hospital stay, reduced range of knee motion at 1 and 2 yrs, and a higher complication rate, 68% vs 23%, than the civilian population. Thus, at least some HRQOL deficits in our study population may be attributable to the veteran status, higher comorbidity and to poorer post-arthroplasty outcomes in veterans vs non-veterans.
Implications
These data have implications for the costs associated with the care of this patient population. The median cost for primary joint arthroplasty was $12 846 at the United States hospitals between 1997 and 2001 [38]; Medicare paid $3.2 billion for these procedures in 2000 [39]. The severe deficits in physical well-being indicated by our data undoubtedly impart additional burden to the healthcare system to deal with the concomitant physical deficits. Hence, interventions targeted at preventing and improving the physical deficits could potentially reduce the cost of follow-up care for patients undergoing TKA or THA surgery. There is ample evidence in the literature to demonstrate that patients with improved QOL place fewer demands on healthcare systems [40, 41]. This is true even for end-stage cancer care.
Acknowledgements
We thank the funding agencies for their support and Vicki Schmidt of the Mayo Clinic and Perlita Ochoa of the Minneapolis VA Medical Center for their administrative help, who have given the permission to be named. The views expressed in this article are those of the authors and do not necessarily reflect the position or policy of the Department of Veterans Affairs.
Funding: This study was supported by the NIH CTSA Award 1 KL2 RR024151-01 (Mayo Clinic Center for Clinical and Translational Research) and the VA Scholar Grant from the Center for Epidemiological and Clinical Research, Minneapolis VA Medical Center, Minneapolis, MN. The authors are fully responsible for data analyses and for the preparation and revision of the manuscript. The funding agencies had no influence on manuscript preparation or the decision to submit it for publication.
Disclosure statement: The authors have declared no conflicts of interest.
References
- 1.Callahan CM, Drake BG, Heck DA, Dittus RS. Patient outcomes following tricompartmental total knee replacement. A meta-analysis. J Am Med Assoc. 1994;271:1349–57. [PubMed] [Google Scholar]
- 2.Kazis LE, Miller DR, Clark J, et al. Health-related quality of life in patients served by the department of veterans affairs: results from the veterans health study. Arch Intern Med. 1998;158:626–32. doi: 10.1001/archinte.158.6.626. [DOI] [PubMed] [Google Scholar]
- 3.Yu W, Ravelo A, Wagner T, et al. Prevalence and costs of chronic conditions in the VA health care system. Med Care. 2003;60:146S–67S. doi: 10.1177/1077558703257000. [DOI] [PubMed] [Google Scholar]
- 4.Kurtz S, Ong K, Lau E, Mowat F, Halpern M. Projections of primary and revision hip and knee arthroplasty in the United States from 2005 to 2030. J Bone Joint Surg Am. 2007;89:780–5. doi: 10.2106/JBJS.F.00222. [DOI] [PubMed] [Google Scholar]
- 5.Ethgen O, Bruyere O, Richy F, Dardennes C, Reginster JY. Health-related quality of life in total hip and total knee arthroplasty. A qualitative and systematic review of the literature. J Bone Joint Surg Am. 2004;86-A:963–74. doi: 10.2106/00004623-200405000-00012. [DOI] [PubMed] [Google Scholar]
- 6.Rissanen P, Aro S, Slatis P, Sintonen H, Paavolainen P. Health and quality of life before and after hip or knee arthroplasty. J Arthroplasty. 1995;10:169–75. doi: 10.1016/s0883-5403(05)80123-8. [DOI] [PubMed] [Google Scholar]
- 7.March LM, Cross MJ, Lapsley H, et al. Outcomes after hip or knee replacement surgery for osteoarthritis. A prospective cohort study comparing patients’ quality of life before and after surgery with age-related population norms. Med J Aust. 1999;171:235–8. [PubMed] [Google Scholar]
- 8.Kantz ME, Harris WJ, Levitsky K, Ware JE, Jr, Davies AR. Methods for assessing condition-specific and generic functional status outcomes after total knee replacement. Med Care. 1992;30:MS240–52. doi: 10.1097/00005650-199205001-00024. [DOI] [PubMed] [Google Scholar]
- 9.Navarro Collado MJ, Peiro S, Trenor Gomis C, Ruiz Jareno L, Perez Igualada A, Guerola Soler N. [Factors related to functional outcomes and quality of life after knee arthroplasty] Med Clin. 2000;114:250–4. doi: 10.1016/s0025-7753(00)71261-9. [DOI] [PubMed] [Google Scholar]
- 10.Nilsdotter AK, Lohmander LS. Age and waiting time as predictors of outcome after total hip replacement for osteoarthritis. Rheumatology. 2002;41:1261–7. doi: 10.1093/rheumatology/41.11.1261. [DOI] [PubMed] [Google Scholar]
- 11.Stucki G, Liang MH, Phillips C, Katz JN. The short form-36 is preferable to the sip as a generic health status measure in patients undergoing elective total hip arthroplasty. Arthritis Care Res. 1995;8:174–81. doi: 10.1002/art.1790080310. [DOI] [PubMed] [Google Scholar]
- 12.Wright RJ, Sledge CB, Poss R, Ewald FC, Walsh ME, Lingard EA. Patient-reported outcome and survivorship after kinemax total knee arthroplasty. J Bone Joint Surg Am. 2004;86-A:2464–70. doi: 10.2106/00004623-200411000-00016. [DOI] [PubMed] [Google Scholar]
- 13.McMurray A, Grant S, Griffiths S, Letford A. Health-related quality of life and health service use following total hip replacement surgery. J Adv Nurs. 2002;40:663–72. doi: 10.1046/j.1365-2648.2002.02426.x. [DOI] [PubMed] [Google Scholar]
- 14.Jones CA, Voaklander DC, Johnston DW, Suarez-Almazor ME. Health related quality of life outcomes after total hip and knee arthroplasties in a community based population. J Rheumatol. 2000;27:1745–52. [PubMed] [Google Scholar]
- 15.Singh JA, Borowsky SJ, Nugent S, et al. Health-related quality of life, functional impairment, and healthcare utilization by veterans: veterans’ quality of life study. J Am Geriatr Soc. 2005;53:108–13. doi: 10.1111/j.1532-5415.2005.53020.x. [DOI] [PubMed] [Google Scholar]
- 16.Kosinski M, Keller SD, Ware JE, Jr, Hatoum HT, Kong SX. The SF-36 health survey as a generic outcome measure in clinical trials of patients with osteoarthritis and rheumatoid arthritis: relative validity of scales in relation to clinical measures of arthritis severity. Med Care. 1999;37:MS23–39. doi: 10.1097/00005650-199905001-00003. [DOI] [PubMed] [Google Scholar]
- 17.Kvien TK, Kaasa S, Smedstad LM. Performance of the Norwegian SF-36 health survey in patients with rheumatoid arthritis. II. A comparison of the SF-36 with disease-specific measures. J Clin Epidemiol. 1998;51:1077–86. doi: 10.1016/s0895-4356(98)00099-7. [DOI] [PubMed] [Google Scholar]
- 18.Tuttleman M, Pillemer SR, Tilley BC, et al. A cross sectional assessment of health status instruments in patients with rheumatoid arthritis participating in a clinical trial. Minocycline in rheumatoid arthritis trial group. J Rheumatol. 1997;24:1910–5. [PubMed] [Google Scholar]
- 19.Ware JE, Jr, Sherbourne CD. The MOS 36-item short-form health survey (SF-36). I. Conceptual framework and item selection. Med Care. 1992;30:473–83. [PubMed] [Google Scholar]
- 20.Kazis L, Skinner K, Rogers W, et al. 1998 National survey of ambulatory care patients. Executive report. Bedford, MA. Center for Health Quality, Outcomes, and Economic Research, Bedford VAMC;. Washington DC: Department of Veterans Affairs, Veterans Health Administration, Office of Performance and Quality; 1998. Health status of veterans: physical and mental component summary scores (SF-36V). [Google Scholar]
- 21.Kazis LE, Ren XS, Lee A, et al. Health status in VA patients: results from the veterans health study. Am J Med Qual. 1999;14:28–38. doi: 10.1177/106286069901400105. [DOI] [PubMed] [Google Scholar]
- 22.Ware JE, Kosinski M, Dewey J. 3rd edition. Lincoln, RI: QualityMetric Inc; 2000. How to score version two of the SF-36 health survey. [Google Scholar]
- 23.Kashner TM. Agreement between administrative files and written medical records: a case of the department of veterans affairs. Med Care. 1998;36:1324–36. doi: 10.1097/00005650-199809000-00005. [DOI] [PubMed] [Google Scholar]
- 24.Szeto HC, Coleman RK, Gholami P, Hoffman BB, Goldstein MK. Accuracy of computerized outpatient diagnoses in a veterans affairs general medicine clinic. Am J Manag Care. 2002;8:37–43. [PubMed] [Google Scholar]
- 25.Petersen LA, Wright S, Normand SL, Daley J. Positive predictive value of the diagnosis of acute myocardial infarction in an administrative database. J Gen Intern Med. 1999;14:555–8. doi: 10.1046/j.1525-1497.1999.10198.x. [DOI] [PMC free article] [PubMed] [Google Scholar]
- 26.Strand V, Singh JA. Improved health-related quality of life with effective disease-modifying antirheumatic drugs: evidence from randomized controlled trials. Am J Manag Care. 2007;13(Suppl 9):S237–51. [PubMed] [Google Scholar]
- 27.Strand V. Longer term benefits of treating rheumatoid arthritis: assessment of radiographic damage and physical function in clinical trials. Clin Exp Rheumatol. 2004;22:S57–64. [PubMed] [Google Scholar]
- 28.Strand V, Crawford B. Improvement in health-related quality of life in patients with SLE following sustained reductions in anti-dsDNA antibodies. Expert Rev Pharmacoeco Outcomes Res. 2005;5:317–26. doi: 10.1586/14737167.5.3.317. [DOI] [PubMed] [Google Scholar]
- 29.Strand V, Kelman A. Outcome measures in osteoarthritis: randomized controlled trials. Curr Rheumatol Rep. 2004;6:20–30. doi: 10.1007/s11926-004-0080-6. [DOI] [PubMed] [Google Scholar]
- 30.Ware JE, Jr, Kosinki M, Keller SK. Boston, MA: The Health Institute; 1994. SF-36 physical and mental health summary scales: a user's manual. [Google Scholar]
- 31.Barrett J, Losina E, Baron JA, Mahomed NN, Wright J, Katz JN. Survival following total hip replacement. J Bone Joint Surg Am. 2005;87:1965–71. doi: 10.2106/JBJS.D.02440. [DOI] [PubMed] [Google Scholar]
- 32.Hahn E. Mayo Clinic Proceedings. 2009. A guide for clinicians to compare the precision of health-related quality of life data relative to other clinical measures. (in press) [DOI] [PubMed] [Google Scholar]
- 33.Agha Z, Lofgren RP, VanRuiswyk JV, Layde PM. Are patients at veterans affairs medical centers sicker? A comparative analysis of health status and medical resource use. Arch Intern Med. 2000;160:3252–7. doi: 10.1001/archinte.160.21.3252. [DOI] [PubMed] [Google Scholar]
- 34.Wells V, Hearn T, Heard A, Lange K, Rankin W, Graves S. Incidence and outcomes of knee and hip joint replacement in veterans and civilians. ANZ J Surg. 2006;76:295–9. doi: 10.1111/j.1445-2197.2006.03716.x. [DOI] [PubMed] [Google Scholar]
- 35.Weaver F, Hynes D, Hopkinson W, et al. Preoperative risks and outcomes of hip and knee arthroplasty in the veterans health administration. J Arthroplasty. 2003;18:693–708. doi: 10.1016/s0883-5403(03)00259-6. [DOI] [PubMed] [Google Scholar]
- 36.Fortin PR, Clarke AE, Joseph L, et al. Outcomes of total hip and knee replacement: preoperative functional status predicts outcomes at six months after surgery. Arthritis Rheum. 1999;42:1722–8. doi: 10.1002/1529-0131(199908)42:8<1722::AID-ANR22>3.0.CO;2-R. [DOI] [PubMed] [Google Scholar]
- 37.Heck DA, Maar DC, Lowdermilk GA, Kalasinski LA, Mesko JW. Comparative analysis of total knee arthroplasty in two health care delivery systems. J Arthroplasty. 1992;7:93–100. doi: 10.1016/0883-5403(92)90038-r. [DOI] [PubMed] [Google Scholar]
- 38.Antoniou J, Martineau PA, Filion KB, et al. In-hospital cost of total hip arthroplasty in Canada and The United States. J Bone Joint Surg Am. 2004;86-A:2435–9. doi: 10.2106/00004623-200411000-00012. [DOI] [PubMed] [Google Scholar]
- 39.Kane RL, Saleh KJ, Wilt TJ, Bershadsky B. The functional outcomes of total knee arthroplasty. J Bone Joint Surg Am. 2005;87:1719–24. doi: 10.2106/JBJS.D.02714. [DOI] [PubMed] [Google Scholar]
- 40.Earle CC, Neville BA, Landrum MB, et al. Evaluating claims-based indicators of the intensity of end-of-life cancer care. Int J Qual Health Care. 2005;17:505–9. doi: 10.1093/intqhc/mzi061. [DOI] [PubMed] [Google Scholar]
- 41.Krzyzanowska MK, Earle CC, Kuntz KM, Weeks JC. Using economic analysis to evaluate the potential of multimodality therapy for elderly patients with locally advanced pancreatic cancer. Int J Radiat Oncol Biol Phys. 2007;67:211–8. doi: 10.1016/j.ijrobp.2006.07.1390. [DOI] [PubMed] [Google Scholar]