

Abstract
Histone deacetylase (HDAC) inhibitors have the potential to derepress epigenetically silenced genes in cancer cells, leading to cell cycle arrest and apoptosis. In the present study, we screened several garlic-derived small organosulfur compounds for their ability to inhibit HDAC activity in vitro. Among the organosulfur compounds examined, allyl mercaptan (AM) was the most potent HDAC inhibitor. Molecular modeling, structure activity and enzyme kinetics studies with purified human HDAC8 provided evidence for a competitive mechanism (Ki = 24 μM AM). In AM-treated human colon cancer cells, HDAC inhibition was accompanied by a rapid and sustained accumulation of acetylated histones in total cellular chromatin. Chromatin immunoprecipitation assays confirmed the presence of hyperacetylated histone H3 on the P21WAF1 gene promoter within 4 h of AM exposure, and there was increased binding of the transcription factor Sp3. At a later time, 24 h after AM treatment, there was enhanced binding of p53 in the distal enhancer region of the P21WAF1 gene promoter. These findings suggest a primary role for Sp3 in driving P21 gene expression after HDAC inhibition by AM, followed by the subsequent recruitment of p53. Induction of p21Waf1 protein expression was detected at time points between 3 and 72 h after AM treatment and coincided with growth arrest in G1 of the cell cycle. The results are discussed in the context of other anticarcinogenic mechanisms ascribed to garlic organosulfur compounds and the metabolic conversion of such compounds to potential HDAC inhibitors in situ.
Introduction
Epigenetic changes play a pivotal role in the deregulation of gene expression during cancer development (1). For example, the silencing of tumor suppressor genes has been associated with aberrant patterns of histone acetylation in HT29 and other human colon cancer cells (1–3). Histone acetylation and deacetylation is catalyzed, respectively, by histone acetyltransferases (HATs) and histone deacetylases (HDACs). Histone deacetylation typically produces a compact chromatin configuration that restricts transcription factor access to DNA and represses gene expression (4). HDAC inhibitors are gaining interest as potential anticancer drugs due to their ability to reactivate epigenetically silenced genes in cancer cells, resulting in growth arrest, apoptosis and differentiation (5–7). Microarray analyses revealed that ∼2 to 5% of silenced genes were reactivated within the initial hours of HDAC inhibitor treatment (8,9), and the cell cycle regulator p21Waf1 (p21) was an early target for upregulation (10–12).
Reactivation of p21 has been reported in cancer cells treated with potent HDAC inhibitors (9,10), such as trichostatin A (TSA) and suberoylanilide hydroxamic acid. The latter compound, marketed under the name Vorinostat, has shown promise in the treatment of advanced cutaneous T-cell lymphoma (13). Recently, attention has shifted to dietary agents that act as inhibitors of HDAC activity, including butyrate, sulforaphane and organosulfur compounds from garlic (reviewed in refs 14,15).
Garlic, onions, leeks and other Allium vegetables have numerous purported health benefits, including anticancer properties (16–19). A recent study, for example, found odds ratios among persons with high versus low intakes of onions and garlic that were significantly associated with a lower risk of colorectal adenoma (20). Much interest has focused on garlic-derived organosulfur compounds. These compounds include oil-soluble constituents diallyl sulfide, diallyl disulfide (DADS), diallyl trisulfide, dithiins and ajoene; water-soluble derivatives S-allyl cysteine (SAC) and S-allyl mercaptocysteine (SAMC) and metabolites allyl mercaptan (AM) and allyl methyl sulfide (21–23). Such compounds can alter xenobiotic drug-metabolizing enzymes and inhibit the formation of carcinogen–DNA adducts (24,25). Garlic organosulfur compounds also produce antiproliferative effects in cancer cells, leading to cell cycle arrest and/or apoptosis (26,27). Interestingly, histone hyperacetylation associated with growth inhibition was reported in cancer cells treated with DADS (28) and SAMC (29), suggesting that these compounds may alter HDAC enzymes. In primary rat hepatocytes, DADS was metabolized to AM within 30 min (23), and AM was more effective than its precursors (DADS and SAMC) at inhibiting HDAC activity under cell-free conditions (29,30).
Based on these findings, we screened several garlic organosulfur compounds in vitro and identified AM as the most potent inhibitor of HDAC activity. In human colon cancer cells, AM induced the accumulation of acetylated histones and enhanced the binding of Sp3 and p53 transcription factors to the P21WAF1 gene promoter. There was a corresponding increase in p21 messenger RNA (mRNA) and protein expression, resulting in cell cycle arrest and growth inhibition.
Materials and methods
Cell culture and reagents
The HT29 human colon adenocarcinoma cell line was obtained from American Type Culture Collection (Manassas, VA) and cultivated in McCoy’s 5A medium (Life Technologies, Carlsbad, CA) supplemented with 1% penicillin–streptomycin and 10% fetal bovine serum. TSA, AM, allyl methyl sulfide and DADS were purchased from Sigma–Aldrich (St Louis, MO). SAC and SAMC were synthesized by Wakunaga of America Co. (Mission Viejo, CA). Cells (0.4 × 10⁶) were seeded in 60 mm dishes 36 h prior to treatment. AM and TSA were dissolved in 0.1% dimethylsulfoxide and mixed with culture medium prior to addition to the cells. Control cultures were treated in parallel with 0.1% dimethylsulfoxide alone.
HDAC activity
HDAC activity was determined using the Fluor-de-Lys HDAC activity assay kit (Biomol, Plymouth Meeting, PA), as reported before (31–34). Incubations were performed at 37°C with purified human HDAC8, HeLa nuclear extract (supplied with the kit) or HT29 cellular extract. Fluorescence was measured using a Spectra MaxGemini XS fluorescence plate reader (Molecular Devices, Sunnyvale, CA), with excitation at 360 nm and emission at 460 nm.
Molecular modeling
Molecular docking was carried out using MacroModel® software v8.5 (Schrödinger, Portland, OR). Maestro GUI (Schrödinger) was used to set up and submit energy calculations to MacroModel®. AMBER* force field and MCMM applications within MacroModel® were used to execute flexible docking simulations. For these studies, we used the crystal structure of human HDAC8 with MS-344 inhibitor bound to the catalytic site (1T67 from the Protein Data Bank). Force field parameters for the zinc atom were taken from previous work on thermolysin (35). The covalent geometry of AM was generated using Maestro, and energy minimization was performed prior to docking simulation. The flexible docking procedure consisted of iterative torsional sampling searches with structural perturbation followed by energy minimization. The AM molecule was fully flexible, whereas residues within the HDAC8 active site (including zinc) were held fixed in their original positions. A non-bonded model, in which van der Waals and electrostatic interactions alone were considered, was used for preliminary docking work. The initial docking search started with AM positioned 10 Å distance from the enzyme. The lowest energy structure then was used to derive a truncated zinc–ligand model, which included the binding site residues Asp 178, Asp 267 and His 180 and the nearby AM molecule. Jaguar software v5.5 (Schrödinger) was used to compute the zinc electric charge distribution by fitting the partial charges to the electrostatic potential calculated at the B3LYP density function level with the LACVP* basis set. After obtaining the optimized stretching and bending parameters of zinc heteroatom bonds, we fixed zinc–ligand bond lengths and angles and performed another round of conformational searches as described above. The overall lowest energy structure was determined by considering QM energy of zinc–ligands and the potential energy of AM–HDAC without zinc.
3-(4,5-Dimethylthiazol-2-yl)-2,5-diphenyltetrazolium bromide assay
Cell growth was determined by assaying for the reduction of 3-(4,5-dimethylthiazol-2-yl)-2,5-diphenyltetrazolium bromide to formazan. Briefly, after 24 and 48 h of incubation with AM, TSA or vehicle alone, 45 μl of 3-(4,5-dimethylthiazol-2-yl)-2,5-diphenyltetrazolium bromide (5 μg/μl) was added to cells (4 × 10⁴ per well) in 96-well plates. Cells were incubated at 37°C for 4 h, and a Spectra MaxGemini XS fluorescence plate reader (Molecular Devices) was used to measure absorbance at 620 nm for each well. Growth rate was calculated as follows: cell growth = (A620 treated cells/A620 control cells) × 100%.
Flow cytometry
Cells treated with vehicle, AM or TSA for 24 h were harvested in cold phosphate-buffered saline, fixed in 70% ethanol and stored at 4°C for at least 48 h. Fixed cells were washed with phosphate-buffered saline once and resuspended in propidium iodide/Triton X-100 staining solution containing RNase A. Samples were incubated in the dark for 30 min before cell cycle analysis. The DNA content of the cells was detected using EPICS XL Beckman Coulter and analyses of cell distribution in the different cell cycle phases were performed using Multicycle Software (Phoenix Flow Systems, San Diego, CA).
Immunoblotting
Protein concentration of cell lysates was determined using the bicinchoninic acid assay (Pierce, Rockford, IL). Proteins (20 mg) were separated by sodium dodecyl sulfate–polyacrylamide gel electrophoresis on 4–12% Bis–Tris gel (Novex, San Diego, CA) and transferred to nitrocellulose membranes (Invitrogen, Carlsbad, CA). Membranes were saturated with 2% bovine serum albumin for 1 h, followed by an overnight incubation at 4°C with primary antibodies against acetylated histone H3 (1:200, Upstate, Temecula, CA, #06-599), histone H3 (1:200, Upstate, #06-755), acetylated histone H4 (1:2000, Upstate, #06-866), histone H4 (1:2000, Upstate, #05-858) or p21 (1:1000, Cell Signaling, Danvers, MA, #2947). Membranes were incubated with peroxidase-conjugated secondary antibodies (Bio-Rad, Hercules, CA) for 1 h. Immunoreactive bands were visualized by using Western Lightning Chemiluminescence Reagent Plus (PE Life Sciences, Boston, MA). Bands were detected and quantified on an Alpha Innotech photodocumentation system (Alpha Innotech Corp., San Leandro, CA). To ensure equal loading, all blots were reprobed for β-actin (Sigma-Aldrich, A5441).
Reverse transcription–polymerase chain reaction and quantitative real-time polymerase chain reaction
Cells treated with AM or TSA were disrupted by using QIAshredder spin column (QIAGEN, Santa Clarita, CA) and total RNA was extracted using the RNeasy® Mini Kit (QIAGEN) in accordance with the manufacturer’s instructions. Single-strand complementary DNA was synthesized with 5 μg of total RNA using the High-Capacity cDNA Archive Kit (Applied Biosystems, Foster city, CA) according to the manufacturer’s standard protocol. Real-time polymerase chain reaction (PCR) was performed on an ABI Prism 7500 Real-Time PCR Instrument (Applied Biosystems). Primers and TaqMan probes were obtained from Applied Biosystems (TaqMan® Gene Expression Assays). Random primers used for reverse transcription–PCR were included in the kit. Gene-specific primers used for real-time PCR are available upon request. The PCR conditions were as follows: denaturation for 10 min at 95°C, followed by 50 cycles at 95°C for 15 s and 60°C for 1 min. The linear range of amplification was determined using serially diluted complementary DNA (4-fold series). The mRNA expression of the target gene was normalized to the corresponding glyceraldehyde 3-phosphate dehydrogenase internal control.
Chromatin immunoprecipitation assays
HT29 cells were cultured with 0.1% dimethylsulfoxide (vehicle), AM or TSA for 4 or 24 h and fixed in 1% formaldehyde for 10 min at room temperature. Cross-linking was stopped by adding glycine at a final concentration of 0.125 M. The chromatin immunoprecipitation (ChIP) kit from Active Motif (Carlsbad, CA) was used according to the manufacturer’s instructions. Chromatin was incubated with 10 μg anti-acetylated histone H3 (Upstate, #06-599), anti-Sp1 (Santa Cruz Biotechnology, Santa Cruz, CA, sc-14027x), anti-Sp3 (Santa Cruz Biotechnology, sc-13018x), anti-p53 (Santa Cruz Biotechnology, sc-126x) or anti-polymerase II (included in the kit) antibodies overnight at 4°C. DNA pull down was purified by phenol–chloroform extraction followed by ethanol precipitation. DNA was then resuspended in 30 μl diethylpyrocarbonate water (or 100 μl for the input controls). Primers used to amplify different regions of the P21WAF1 gene promoter and downstream were as follows (F = forward and R = reverse)—a: (−3940 to −4346) F-5′-GATGCCAACCAGATTTGCCG-3′ and R-5′-CCTGGCTCTAACAACATCCC-3′; b: (−3538 to −3941) F-5′-GAACAGGAAGACCATCCAGG-3′ and R-5′-GGTCATCACACCTGCTATGTC-3′; c: (−2029 to −2478) F-5′-CACCACTGAGCCTTCCTCAC-3′ and R-5′-CTGACTCCCAGCACACACTC-3′; d: (−1335 to −1688) F-5′-GAAATGCCTGAAAGCAGAGG-3′ and R-5′-GCTCAGAGTCTGGAAATCTC-3′; e: (−677 to −981) F-5′-GGAGGCAAAAGTCCTGTGTTC-3′ and R-5′-GGAAGGAGGGAATTGGAGAG-3′; f: (−324 to −676) F-5′-CCCGGAAGCATGTGACAATC-3′ and R-5′-CAGCACTGTTAGAATGAGCC-3′; g: (+41 to −343) F-5′-GGCTCATTCTAACAGTGCTG-3′ and R-5′-TCCACAAGGAACTGACTTCG-3′ and h: (+3516 to +3349) F-5′-GTTGATGGGCCTCTCTGGTTA-3′ and R-5′-AGGCAACCAAGGCTCAGATA-3′. Immunoprecipitated DNAs (4 μl) or input controls (1 μl) were subjected to PCR amplification as follows: preincubation for 5 min at 95°C, 30 s at 95°C, 30 s at 62°C and 30 s at 72°C (35 cycles), ending with 10 min at 72°C. PCR products were separated by electrophoresis through 1.5% agarose gel. In subsequent experiments, real-time PCR was used to quantify the outcome from ChIP assays. Briefly, 4 μl DNA pull downs using anti-acetylated H3, anti-p53, anti-Sp1 or anti-Sp3 antibodies from control-, TSA- and AM-treated cells were subjected to 42 cycles of PCR run on an Opticon Monitor 2 system (Finnzymes, Espoo, Finland) in a 20 μl reaction containing SYBR Green I dye (DyNAmo master solution, Finnzymes) and primer sets. Primers within regions b and g were further optimized for the real-time conditions and designated as regions b′ and g′, respectively. The corresponding primer sequences were as follows: b′, (−3756 to −3906) F-5′-CTGAGGGGAGGCTCATACTG-3′ and R-5′-CAGAGCCAGGATGAATTGGT-3′; g′, (−11 to −171) F-5′-GCTGGCCTGCTGGAACTC-3′ and R-5′-AGCGCGGCCCTGATATAC-3′. PCR conditions were 30 s at 95°C, 30 s at 62°C and 40 s at 72°C and ending with 10 min at 72°C. The amounts of region b′ and g′ of P21WAF1 promoter were quantified by determining the point at which the fluorescence accumulation entered the exponential phase, using triplicates for each data point. Each separate experiment was repeated at least twice.
Statistical analyses
Results were expressed as mean ± SD. Statistical significance was evaluated for data from three independent experiments using Student’s t-test. A P-value <0.05 was considered to be statistically significant.
Results
AM is a competitive HDAC inhibitor
Compounds that inhibit HDAC enzymes and increase histone acetylation have promising therapeutic potential (36). We first examined whether DADS, SAC, SAMC or their metabolites AM and allyl methyl sulfide might inhibit HDAC activity in a cell-free system. The compounds were selected based on structural features that might be compatible with the HDAC active site and/or published reports on their ability to induce histone acetylation in cancer cells (28–30). Under the conditions used here, AM was the only compound to produce a marked, dose-dependent inhibition of HDAC activity (Figure 1A). The concentration for 50% inhibition (IC50) by AM was ∼20 μM. A separate test for quenching showed that AM did not interfere with the fluorescence signal of the assay (data not presented).
Fig. 1.

AM is a competitive HDAC inhibitor. (A) HDAC activity was evaluated using HeLa nuclear extracts in the presence of 2, 20 and 200 μM SAMC, SAC, DADS, AM and allyl methyl sulfide (AMS). Data (mean ± SD, n = 3, *P < 0.05) were expressed as percent of dimethylsulfoxide control. (B) Inhibition of HDAC activity by AM and three structural analogues, allyl alcohol, benzyl mercaptan and mercaptoethanol. HDAC activity was assayed with HeLa nuclear extracts (top) or human HDAC8 (bottom). Data = mean ± SD, n = 3, *P < 0.05. (C) Cornish-Bowden plot (left) and Dixon plot (right) of HDAC8 inhibition by AM, indicating competitive binding (Ki = 24 μM). (D) Modeling of the HDAC8–AM complex using MacroModel® v8.5 (Schrödinger). Left: lowest energy configurations of AM in the active site of human HDAC8 based on a non-bonded model docking search. Enzyme-bound inhibitor MS-344 (brown) and the active zinc atom (blue sphere) are shown from a prior report (37), which highlights the favorable orientation of AM (green). Right: AM docked in the HDAC8 catalytic core in the lowest energy structure after Jaguar calculation (Schrödinger). The sulfur of AM (yellow) was oriented 2.25 Å from the zinc atom (blue sphere), and hydrophobic interactions with adjacent residues were predicted to further stabilize AM binding in the HDAC8 pocket.
To provide structure–function insights, we assessed the ability of AM and three of its structural analogues to inhibit HDAC activity in HeLa nuclear extracts and with purified human HDAC8 (Figure 1B). The double bond in AM was substituted with a hydroxyl group or a phenyl ring in mercaptoethanol and benzyl mercaptan, respectively, whereas the sulfhydryl moiety was replaced by a hydroxyl group in allyl alcohol. At the concentrations used here, none of the structural analogues inhibited HDAC activity in HeLa nuclear extracts (Figure 1B, top). However, with 20 μM AM in the assay, HDAC activity was inhibited by 45.6% in HeLa nuclear extracts and by 57.7% using purified human HDAC8 (Figure 1B, top and bottom, respectively). HDAC8 was inhibited by 15% with 20 μM benzyl mercaptan in the assay, and no effect was observed with 20 μM mercaptoethanol or 20 μM allyl alcohol. At the highest concentration tested (200 μM), all compounds inhibited HDAC8 significantly, except for allyl alcohol, which lacks the sulfhydryl group. Thus, the relative order of inhibitory potency toward HDAC8 was as follows: AM > benzyl mercaptan > mercaptoethanol > allyl alcohol.
We next investigated the kinetics of HDAC8 inhibition by AM (Figure 1C). The Cornish-Bowden plot of S/V versus I generated a series of parallel lines, and the Dixon plot of 1/V versus I had lines that intersected above the x-axis, consistent with competitive type inhibition (38,39). The inhibitor constant (Ki) was estimated to be 24 μM by linear regression analysis of the Dixon plot. The competitive mechanism also was supported by molecular docking studies, based on the available crystal structure of human HDAC8 with bound inhibitor (40). Preliminary docking in a non-bonded model confirmed that AM fit into the catalytic site of HDAC8 without steric hindrance (Figure 1D, left). The free energy of AM binding to HDAC8 was estimated to be −30 kcal/mol. Hydrophobic interactions were predicted between various residues of the pocket and AM, which favored localization of the ligand deep within the enzyme active site. Moreover, in an optimized truncated model, a strong interaction was predicted (−120 kcal/mol) between the zinc atom of HDAC8 and the sulfur atom of AM. In the final lowest energy structure computed, the sulfur atom of AM was located at 2.25 Å from the zinc atom (Figure 1D, right), suggesting that the zinc–sulfur interaction might drive AM binding within the HDAC8 active site.
HDAC inhibition and histone acetylation in HT29 cells treated with AM
The HDAC inhibitory activity of AM was examined in human HT29 colon cancer cells, with TSA as a positive control. When HT29 cell extracts were treated directly with the test agents in a cell-free system, as described above for HeLa extracts, the IC50 values for inhibition of HDAC activity by AM and TSA were 20 μM and 5 nM, respectively (Figure 2A). However, much higher concentrations of AM and TSA were needed with intact cells. Specifically, a 25- to 100-fold higher dose of AM (0.5–2.0 mM) and a 20- to 40-fold higher dose of TSA (0.1–0.2 μM) gave comparable HDAC inhibition with the cell-free assay system (Figure 2B). For both compounds, dose-dependent inhibition of HDAC activity was detected within 10 min of treatment, and the inhibition was significant at various times up to 72 h in HT29 cells (Figure 2B).
Fig. 2.
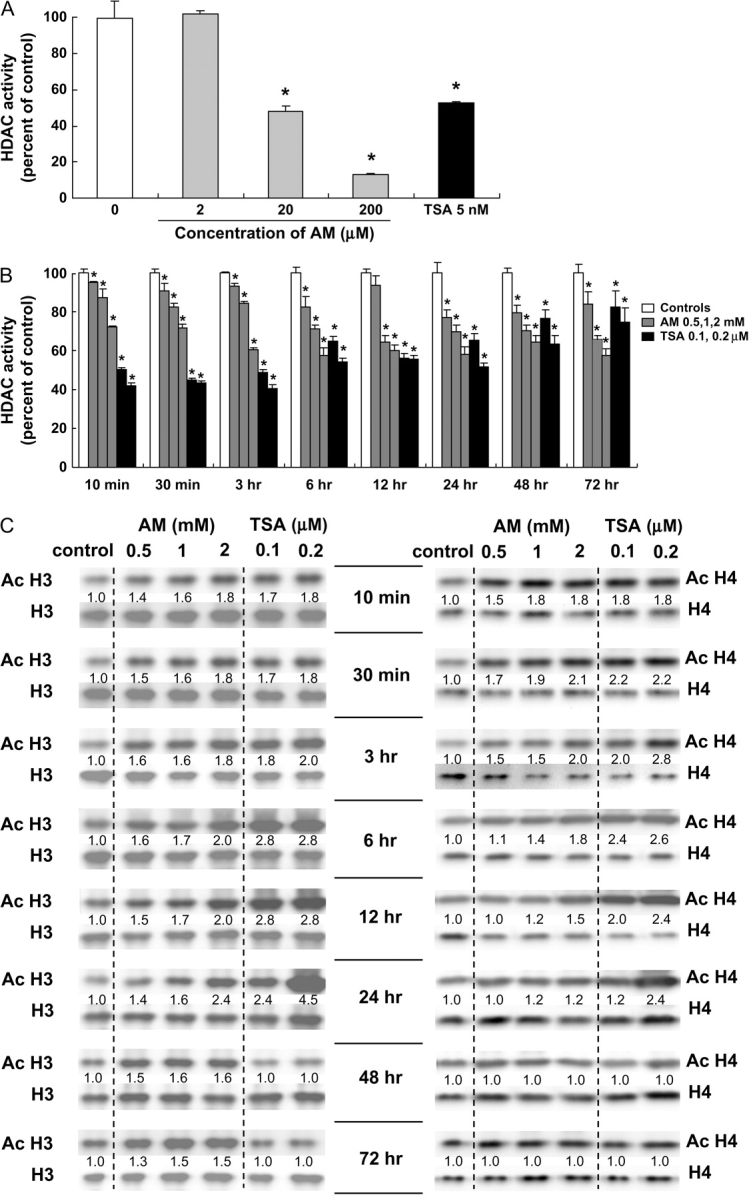
HDAC inhibition and histone acetylation in AM-treated HT29 cells. (A) Whole-cell extracts from human HT29 colon cancer cells were treated directly with the test agents and assayed for HDAC activity (BioMol kit). The IC50 for AM and TSA was 20 μM and 5 nM, respectively. Data = mean ± SD, n = 3, *P < 0.05. (B) HT29 cells were treated with AM (0.5, 1 and 2 mM) or TSA (0.1 and 0.2 μM) for selected times, from 10 min to 72 h, and whole-cell extracts were tested for HDAC activity. Data = mean ± SD, n = 3, *P < 0.05. (C) In the same cell lysates as (B), acetylated histones H3 and H4 were analyzed by immunoblotting. At each time point, acetylated histone expression was normalized to the corresponding non-acetylated histone, and this ratio was assigned an arbitrary value of 1.0 for the vehicle controls. Data are from a single experiment and are representative of findings from experiments repeated at least twice for each time point.
When normalized to H3, acetylated H3 was induced up to 1.8-fold within 10 min of AM or TSA treatment, as compared with the corresponding vehicle control (Figure 2C). At 24 h, acetylated histone H3 was increased 2.4-fold by 2 mM AM and 4.5-fold by 0.2 μM TSA. Acetylated H3 then returned to baseline in cells treated with TSA, but at 72 h acetylated H3 remained elevated 1.5-fold in cells treated with 1–2 mM AM. When normalized to H4, acetylated H4 was increased up to 1.8-fold within 10 min of AM or TSA treatment. Acetylated H4 was increased 2.1-fold 30 min after treatment with 2 mM AM and 2.8-fold 3 h after exposure to 0.2 μM TSA. Increases for acetylated H3 were dose dependent at various times up to 24 h after treatment with AM and at 10 min, 30 min, 3 h and 24 h after treatment with TSA. For acetylated H4, dose-dependent increases were detected at 30 min, 6 h and 12 h after treatment with AM and at 3, 6, 12 and 24 h after treatment with TSA. Because immunoblotting experiments with whole-cell lysates or isolated nuclear extracts might provide an averaging of acetylated histone status across the whole genome, subsequent work focused on a specific target gene of interest, namely P21WAF1.
Histone acetylation and recruitment of Sp3 and p53 to the P21WAF1 promoter
In cancer cells treated with HDAC inhibitors, histone hyperacetylation is commonly associated with the induction of p21 (9,10,41). In HT29 cells, p21 expression was induced by AM in both a time- and dose-dependent manner. After 1 h incubation with 0.5–2.0 mM AM, p21 mRNA was increased 2-fold, and a dose-dependent response was observed at 6 h, with 8-fold higher levels of p21 mRNA detected in cells treated with 2.0 mM AM (Figure 3A). A marked ∼5-fold increase in p21 mRNA expression was observed at 6 h in cells treated with 0.1 or 0.2 μM TSA, and a slight increase also was detected at 1 h in cells treated with 0.2 μM TSA. An increase in p21 protein expression also was observed within 3 h of AM treatment and to a lesser extent for TSA at 3 h (Figure 3B). However, p21 protein expression was increased markedly by TSA at 6, 12 and 24 h and then returned to control levels. For AM, the increase in p21 protein expression was dose dependent from 6 to 72 h.
Fig. 3.
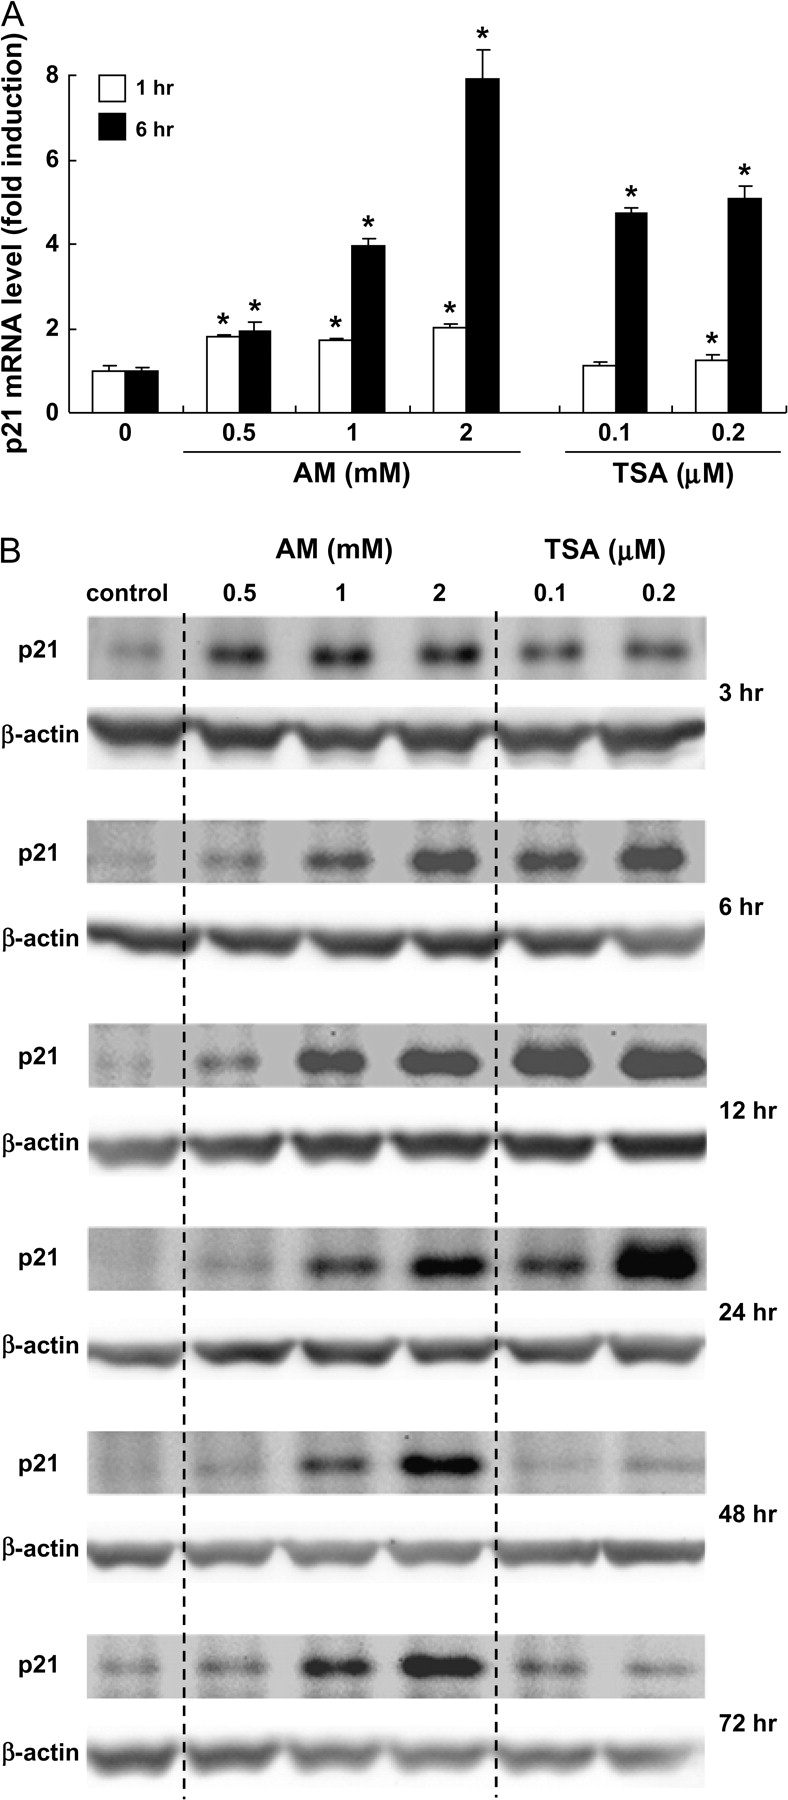
AM and TSA induce p21 expression in HT29 cells. (A) Real-time reverse transcription–PCR was used to quantify p21 mRNA expression after 1 and 6 h of treatment with AM (0.5, 1 and 2 mM) or TSA (0.1 and 0.2 μM). glyceraldehyde 3-phosphate dehydrogenase was used as internal control. Results are shown as fold induction, relative to the corresponding vehicle controls; mean ± SD, n = 3, *P < 0.05. (B) Immunodetection of p21 protein expression with β-actin as loading control.
In subsequent experiments, ChIP analyses were performed using anti-acetylated histone H3 antibody followed by primers to selected regions within the P21WAF1 gene promoter (Figure 4A). After 4 h treatment with AM or TSA, there was a marked increase in the level of histone H3 acetylation associated with promoter regions d, f and g, but only a marginal increase was detected in region h, downstream of the 5′ flanking region. The Sp1 family of transcription factors has been implicated in the induction of p21 by HDAC inhibitors (42), and promoter region g contains six potential Sp1/Sp3-binding sites plus the initiation codon. Within 4 h of AM or TSA treatment, there was an increase in Sp3, but not Sp1, associated with promoter region g (Figure 4B).
Fig. 4.

Histone acetylation and transcription factor binding to P21WAF1. (A) Schematic representation of the P21WAF1 promoter showing p53 and Sp1/Sp3-binding sites and regions amplified by PCR after ChIP. HT29 cells were treated with dimethylsulfoxide (control, Ctr), AM or TSA for 4 h and ChIP was performed with anti-acetylated H3 antibody followed by primers to regions d, f and g in the 5′ promoter or region h further downstream. IgG was used as negative control, and input samples were used as positive controls for PCR amplification. (B) The ChIP assay in (A) was repeated using anti-Sp1 or anti-Sp3 antibodies and primers to region g (−343 to +41), which contains multiple Sp1/Sp3-binding sites. (C) The ChIP assay was repeated at 4 and 24 h after TSA or AM treatment, using anti-p53 antibody, followed by primers to regions a–d, as shown. Region e, which lacks a p53-binding site, was used as a control in some experiments. (D) Acetylated H3, Sp1, Sp3 and p53 DNA pull downs from the ChIP assay were quantified by real-time PCR. Region b′: −3756 to −3906; region g′: −11 to −171. Data = mean ± SD, n = 3, *P < 0.05.
As illustrated in Figure 4A, the P21WAF1 promoter also contains p53-binding sites at positions −4001 (region a), −3764 (region b), −2311 and −2276 (region c) and −1391 (region d). For regions a–d, ChIP assays with anti-p53 antibody produced only weak bands at 4 h (Figure 4C, upper panels). At 24 h, however, there was a strong increase in p53 associated with regions a and b after TSA exposure and for region b after AM treatment. Subsequent experiments used quantitative PCR to assess ChIP signals (Figure 4D). Four hours after treatment with AM and TSA, there was a significant increase in acetylated H3 and Sp3 associated with region g′, and p53 was increased significantly in region b′ at 24 h. The timing of these changes suggested that AM and TSA increased the binding of Sp3 within 4 h, followed at a later time by p53 binding to upstream enhancer regions in the P21WAF1 promoter.
Growth inhibition and cell cycle arrest
Finally, we examined the effects of AM and TSA treatment on the growth of HT29 cells. In the 3-(4,5-dimethylthiazol-2-yl)-2,5-diphenyltetrazolium bromide assay (Figure 5A), AM and TSA inhibited cell growth in a time- and dose-dependent manner. Approximately 50% reduction in cell density was observed with 2 mM AM and 0.2 μM TSA after 48 h incubation. Analysis of the DNA content by flow cytometry (Figure 5B) showed that AM and TSA both caused a dramatic decrease in the percentage of cells in S phase. Under the present conditions, AM-treated cells were arrested preferentially in G1, and a similar finding was obtained using 0.1 μM TSA. At the higher concentration of 0.2 μM TSA, more of the cells were arrested in G2 versus G1, and virtually none were detected in S phase.
Fig. 5.

AM and TSA inhibited cell proliferation and induced cell cycle arrest. (A) Growth arrest in HT29 cells treated with AM or TSA, detected using the 3-(4,5-dimethylthiazol-2-yl)-2,5-diphenyltetrazolium bromide assay. Data = mean ± SD, n = 3, *P < 0.05. (B) DNA content as determined by flow cytometry (see Material and Methods). Results are representative of the findings from three independent experiments. For clarity, statistical outcomes associated with AM- or TSA-induced changes in G1, S and G2 cell cycle distribution versus vehicle control were omitted from the figure (*P < 0.05, all treatments).
Discussion
Potent HDAC inhibitors such as TSA and suberoylanilide hydroxamic acid induce histone acetylation and derepress target genes such as P21WAF1 and BAX, triggering cell cycle arrest and apoptosis in cancer cells (15,43). Similar findings have been reported for dietary constituents that act as weak HDAC ligands, such as butyrate and sulforaphane (44). With the exception of trapoxin and depudesin, most HDAC inhibitors block substrate access to the HDAC active site in a reversible fashion (43). We found that AM was a competitive HDAC inhibitor in vitro with a Ki of 24 μM for human HDAC8. Molecular docking studies revealed favorable energetic conditions for AM binding in the HDAC8 active site, with the sulfhydryl group of AM ideally positioned to interact with the catalytic zinc at the base of the HDAC pocket. Thiol compounds are well known to inhibit zinc-dependent enzymes (45,46), and synthetic agents containing an -(CH)2-SH group were reported to be strong HDAC inhibitors due to -S–Zn- binding within the active site (47). The sulfhydryl group of AM was clearly important since HDAC inhibition was abolished in assays using allyl alcohol. HDAC inhibition also was diminished with mercaptoethanol, which contains a thiol group, but has higher water solubility than AM. We speculate that this lowers the affinity of mercaptoethanol for the hydrophobic pocket of HDAC8, but further work is needed to confirm this possibility. One interesting feature distinguishing HDAC8 from other HDAC enzymes is that it has a wider active site pocket and larger surface opening (37). This might explain why the more bulky benzyl mercaptan molecule was able to inhibit HDAC8, but was less effective with HeLa nuclear extracts containing other HDACs (data not presented). In contrast to DADS, SAC and SAMC, the small size of AM makes it a good fit for multiple HDAC enzymes; indeed, the extent of inhibition by AM was similar for HDAC8, HeLa extracts and HT29 cell lysates.
In HT29 cells, we detected inhibition of HDAC activity and increased histone acetylation within 10 min of AM and TSA treatment. Acetylated histone H3 was increased for up to 24 h after TSA treatment and for 72 h following AM exposure. A similar time course was observed for p21 protein expression, with 0.1–0.2 μM TSA increasing p21 for up to 24 h and 1–2 mM AM increasing p21 for up to 72 h. One interpretation is that TSA is a potent, transient-acting HDAC inhibitor, whereas AM is less potent but exerts a more sustained level of inhibition.
A common target of HDAC inhibitors is p21, which controls transition through the cell cycle via the inhibition of cyclin-dependent kinases (48). In the present study, induction of p21 by AM was associated with arrest in G1 of the cell cycle. For TSA, the relative distribution of cells in G1 versus G2 depended on the dose of HDAC inhibitor used in the experiment. This might be explained by mechanisms affecting other cell cycle regulators (49), such as Akt, checkpoint kinase 1 and the c-Jun NH(2)-terminal kinase signaling axis, which have been implicated in prior studies with garlic organosulfur compounds (50–52).
HDAC inhibitors increase the levels of histone acetylation, which facilitates chromatin remodeling and recruitment of transcription factors to target genes. In prior studies with HDAC inhibitors butyrate and suberoylanilide hydroxamic acid (53,54), changes in histone acetylation status and Sp1/Sp3 binding were observed on the promoter region of P21WAF1. We confirmed that, within 4 h of AM and TSA treatment, Sp3 was recruited to the P21WAF1 promoter, concurrent with increased histone acetylation. No increase was seen for Sp1 under the same conditions. Further studies are needed to establish the mechanism by which Sp3 was selectively targeted to P21WAF1 and whether the acetylation status of the transcription factor itself was altered (55,56). Although Sp3 acts as a transcriptional repressor in some scenarios, HAT activity acetylates Sp3 leading to promoter activation (56). Thus, Sp1/Sp3 activity may be determined by the dynamic balance between HATs and HDACs in their vicinity. Indeed, while direct interactions between Sp1/Sp3 and p300/cyclic AMP response element-binding protein CBP were associated with promoter activation upon HDAC inhibitor treatment (57), Sp1/Sp3 also mediated the repression of P21WAF1 by HDAC1–3 in colon cancer cells (58). Post-translational modifications of Sp1/Sp3 also were implicated in P21WAF1 transcriptional activation by TSA (59,60). We did not detect any change in global HAT activity following AM treatment in HT29 cells (data not shown), but the trafficking of transcriptional coactivators to the P21WAF1 promoter, such as p300/CBP and CBP/p300-associated factor (P/CAF), should be examined in more detail, due to their intrinsic HAT activity (61,62).
It has been reported that acetylation of wild-type p53 can increase its half-life and binding to the P21WAF1 promoter (63,64). The mutant form of p53 that is overexpressed in HT29 cells, namely p53R273H, is believed to be responsible for silencing p21 and various strategies have been sought to rescue p53R273H in cancer cells and restore normal p53 target gene expression (65). Recently, Vikhanskaya et al. (66) studied functional mutants of p53 and reported that repression of p21 by p53R273H was abolished by TSA treatment. Under the present conditions, p53 interaction with the P21WAF1 promoter was barely detectable in ChIP assays at 4 h, but it was clearly observed at 24 h after TSA and AM treatment, localized in the upstream (distal) enhancer region. Little is known about P21WAF1 promoter regulation by p53R273H, but the results of this study and others (66,67) support the view that p53 mutant-mediated suppression of target genes is dependent on HDAC activity. It is noteworthy that the eventual loss of p21 induction by TSA at 24 h coincided with increased binding of p53 at two sites in the proximal promoter (a and b, Figure 4C), compared with only one site for AM, in which p21 remained elevated for up to 72 h. Further work is needed to clarify the role of specific p53 mutants, their binding sites in the P21WAF1 promoter and the response to various HDAC inhibitors.
Based on the results of the present study, we conclude that the chemopreventive effects of garlic organosulfur compounds may be due, in part, to their metabolic conversion to AM followed by HDAC inhibition. An important issue for future work will be to assess the relevant levels of AM achieved in situ since exogenous application of AM (and TSA) to human colon cancer cells required much higher concentrations to affect HDAC activity than with the cell-free assays. Concentrations in the range 0.2–2 mM were used in prior mechanistic studies with DADS, SAMC, AM and other garlic-derived organosulfur compounds (28–30), although 40 μM diallyl trisulfide was reported to inactivate Akt and trigger caspase-mediated apoptosis in human prostate cancer cells (51). It remains to be determined whether the ingestion of multiple organosulfur compounds in garlic might generate intracellular concentrations of AM on the order ∼20 μM, which could inhibit HDAC activity in colonic epithelial cells or systemic tissues such as prostate, for which anticarcinogenic effects have been reported (23–30,49–52,68).
In summary, we provide here the first evidence that AM acts a competitive HDAC inhibitor in vitro, with a Ki on the order of 24 μM for human HDAC8. In HT29 cells, inhibition of HDAC activity by AM coincided with increased global histone acetylation, as well as localized hyperacetylation of histone H3 on the P21WAF1 promoter. Recruitment of Sp3 to the P21WAF1 promoter occurred within 4 h of AM exposure and was followed by the subsequent binding of p53 to the distal enhancer region. Induction of p21 was both rapid and sustained and was associated with a dose-dependent G1 arrest in AM-treated HT29 cells. It will be interesting to examine the cooperative effects of garlic organosulfur compounds, and other reported dietary HDAC inhibitors (14,15,44), in combination with drugs that reverse DNA methylation and epigenetic gene silencing, with the potential for improved therapeutic efficacy (69,70).
Funding
USA National Cancer Institute (CA090890, CA065525 and CA122959); Environmental Health Sciences Center grant from National Institute of Environmental Health Sciences (P30 ES00210).
Acknowledgments
We thank Dr. Kevin P.Gable (Department of Chemistry, Oregon State University) for his kind assistance with molecular modeling studies.
Conflict of Interest Statement: None declared.
Glossary
Abbreviations
- AM
allyl mercaptan
- ChIP
chromatin immunoprecipitation
- DADS
diallyl disulfide
- HAT
histone acetyltransferase
- HDAC
histone deacetylase
- mRNA
messenger RNA
- PCR
polymerase chain reaction
- SAC
S-allyl cysteine
- SAMC
S-allyl mercaptocysteine
- TSA
trichostatin A
References
- 1.Kondo Y, et al. Epigenetic changes in colorectal cancer. Cancer Metastasis Rev. 2004;23:29–39. doi: 10.1023/a:1025806911782. [DOI] [PubMed] [Google Scholar]
- 2.Hellebrekers DM, et al. Identification of epigenetically silenced genes in tumor endothelial cells. Cancer Res. 2007;67:4138–4148. doi: 10.1158/0008-5472.CAN-06-3032. [DOI] [PubMed] [Google Scholar]
- 3.Taniguchi H, et al. Frequent epigenetic inactivation of Wnt inhibitory factor-1 in human gastrointestinal cancers. Oncogene. 2005;24:7946–7952. doi: 10.1038/sj.onc.1208910. [DOI] [PubMed] [Google Scholar]
- 4.Wade PA. Transcriptional control at regulatory checkpoints by histone deacetylases: molecular connections between cancer and chromatin. Hum. Mol. Genet. 2001;10:693–698. doi: 10.1093/hmg/10.7.693. [DOI] [PubMed] [Google Scholar]
- 5.McLaughlin F, et al. Histone deacetylase inhibitors open new doors in cancer therapy. Biochem. Pharmacol. 2004;68:1139–1144. doi: 10.1016/j.bcp.2004.05.034. [DOI] [PubMed] [Google Scholar]
- 6.Mitsiades CS, et al. Transcriptional signature of histone deacetylase inhibition in multiple myeloma: biological and clinical implications. Proc. Natl Acad. Sci. USA. 2004;101:540–545. doi: 10.1073/pnas.2536759100. [DOI] [PMC free article] [PubMed] [Google Scholar]
- 7.Mitic T, et al. Immunohistochemical analysis of acetylation, proliferation, mitosis, and apoptosis in tumor xenografts following administration of a histone deacetylase inhibitor—a pilot study. Toxicol. Pathol. 2005;33:792–799. doi: 10.1080/01926230500459435. [DOI] [PubMed] [Google Scholar]
- 8.Butler LM, et al. The histone deacetylase inhibitor SAHA arrests cancer cell growth, up-regulates thioredoxin-binding protein-2, and down-regulates thioredoxin. Proc. Natl Acad. Sci. USA. 2002;99:11700–11705. doi: 10.1073/pnas.182372299. [DOI] [PMC free article] [PubMed] [Google Scholar]
- 9.Glaser KB, et al. Gene expression profiling of multiple histone deacetylase (HDAC) inhibitors: defining a common gene set produced by HDAC inhibition in T24 and MDA carcinoma cell lines. Mol. Cancer Ther. 2003;2:151–163. [PubMed] [Google Scholar]
- 10.Kumagai T, et al. Histone deacetylase inhibitor, suberoylanilide hydroxamic acid (Vorinostat, SAHA) profoundly inhibits the growth of human pancreatic cancer cells. Int. J. Cancer. 2007;121:656–665. doi: 10.1002/ijc.22558. [DOI] [PubMed] [Google Scholar]
- 11.Okamoto H, et al. Trichostatin A, an inhibitor of histone deacetylase, inhibits smooth muscle cell proliferation via induction of p21(WAF1) J. Atheroscler. Thromb. 2006;13:183–191. doi: 10.5551/jat.13.183. [DOI] [PubMed] [Google Scholar]
- 12.Rocchi P, et al. p21Waf1/Cip1 is a common target induced by short-chain fatty acid HDAC inhibitors (valproic acid, tributyrin and sodium butyrate) in neuroblastoma cells. Oncol. Rep. 2005;13:1139–1144. [PubMed] [Google Scholar]
- 13.Fantin VR, et al. Mechanisms of resistance to histone deacetylase inhibitors and their therapeutic implications. Clin. Cancer Res. 2007;13:7237–7242. doi: 10.1158/1078-0432.CCR-07-2114. [DOI] [PubMed] [Google Scholar]
- 14.Dashwood RH, et al. Dietary histone deacetylase inhibitors: from cells to mice to man. Semin. Cancer Biol. 2007;17:363–369. doi: 10.1016/j.semcancer.2007.04.001. [DOI] [PMC free article] [PubMed] [Google Scholar]
- 15.Myzak MC, et al. Histone deacetylases as targets for dietary cancer preventive agents: lessons learned with butyrate, diallyl disulfide, and sulforaphane. Curr. Drug Targets. 2006;7:443–452. doi: 10.2174/138945006776359467. [DOI] [PubMed] [Google Scholar]
- 16.Chen C, et al. Dietary cancer-chemopreventive compounds: from signaling and gene expression to pharmacological effects. Trends Pharmacol. Sci. 2005;26:318–326. doi: 10.1016/j.tips.2005.04.004. [DOI] [PubMed] [Google Scholar]
- 17.Shukla Y, et al. Cancer chemoprevention with garlic and its constituents. Cancer Lett. 2007;247:167–181. doi: 10.1016/j.canlet.2006.05.009. [DOI] [PubMed] [Google Scholar]
- 18.Ross SA, et al. Allyl sulfur compounds from garlic modulate aberrant crypt formation. J. Nutr. 2006;136:852S–854S. doi: 10.1093/jn/136.3.852S. [DOI] [PubMed] [Google Scholar]
- 19.Belloir C, et al. Protective effects of garlic sulfur compounds against DNA damage induced by direct- and indirect-acting genotoxic agents in HepG2 cells. Food Chem. Toxicol. 2006;44:827–834. doi: 10.1016/j.fct.2005.11.005. [DOI] [PubMed] [Google Scholar]
- 20.Millen AE, et al. Fruit and vegetable intake and prevalence of colorectal adenoma in a cancer screening trial. Am. J. Clin. Nutr. 2007;86:1754–1764. doi: 10.1093/ajcn/86.5.1754. [DOI] [PubMed] [Google Scholar]
- 21.Block E. The chemistry of garlic and onions. Sci. Am. 1985;252:114–119. doi: 10.1038/scientificamerican0385-114. [DOI] [PubMed] [Google Scholar]
- 22.Rosen RT, et al. The determination of metabolites of garlic preparations in breath and human plasma. Biofactors. 2000;13:241–249. doi: 10.1002/biof.5520130137. [DOI] [PubMed] [Google Scholar]
- 23.Sheen LY, et al. Metabolites of diallyl disulfide and diallyl sulfide in primary rat hepatocytes. Food Chem. Toxicol. 1999;37:1139–1146. doi: 10.1016/s0278-6915(99)00108-8. [DOI] [PubMed] [Google Scholar]
- 24.Ameen M, et al. Garlic attenuates chrysotile-mediated pulmonary toxicity in rats by altering the phase I and phase II drug metabolizing enzyme system. J. Biochem. Mol. Toxicol. 2003;17:366–371. doi: 10.1002/jbt.10100. [DOI] [PubMed] [Google Scholar]
- 25.Chen C, et al. Induction of detoxifying enzymes by garlic organosulfur compounds through transcription factor Nrf2: effect of chemical structure and stress signals. Free Radic. Biol. Med. 2004;37:1578–1590. doi: 10.1016/j.freeradbiomed.2004.07.021. [DOI] [PubMed] [Google Scholar]
- 26.Herman-Antosiewicz A, et al. Signal transduction pathways leading to cell cycle arrest and apoptosis induction in cancer cells by Allium vegetable-derived organosulfur compounds: a review. Mutat. Res. 2004;555:121–131. doi: 10.1016/j.mrfmmm.2004.04.016. [DOI] [PubMed] [Google Scholar]
- 27.Sambucetti LC, et al. Histone deacetylase inhibition selectively alters the activity and expression of cell cycle proteins leading to specific chromatin acetylation and antiproliferative effects. J. Biol. Chem. 1999;274:34940–34947. doi: 10.1074/jbc.274.49.34940. [DOI] [PubMed] [Google Scholar]
- 28.Lea MA, et al. Induction of histone acetylation in mouse erythroleukemia cells by some organosulfur compounds including allyl isothiocyanate. Int. J. Cancer. 2001;92:784–789. doi: 10.1002/ijc.1277. [DOI] [PubMed] [Google Scholar]
- 29.Lea MA, et al. Induction of histone acetylation and inhibition of growth of mouse erythroleukemia cells by S-allylmercaptocysteine. Nutr. Cancer. 2002;43:90–102. doi: 10.1207/S15327914NC431_11. [DOI] [PubMed] [Google Scholar]
- 30.Druesne N, et al. Diallyl disulfide (DADS) increases histone acetylation and p21(waf1/cip1) expression in human colon tumor cell lines. Carcinogenesis. 2004;25:1227–1236. doi: 10.1093/carcin/bgh123. [DOI] [PubMed] [Google Scholar]
- 31.Myzak MC, et al. A novel mechanism of chemoprotection by sulforaphane: inhibition of histone deacetylase. Cancer Res. 2004;64:5767–5774. doi: 10.1158/0008-5472.CAN-04-1326. [DOI] [PubMed] [Google Scholar]
- 32.Myzak MC, et al. Sulforaphane inhibits histone deacetylase in vivo and suppresses tumorigenesis in Apc-minus mice. FASEB J. 2006;20:506–508. doi: 10.1096/fj.05-4785fje. [DOI] [PMC free article] [PubMed] [Google Scholar]
- 33.Myzak MC, et al. Sulforaphane inhibits histone deacetylase activity in BPH-1, LnCaP and PC-3 prostate epithelial cells. Carcinogenesis. 2006;27:811–819. doi: 10.1093/carcin/bgi265. [DOI] [PMC free article] [PubMed] [Google Scholar]
- 34.Myzak MC, et al. Sulforaphane retards the growth of human PC-3 xenografts and inhibits HDAC activity in human subjects. Exp. Biol. Med. (Maywood) 2007;232:227–234. [PMC free article] [PubMed] [Google Scholar]
- 35.Guida WC, et al. Probing the conformational space available to inhibitors in the thermolysin active site using Monte Carlo/Energy minimization techniques. J. Comput. Chem. 1992;13:214–228. [Google Scholar]
- 36.Suzuki T, et al. Novel inhibitors of human histone deacetylases: design, synthesis, enzyme inhibition, and cancer cell growth inhibition of SAHA-based non-hydroxamates. J. Med. Chem. 2005;48:1019–1032. doi: 10.1021/jm049207j. [DOI] [PubMed] [Google Scholar]
- 37.Somoza JR, et al. Structural snapshots of human HDAC8 provide insights into the class I histone deacetylases. Structure. 2004;12:1325–1334. doi: 10.1016/j.str.2004.04.012. [DOI] [PubMed] [Google Scholar]
- 38.Cornish-Bowden A. A simple graphical method for determining the inhibition constants of mixed, uncompetitive and non-competitive inhibitors. Biochem. J. 1974;137:143–144. doi: 10.1042/bj1370143. [DOI] [PMC free article] [PubMed] [Google Scholar]
- 39.Dixon M. The determination of enzyme inhibitor constants. Biochem. J. 1953;55:170–171. doi: 10.1042/bj0550170. [DOI] [PMC free article] [PubMed] [Google Scholar]
- 40.Vannini A, et al. Crystal structure of a eukaryotic zinc-dependent histone deacetylase, human HDAC8, complexed with a hydroxamic acid inhibitor. Proc. Natl Acad. Sci. USA. 2004;101:15064–15069. doi: 10.1073/pnas.0404603101. [DOI] [PMC free article] [PubMed] [Google Scholar]
- 41.Fang JY, et al. Effects of histone acetylation and DNA methylation on p21(WAF1) regulation. World J. Gastroenterol. 2002;8:400–405. doi: 10.3748/wjg.v8.i3.400. [DOI] [PMC free article] [PubMed] [Google Scholar]
- 42.Kim YK, et al. Expression of p21(WAF1/Cip1) through Sp1 sites by histone deacetylase inhibitor apicidin requires PI 3-kinase-PKC epsilon signaling pathway. Oncogene. 2003;22:6023–6031. doi: 10.1038/sj.onc.1206875. [DOI] [PubMed] [Google Scholar]
- 43.de Ruijter AJ, et al. Histone deacetylases (HDACs): characterization of the classical HDAC family. Biochem. J. 2003;370:737–749. doi: 10.1042/BJ20021321. [DOI] [PMC free article] [PubMed] [Google Scholar]
- 44.Davis CD, et al. Dietary components impact histone modifications and cancer risk. Nutr. Rev. 2007;65:88–94. doi: 10.1111/j.1753-4887.2007.tb00285.x. [DOI] [PubMed] [Google Scholar]
- 45.Ondetti MA, et al. Design of specific inhibitors of angiotensin-converting enzyme: new class of orally active antihypertensive agents. Science. 1977;196:441–444. doi: 10.1126/science.191908. [DOI] [PubMed] [Google Scholar]
- 46.Whittaker M, et al. Design and therapeutic application of matrix metalloproteinase inhibitors. Chem. Rev. 1999;99:2735–2776. doi: 10.1021/cr9804543. [DOI] [PubMed] [Google Scholar]
- 47.Suzuki T, et al. Thiol-based SAHA analogues as potent histone deacetylase inhibitors. Bioorg. Med. Chem. Lett. 2004;14:3313–3317. doi: 10.1016/j.bmcl.2004.03.063. [DOI] [PubMed] [Google Scholar]
- 48.Niculescu AB, III, et al. Effects of p21(Cip1/Waf1) at both the G1/S and the G2/M cell cycle transitions: pRb is a critical determinant in blocking DNA replication and in preventing endoreduplication. Mol. Cell. Biol. 1998;18:629–643. doi: 10.1128/mcb.18.1.629. [DOI] [PMC free article] [PubMed] [Google Scholar]
- 49.Iacomino G, et al. Effects of histone deacetylase inhibitors on p55CDC/Cdc20 expression in HT29 cell line. J. Cell. Biochem. 2006;99:1122–1131. doi: 10.1002/jcb.21014. [DOI] [PubMed] [Google Scholar]
- 50.Antosiewicz J, et al. c-Jun NH(2)-terminal kinase signaling axis regulates diallyl trisulfide-induced generation of reactive oxygen species and cell cycle arrest in human prostate cancer cells. Cancer Res. 2006;66:5379–5386. doi: 10.1158/0008-5472.CAN-06-0356. [DOI] [PubMed] [Google Scholar]
- 51.Xiao D, et al. Diallyl trisulfide, a constituent of processed garlic, inactivates Akt to trigger mitochondrial translocation of BAD and caspase-mediated apoptosis in human prostate cancer cells. Carcinogenesis. 2006;27:533–540. doi: 10.1093/carcin/bgi228. [DOI] [PubMed] [Google Scholar]
- 52.Herman-Antosiewicz A, et al. Checkpoint kinase 1 regulates diallyl trisulfide-induced mitotic arrest in human prostate cancer cells. J. Biol. Chem. 2005;280:28519–28528. doi: 10.1074/jbc.M501443200. [DOI] [PubMed] [Google Scholar]
- 53.Kobayashi H, et al. Acetylation of histones associated with the p21WAF1/CIP1 gene by butyrate is not sufficient for p21WAF1/CIP1 gene transcription in human colorectal adenocarcinoma cells. Int. J. Cancer. 2004;109:207–213. doi: 10.1002/ijc.11697. [DOI] [PubMed] [Google Scholar]
- 54.Huang L, et al. Activation of the p21WAF1/CIP1 promoter independent of p53 by the histone deacetylase inhibitor suberoylanilide hydroxamic acid (SAHA) through the Sp1 sites. Oncogene. 2000;19:5712–5719. doi: 10.1038/sj.onc.1203963. [DOI] [PubMed] [Google Scholar]
- 55.Ryu H, et al. Histone deacetylase inhibitors prevent oxidative neuronal death independent of expanded polyglutamine repeats via an Sp1-dependent pathway. Proc. Natl Acad. Sci. USA. 2003;100:4281–4286. doi: 10.1073/pnas.0737363100. [DOI] [PMC free article] [PubMed] [Google Scholar]
- 56.Ammanamanchi S, et al. Acetylated sp3 is a transcriptional activator. J. Biol. Chem. 2003;278:35775–35780. doi: 10.1074/jbc.M305961200. [DOI] [PubMed] [Google Scholar]
- 57.Xiao H, et al. p300 collaborates with Sp1 and Sp3 in p21(waf1/cip1) promoter activation induced by histone deacetylase inhibitor. J. Biol. Chem. 2000;275:1371–1376. doi: 10.1074/jbc.275.2.1371. [DOI] [PubMed] [Google Scholar]
- 58.Wilson AJ, et al. Histone deacetylase 3 (HDAC3) and other class I HDACs regulate colon cell maturation and p21 expression and are deregulated in human colon cancer. J. Biol. Chem. 2006;281:13548–13558. doi: 10.1074/jbc.M510023200. [DOI] [PubMed] [Google Scholar]
- 59.Sowa Y, et al. Sp3, but not Sp1, mediates the transcriptional activation of the p21/WAF1/Cip1 gene promoter by histone deacetylase inhibitor. Cancer Res. 1999;59:4266–4270. [PubMed] [Google Scholar]
- 60.Xiao H, et al. Both Sp1 and Sp3 are responsible for p21waf1 promoter activity induced by histone deacetylase inhibitor in NIH3T3 cells. J. Cell. Biochem. 1999;73:291–302. [PubMed] [Google Scholar]
- 61.Suzuki T, et al. Regulation of interaction of the acetyltransferase region of p300 and the DNA-binding domain of Sp1 on and through DNA binding. Genes Cells. 2000;5:29–41. doi: 10.1046/j.1365-2443.2000.00302.x. [DOI] [PubMed] [Google Scholar]
- 62.Huang W, et al. Trichostatin A induces transforming growth factor beta type II receptor promoter activity and acetylation of Sp1 by recruitment of PCAF/p300 to a Sp1.NF-Y complex. J. Biol. Chem. 2005;280:10047–10054. doi: 10.1074/jbc.M408680200. [DOI] [PubMed] [Google Scholar]
- 63.Zhao Y, et al. Acetylation of p53 at lysine 373/382 by the histone deacetylase inhibitor depsipeptide induces expression of p21(Waf1/Cip1) Mol. Cell. Biol. 2006;26:2782–2790. doi: 10.1128/MCB.26.7.2782-2790.2006. [DOI] [PMC free article] [PubMed] [Google Scholar]
- 64.Roy S, et al. Site-specific acetylation of p53 directs selective transcription complex assembly. J. Biol. Chem. 2007;282:4765–4771. doi: 10.1074/jbc.M609588200. [DOI] [PubMed] [Google Scholar]
- 65.Bossi G, et al. Restoration of wild-type p53 function in human cancer: relevance for tumor therapy. Head Neck. 2007;29:272–284. doi: 10.1002/hed.20529. [DOI] [PubMed] [Google Scholar]
- 66.Vikhanskaya F, et al. Cancer-derived p53 mutants suppress p53-target gene expression–potential mechanism for gain of function of mutant p53. Nucleic Acids Res. 2007;35:2093–2104. doi: 10.1093/nar/gkm099. [DOI] [PMC free article] [PubMed] [Google Scholar]
- 67.Blagosklonny MV, et al. Depletion of mutant p53 and cytotoxicity of histone deacetylase inhibitors. Cancer Res. 2005;65:7386–7392. doi: 10.1158/0008-5472.CAN-04-3433. [DOI] [PubMed] [Google Scholar]
- 68.Davenport DM, et al. Modulation of cytochrome P450 enzymes by organosulfur compounds from garlic. Food Chem. Toxicol. 2005;43:1753–1762. doi: 10.1016/j.fct.2005.05.018. [DOI] [PubMed] [Google Scholar]
- 69.Walton TJ, et al. DNA demethylation and histone deacetylation inhibition cooperate to re-express estrogen receptor beta to induce apoptosis in prostate cancer cell lines. Prostate. 2008;68:210–222. doi: 10.1002/pros.20673. [DOI] [PubMed] [Google Scholar]
- 70.Zhu WG, et al. The interaction of histone deacetylase inhibitors and DNA methyltransferase inhibitors in the treatment of human cancer cells. Curr. Med. Chem. Anticancer Agents. 2003;3:187–199. doi: 10.2174/1568011033482440. [DOI] [PubMed] [Google Scholar]