

Abstract
The physicochemical properties of nanomaterials differ from those of the bulk material of the same composition. However, little is known about the underlying effects of these particles in carcinogenesis. The purpose of this study was to determine the mechanisms involved in the carcinogenic properties of nanoparticles using aluminum oxide (Al2O3/alumina) nanoparticles as the prototype. Well-established mouse epithelial JB6 cells, sensitive to neoplastic transformation, were used as the experimental model. We demonstrate that alumina was internalized and maintained its physicochemical composition inside the cells. Alumina increased cell proliferation (53%), proliferating cell nuclear antigen (PCNA) levels, cell viability and growth in soft agar. The level of manganese superoxide dismutase, a key mitochondrial antioxidant enzyme, was elevated, suggesting a redox signaling event. In addition, the levels of reactive oxygen species and the activities of the redox sensitive transcription factor activator protein-1 (AP-1) and a longevity-related protein, sirtuin 1 (SIRT1), were increased. SIRT1 knockdown reduces DNA synthesis, cell viability, PCNA levels, AP-1 transcriptional activity and protein levels of its targets, JunD, c-Jun and BcL-xl, more than controls do. Immunoprecipitation studies revealed that SIRT1 interacts with the AP-1 components c-Jun and JunD but not with c-Fos. The results identify SIRT1 as an AP-1 modulator and suggest a novel mechanism by which alumina nanoparticles may function as a potential carcinogen.
Introduction
The rapidly evolving field of nanotechnology has increased human exposure to engineered nanoparticles (diameter < 100 nm) via inhalation, oral, dermal and injection routes. Despite the wide application of nanoparticles and highly publicized benefits of industrial and medical applications, sufficient knowledge of potential toxicity and human health risk is lacking. The unique physicochemical properties of nanoparticles are attributable to their particle size, distribution, chemical composition, surface area, surface chemistry and surface charge, which differ from bulk materials of the same compositions (1,2). Some of the nanomaterials used are primarily of metals and metal oxides of Al, Fe, Au, Si, Pd, Ce, Zn and Ti. To date, the majority of studies shows that inhalation of toxic metals and metal oxides leads to lung cancer and implicates reactive oxygen species (ROS) in oxidative stress-related inflammatory functions, cardiovascular injury and lung cytotoxicity (2–8).
Little is known about the effect of these particles on skin carcinogenesis, particularly the effect of oxides of non-transition metals such as aluminum oxide (Al2O3). Aluminum has a very strong oxide film on its surface that generally inhibits corrosion and chemical attack. Aluminum flake is commonly used in metallic paints, cosmetics and medical devices. Aluminum is known to be toxic (9,10). The International Agency for Research on Cancer, the National Toxicology Program and others have classified alumina fibers, commonly known as ceramic fibers, as possible human carcinogens (Group 2B) (11). Aluminum used in antiperspirants has the potential to cause breast cancer by entering the lymphatic system (12,13). In addition, epidemiological studies of drinking water and food have implicated aluminum as a potential risk factor in cognitive impairment in the elderly and in Alzheimer’s disease (14). However, the potential skin carcinogenic effect of aluminum is unknown.
To explore the carcinogenic potential of aluminum oxide nanoparticles, we used mouse epithelial cells JB6 (cl41-5a) as an in vitro model of skin carcinogenesis. JB6 cells are sensitive to neoplastic transformation by tumor promoter phorbol esters, such as 12-O-tetradecanoylphorbol-13-acetate (TPA) (15). In this model, activation of the activator protein-1 (AP-1) is a well-established event associated with tumor promotion (16).
Sirtuin 1 (SIRT1), a type III nicotinamide adenine dinucleotide-dependent histone/protein deacetylase, is of particular interest because of its pleiotropic nature (17). SIRT1 regulates a variety of stress response cellular and molecular processes such as survival, neuronal protection, aging, calorie restriction, glucose metabolism and longevity (18–20). Interaction between SIRT1 and transcriptional coactivator peroxisome proliferator-activated receptor-γ coactivator-1α, a key regulator of metabolism and mitochondrial biogenesis, has been demonstrated (21). In response to oxidative stress, mammalian SIRT1 physiologically interacts with Forkhead transcription factor (FOXO) and increases the transcription of FOXO target genes, including the primary antioxidant enzyme containing manganese superoxide dismutase (MnSOD) (22), suggesting that SIRT1 may play an important role in cell survival under oxidative stress conditions. Furthermore, in response to an increase in ROS concentration, there is an increase in MnSOD expression level in JB6 cells (23).
In this study, we investigated the carcinogenesis potential of alumina and identified a novel mechanism by which alumina may enhance cell proliferation by a SIRT1-mediated event.
Materials and methods
Preparation and characterization of alumina nanoparticles
Metal oxide nanoparticles prepared by gas-phase synthesis are often aggregated into much larger secondary particles. While commercial ‘nanoparticle’ products may have primary particles with the advertised diameters, the aggregates are often much >1 μm and may not physically pass through biological structures. In addition, metal oxides often have surface charges and tend to coagulate into agglomerates through their interactions with salts, buffers, proteins and/or themselves. We used the following procedure to produce nanoparticles with known particle size distributions from a commercial nanoparticle sample that formed a relatively stable suspension in polar solvents. Aluminum oxide (alumina) nanoparticles were purchased from Alfa Aesar (Ward Hill, MA) (item # 10459, CAS Reg. #1344-28-1, γ–α mixture, 99.98% purity, 10–20 nm diameter and surface area ∼100 m2/g). Transmission electron microscopic images (Jeol 2010F) (Figure 1A) verify that the purchased nanoparticles were aggregated with average diameters in the range of 500 nm on a vol % basis. X-ray diffraction shows that the sample was the gamma phase (data not shown). Aggregates were dispersed by ultrasonication. Alumina (2.5 g) was added into 47.5 g (5 wt %) of deionized, ultrafiltered water and sonicated at a power level of 50 W for 1 h using a Hielscher UP400s sonicator. The suspension was cooled continuously to prevent water evaporation. The product had 75 vol % particles <200 nm and 70 vol % <100 nm as determined by light scattering. The particles >100 nm were removed via centrifugation (1500g for 10 min, bowl radius = 6 cm and tube length = 5 cm). The larger particles accumulated at the bottom of the tube, and the top 1 cm of liquid in the tube was siphoned off as the product. The volume-fraction particle size distribution is shown in Figure 1B. Ninety-five vol % of the sample was between 8 and 12 nm in diameter, with the remainder ∼65 nm in diameter. The concentration of alumina in the supernatant fraction was 0.6 wt % as confirmed by atomic absorption spectrometry. The material shown in Figure 1B was relatively stable and did not coagulate much more when allowed to settle overnight. In such preparations, the particle size distribution could be recovered by brief sonication (30 s) at the same power level prior to use.
Fig. 1.
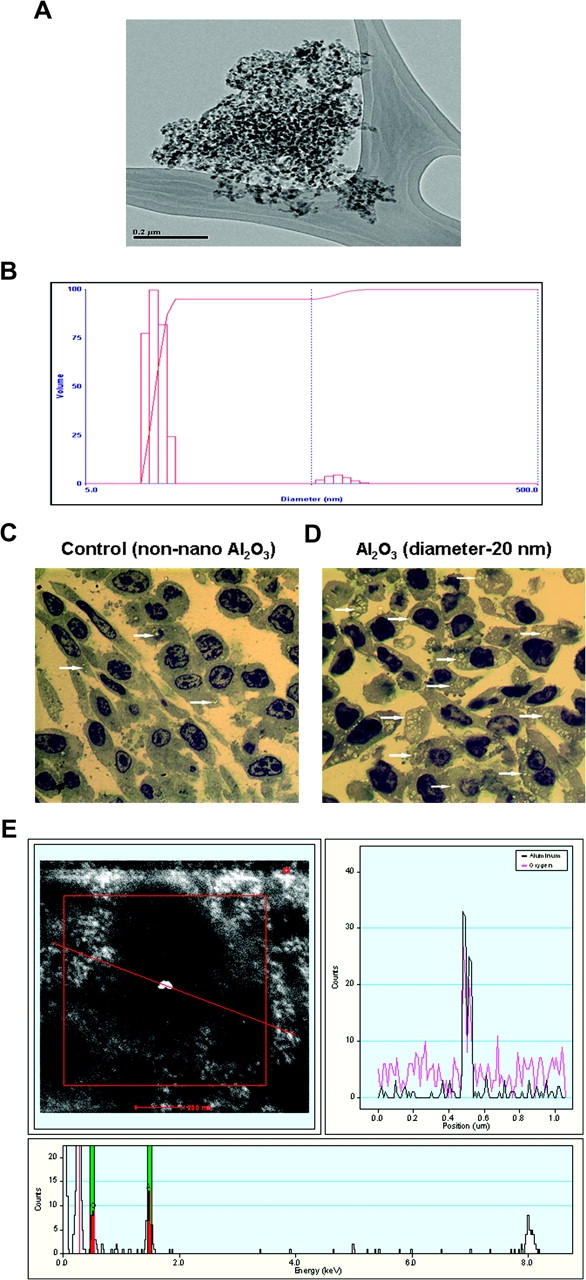
Characterization of alumina nanoparticles. (A and B) Transmission electron microscopy image of aggregated alumina nanoparticles. (A) Light scattering particle size distribution for supernatant of ultrasonicated, centrifuged material (B). (C and D) Detection of intracellular nanoparticles of alumina (Al2O3). JB6 cells treated with non-sonicated particles showing uptake of particles in some cells. Arrows point to the refractory inclusions in the affected cells (A). JB6 cells treated with sonicated/dispersed particles. Virtually, all cells contain refractory inclusions, and presence of a large number of mitotic cells is evident (B). Toluidine blue-stained plastic section, magnification ×1000. (E) Characterization of alumina nanoparticle (Al2O3) by HRSTEM and scanning transmission electron microscopy. The image with a red line passing through a bright spot (top/left) indicates the area of X-ray elemental analysis. The elemental profile shown on the top/right panel shows both aluminum and oxygen that are highlighted in the bottom frame.
Uptake of alumina nanoparticles in mouse skin epithelial cells
Cells were treated with non-sonicated (alumina aggregates ∼500 nm) and sonicated alumina nanoparticles (diameter < 20 nm). The amount of particle used was based on the surface area of 9.8 cm2 of the tissue culture dish and the mean particle diameter from each preparation to cover the entire surface area of the dish as monolayer. Alumina-treated cells were washed three times in phosphate-buffered saline (PBS) and scraped, and cell suspension was centrifuged at low speed. The resulting cell pellets were fixed in 4% formalin and examined using a combination of light and electron microscopy. At the light microscopy level, toluidine blue staining revealed that there were visibly fewer cells containing internalized alumina in cells subjected to non-sonicated (aggregated) alumina (Figure 1C) than in cells exposed to sonicated alumina (Figure 1D). In addition, a large number of mitotic cells was observed in the alumina-treated cells (Figure 1D). To validate the composition of alumina nanoparticles as Al2O3, high-resolution transmission electron microscopy (HRSTEM) and scanning transmission electron microscopy were performed on unstained samples. The elemental profile identified in each sample matches that of alumina (Figure 1E).
Characterization of cell growth
Cells were cultured at a density of 1 × 10⁴ in triplicate in a six-well plate. The cells were mixed with trypan blue stain to mark dead cells and counted daily for 5 days to determine the number of live cells per well. Growth rate was determined by calculating the doubling time from the initial slope of the growth curve before saturation occurred.
Cell viability assay
The effect of alumina on JB6 cell viability/metabolic activity was determined using the colorimetric 3-(4,5-dimethythiazol-2yl)-2,5 diphenyl tetrazolium bromide assay (Roche Applied Science, Indianapolis, IN). Cells were cultured at a density of 1 × 10⁵ in triplicate in a 48-well plate.
MnSOD activity assay
The MnSOD activity was measured using modified nitro blue tetrazolium (NBT) method as described previously (24). This assay is based on the competition between superoxide dismutase in the cell homogenate and NBT, an indicator molecule for the superoxide. The xanthine–xanthine oxidase system was used for the generation of constant flux of superoxide. The cells were cultured at a density of 1 × 10⁶ cells in triplicate in P-150 plates. The amount of alumina nanoparticles used to treat the cells was calculated based on the surface area of the P-150 plate and the mean diameter of the alumina nanoparticle. The cells were washed three times in PBS and stored at −80°C overnight. The cell were thawed, scraped and homogenized in 0.25 ml of 50 mM potassium phosphate buffer (pH 7.8, with diethylenetriaminepentaacetic acid) per plate. The homogenate was sonicated on ice with three 15 s bursts with 400 W microtip sonicator at 70% output. The reduction of NBT to blue formazan by superoxide with/without cell homogenate was measured spectrophotometrically at 560 nm at 25°C. The rate of NBT reduction in the absence of cell homogenate was used as the reference rate (0.02 ± 0.005 absorbance/min). The data were plotted as percent inhibition of NBT reduction versus protein concentration and fitted with a curve using GraphPad Prism 4 (enzyme kinetics) software program. One unit of activity was defined as the amount of protein necessary to reduce the rate of NBT reduction to 50% of maximum inhibition. All the data were expressed in units of superoxide dismutase activity per milligram of protein.
Detection of ROS
The intracellular ROS production was assayed using 2′,7′-dichlorofluorescein diacetate (DCFH) (Molecular Probes, Eugene, OR) as described previously (25). The cell permeant DCFH dye was cleaved of its acetate moiety by cellular esterase, producing 2′,7′-dichlorofluorescein that fluoresces upon ROS oxidation in the cells. The carboxy-DCFH (C-369) (Molecular Probes) dye is a non-oxidizable fluorescent dye that does not change its fluorescence in the presence of ROS in the cells. The cells were cultured at a density of 1 × 10⁴ cells in triplicate in 48-well plates. After 24 h, the cells were treated with alumina per the working surface area of the cell culture plate and the size of the alumina nanoparticle. The cells were incubated for 24 h after alumina nanoparticle treatment. After the 24 h incubation, the cells were washed with PBS (pH 7.4) and incubated for 45 min with 0.25 ml of PBS containing 10 μM of DCFH or with 1 μM of C-369, which served as a negative control. The cells were washed twice with PBS (pH 7.4) and 0.25 ml of fresh PBS was added. The fluorescence was read at excitation/emission of 488/525 nm with a SpectraMax Gemini plate reader from Molecular Devices (Sunnyvale, CA). The background fluorescence from wells with cells only (no DCFH/C-369 dye added) was subtracted from those with DCFH/C-369 dye added.
Anchorage-independent cell transformation assay in soft agar
Anchorage-independent cell transformation is one of the best in vitro indicators of neoplastic growth potential. The cells were treated with TPA as the positive control. Agar plates were prepared that contained a bottom layer of 0.5% agar, overlaid with a layer of 0.33% soft agar inclusive of cells and test compounds. Cultured untreated JB6 cells were trypsinized and diluted in culture media to obtain single-cell suspensions. Aliquots of cell suspensions (5000 cells) left untreated, or treated with alumina- or TPA-positive control, were mixed with the 0.5% agar media and layered gently over the solidified bottom agar. The top layer was allowed to set for 30 min at room temperature. Excess culture media was added over the set soft agar layer and incubated at 37°C in a 5% CO2 air-humidified incubator for 14 days. Colonies comprising >50 cells were counted under a dissecting microscope.
Transient transfection and luciferase assay for detecting AP-1 activity
JB6 cells (2 × 10⁵) were cultured at 70% confluency in culture plates in antibiotic-free culture media (minimum essential medium, Earle’s, Invitrogen, Carlsbad, CA), supplemented with 4% fetal bovine serum. A lipofectamine transfection protocol was used as described by the manufacturer (Invitrogen). Cells were transfected with 2 μg of empty vector alone (pGL3-Luc), or empty vector containing a tandem of four AP-1 consensus binding sites in the promoter (AP-1-pGL3-Luc), and cotransfected with pRL-TK (0.22 μM), which contains the Renilla complementary DNA, driven by the thymidine kinase promoter, as the internal control. The samples were analyzed for luciferase activity using the Dual-Luc Reporter Assay System (Promega, Madison, WI), according to the manufacturer’s instructions, in a TD-20/20 luminometer (Turner Designs, Sunnyvale, CA).
SIRT1 activity assay
The lysyl deacetylase activity of SIRT1 was measured using the fluor de Lys-SIRT1 substrate (a peptide comprising amino acids 379–382 of human p53 [Arg-His-Lys-Lys(Ac)], Biomol, Plymouth Meeting, PA). Briefly, JB6 (cl41-5a) cells were left untreated or treated with alumina for 72 h. Following treatment, cells were harvested in lysis buffer (described above; see western blot). Crude cell lysates were frozen/thawed three times and centrifuged at 12 000g for 10 min. The supernatants (cell lysates) were normalized for protein content and incubated in assay buffer supplemented with 50 μM of SIRT1 substrate at 37°C in 96-well plates for 1 h. The reaction was subsequently quenched with the quenching buffer containing the developer and SIRT1 inhibitor, nicotinamide adenine dinucleotide, for 45 min at room temperature (23°C). The enzyme-catalyzed release of the fluorophore triggered by the NAD+-dependent deacetylation of the substrate by SIRT1 was quantified by a SpectraMax Gemini Fluorimeter (Molecular Devices) using 360 nm excitation and 460 nm emission wavelengths. SIRT1 activity was expressed as units per microgram of total protein. Changes in alumina-induced SIRT1 activity were compared with the control cells (no treatment). Mean values were obtained from three replicates (n = 3). Protein concentrations were determined using the Bradford method (Bio-Rad, Hercules, CA).
Immunoprecipitation
Whole-cell lysates from JB6 cells left untreated or treated with alumina were used for the immunoprecipitation studies. Cell lysates (200 μg) were mixed with 2 μg of anti-c-Jun polyclonal antibody or anti-JunD polyclonal antibody or anti-c-Fos polyclonal antibody and incubated overnight at 4°C with continuous mixing. Subsequently, 20 μl of protein A/G agarose beads were added to the reaction mixture of lysate and antibody and incubated overnight at 4°C with continuous mixing. Immunoprecipitates were collected by centrifugation at 2500 r.p.m. for 5 min at 4°C, followed by washing four times with radioimmune precipitation assay buffer [9.1 mM Na2HPO4, 1.7 mM NaH2PO4, 150 mM NaCl, 0.5% sodium deoxycholate, 1% Nonidet P-40, 0.1% sodium dodecyl sulfate, 10 μg/ml phenylmethylsulphonyl fluoride and 1 μg/ml aprotinin (Sigma-Aldrich, St. Louis, MO)]. Subsequently, the supernatant was carefully removed and the pellets were resuspended in 1× electrophoresis sample buffer. The samples were boiled for 5 min and immunoprecipitated proteins were detected by western blot.
SIRT1 knockdown by siRNA approach
JB6 (cl41-5a) cells were transfected using small interfering RNA (siRNA) to SIRT1 (a cocktail of 5′-AUCUUGCCUGAUUUGUAAtt-3′, 5′- GUACCACCAAAUCGUUACAtt-3′ and 5′-GCAUAGAUCUUCACCACAAtt-3′; Santa Cruz Biotechnology, Santa Cruz, CA). Cells (2 × 10⁵) were grown in six-well culture plates in antibiotic-free culture media (minimum essential medium, Earle’s, Invitrogen), supplemented with 4% fetal bovine serum at 37°C in a 5% CO2 air-humidified incubator until the cells were 70–80% confluent. Cells were transfected using a lipofectamine transfection reagent as directed by the manufacturer (Santa Cruz Biotechnology). For each transfection, 0.8 μg of siRNA duplex for SIRT1 and control siRNA were mixed with transfection reagent and medium. The transfection media was removed after 7 h and replenished with fresh culture media. After 24 h, cells were left untreated or treated with alumina. Seventy-two hours after treatment, cells were washed with PBS and lysed in lysis buffer (described above; see western blot) and centrifuged for 10 min to pellet cellular debris. The samples were analyzed for SIRT1, JunD, c-Jun, c-Fos, BclxL and Bax protein expressions using western blot analysis. Mean values were obtained from three replicates (n = 3).
Detection of cell proliferation
Cell proliferation was determined by detecting the incorporation of bromodeoxyuridine (BrdU), a thymidine analog, using anti-BrdU-specific antibodies (BD Biosciences, San Jose, CA). To study the function of SIRT1 in proliferation, the cells were transfected with siRNA for SIRT1 and control siRNA (as described above). Twenty-four hours after transfection, the cells were labeled with BrdU solution followed by treatment with alumina or by no treatment. Seventy-two hours after treatment, cells were fixed with Zamboni’s fixative, washed with PBS, permeabilized and incubated with biotin anti-BrdU monoclonal antibody. The slides were visualized using the streptavidin–horseradish peroxidase enzyme complex and the signal was detected by diaminobenzidene substrate. The number of BrdU-positive cells was counted from 10 randomly selected fields and the percentage of proliferating cells was calculated as (number of BrdU cells/number of total cells × 100). Mean values were calculated from three replicates (n = 3).
Data analysis
Data are represented as mean ± SEM from replicate samples obtained from at least three separate experiments. Overall differences between experimental groups were analyzed using analysis of variance (JMP IN statistical software, release version 5.1, SAS Institute, Belmont, CA). When significant differences were found between experimental groups, paired group differences were analyzed post hoc using Dunnett’s (d) test. An α level of P < 0.05 was considered significant for all statistical tests employed.
Results
Aluminum nanoparticle-induced cell proliferation and transformation
As an initial step to determine the effects of alumina on cell proliferation, we determined the growth characteristics of cells over time. TPA, a well-established tumor promoter, was used as the positive control. Cells were left untreated, treated with alumina (diameter < 20 nm) or TPA (10 ng/ml). The amount of particles to be applied was calculated to provide uniform coverage of monolayer cells. Alumina- and TPA-treated cells showed a 53 and 124% increase in growth, respectively, compared with untreated controls (Figure 2A). Western blot analysis revealed increases in proliferating cell nuclear antigen (PCNA) levels in alumina- and TPA-treated cells, compared with controls, at 72 h (P < 0.001) and 120 h (P < 0.006), which further validates the increase in cell proliferation (Figure 2B and C). Consistent with these findings, a large number of mitotic cells were observed in the toluidine-stained, alumina-treated JB6 cells (Figure 1D). Changes in viability and metabolic activity of cells exposed to alumina were measured using the 3-(4,5-dimethythiazol-2yl)-2,5-diphenyl tetrazolium bromide assay. The results indicate a significant increase in cell viability after 72 h, compared with untreated controls (*P < 0.001) (Figure 2D). Alumina also induced anchorage-independent transformation of JB6 cells in soft agar. Single cells were seeded in 33% soft agar with, or without, alumina or TPA (positive control). Transformed colonies in alumina- and TPA-treated cells were significantly greater in number and larger in diameter compared with controls (alumina: P < 0.05; TPA: P < 0.001) (Figure 2E and F).
Fig. 2.

Alumina nanoparticle-induced cell proliferation and transformation. Cells were left untreated or treated with alumina nanoparticles (diameter < 20 nm; dose calculated for uniform application over cell surface) or TPA (10 ng/ml; positive control) and a growth curve was established by daily counting of cell numbers. Alumina- and TPA-treated JB6 cells demonstrated increase in growth rate, compared with controls *P < 0.006; **P < 0.001 (A). Western blot analysis indicated significantly increased PCNA levels in alumina- and TPA-treated cells, compared with controls, at 72 h (P < 0.001) and 120 h (P < 0.006) (B). Mouse anti-actin monoclonal antibody was used as an internal loading control (B). Quantitative analysis of PCNA expression was performed. Results were averaged from three sets of independent experiments (C). Cell viability of JB6 cells exposed to alumina in vitro was determined using the 3-(4,5-dimethythiazol-2yl)-2,5-diphenyl tetrazolium bromide assay, a colorimetric measure of metabolic activity, which serves as an indicator of cell viability. Cells treated with alumina demonstrated an increase in cell viability (*P < 0.001; n = 6), compared with controls (D). Phase contrast microscopy images of transformed colonies of JB6 cells seeded in soft agar, untreated or treated with nanoparticles of alumina or 10 ng/ml TPA (positive control) (E). The number of transformed colonies was counted after 14 days. The images shown were taken at ×10 magnification. All colonies found in alumina- or TPA-treated cells contain an average of >50 cells, as determined by dissociation of the smallest colony in the alumina-treated cells with trypsin and counting with a hemocytometer. Quantitative analysis showed that alumina-treated cells demonstrated a significant increase in transformed colonies compared with controls (alumina: P < 0.05; positive control TPA: P < 0.001) (F).
Alumina exposure enhances MnSOD expression and activity in mouse epithelial cells
Given that MnSOD is a well-documented indicator for oxidative stress and a TPA-inducible gene, and that alumina nanoparticles have similar effects as TPA in JB6 cells, we probed the effect of alumina on cellular redox status by studying the changes in protein levels of MnSOD. Results indicate a significant increase of MnSOD at 72 and 120 h (72 h: P < 0.04; 120 h: P = < 0.03), compared with controls (Figure 3A and B).
Fig. 3.

Alumina exposure enhances MnSOD and ROS levels in mouse epithelial cells. Cells were left untreated or treated with alumina (diameter < 20 nm). Cell lysates were extracted for western blot analysis to detect MnSOD expression. JB6 cells exposed to alumina showed a significant increase in MnSOD levels after 72 h (P < 0.04) and 120 h (P < 0.038) of treatment, compared with controls (A and B). Mouse anti-actin monoclonal antibody was used as an internal loading control (A). Results were averaged from three sets of independent experiments. The MnSOD activity was measured 72 h after treatment (C). Significant increase in MnSOD activity was found in alumina-treated cells (P < 0.05). The levels of total cellular ROS represented by DCF fluorescence was significantly increased (P < 0.05) at 72 h (D), whereas the fluorescence level of the C-369 was not changed in alumina-treated cells (E).
To verify that changes in MnSOD protein result in corresponding changes in MnSOD activity, we measured MnSOD activity using the NBT reduction assay. The results indicate corresponding increases in MnSOD activity in alumina-treated cells at 72 h (P < 0.05) (Figure 3C).
To further probe whether the increase in MnSOD activity is likely to reduce total cellular ROS levels, we measured intracellular ROS levels using the oxidizable probe 2′,7′-dichlorofluorescein diacetate. Alumina-treated cells show significantly increased ROS levels (P < 0.05) (Figure 3D). The non-oxidizable probe (C-369) did not manifest any differences in fluorescence (Figure 3E).
Alumina exposure enhances AP-1 transcription activity as well as SIRT1 deacetylation activity
It has been demonstrated that AP-1 and its downstream genes induce cell proliferation in skin exposed to tumor promoter TPA (26). To determine whether increases in proliferation and transformation of JB6 cells exposed to alumina are associated with activation of AP-1, cells were transfected with the AP-1 promoter construct (API-1pGL3-Luc) or (pGL3-Luc), and transcriptional activity of AP-1 was measured using the luciferase reporter assay. A significant increase in AP-1 transcriptional activity was observed in alumina-treated cells after 24 h, compared with the corresponding empty vector-transfected cells and untreated controls (P < 0.001) (Figure 4A).
Fig. 4.

Alumina exposure enhances AP-1 transcription activity and SIRT1 deacetylation activity. JB6 (cl41-5a) cells were transfected with the empty vector alone (pGL3-Luc) or empty vector containing the AP-1 promoter-driven luciferase reporter vector. Thirty-six hours after transfection, cells were divided into sets, three dishes per group, for treatment with or without alumina nanoparticles. Twenty-four hours after treatment, cells were collected for luciferase activity as a measure of AP-1 transcription activity. A significant increase in AP-1 transcriptional activity was observed in alumina-treated JB6 cells, compared with the corresponding empty vector-transfected cells and controls [pAP1/dimethyl sulfoxide (DMSO)] (P < 0.001) (A). Western blot analysis revealed an increase in the SIRT1 protein level in alumina- and TPA-treated cells (P < 0.006) (B and C). Increase in protein levels in alumina-exposed JB6 cells was confirmed by SIRT1 enzyme activity assay (P < 0.002) (D). Interaction of SIRT1 and AP1 components: immunoprecipitation studies revealed physical interaction of SIRT1 with the AP-1 components, c-Jun and JunD, but not with c-Fos, in alumina-treated cells (E and F). Immunoprecipitation with IgG was used as controls (G).
Mammalian silent information regulator 2 homolog, sirtuin (SIRT1), has been identified as a longevity gene and an important regulator of cell survival in the presence of stress, such as oxidative stress (18,19,27). Analysis of SIRT1 protein levels using western blot showed a significant induction at 72 h in both TPA- and alumina-exposed cells (P < 0.006) (Figure 4B and C). This finding was confirmed by an increase in SIRT1 activity in alumina-treated cells (P < 0.002) (Figure 4D).
SIRT1 interacts with Jun members of AP-1
The AP-1 complex consists of a variety of dimers of the members of the Jun and Fos family of proteins (28). Previous studies have shown that the Jun family of proteins may play a key role in TPA-induced AP-1 activity in skin (29). To explore the possibility that SRIT1 may participate in the transcription of AP-1 target genes by interacting with AP-1, we performed immunoprecipitation coupled to western blot analysis of SIRT1 and AP-1 components. Immunoprecipitation studies revealed a physical interaction of SIRT1 with the AP-1 components, c-Jun and JunD, but not c-Fos, in alumina-exposed cells (Figure 4E–G).
SIRT1 is essential for cell proliferation in alumina-exposed mouse epithelial cells
We used the siRNA approach to verify the role of SIRT1 in alumina-induced cell proliferation. Cells were transfected with control siRNA and SIRT1 siRNA and 24 h later were exposed to alumina for 72 h. Suppression of SIRT1 reduced alumina-induced SIRT1 expression in treated cells (∧P < 0.0001), as well as in controls (∧P < 0.007) (Figure 5A and B). The role of SIRT1 in cell proliferation was determined by detecting cells in S phase using BrdU staining. Alumina exposure showed an increase in the S-phase population of cells (*P < 0.0002), which was attenuated in cells transfected with SIRT1 siRNA (∧P < 0.0004; controls: ∧P < 0.0004) (Figure 5C and D). The role of SIRT1 in cell proliferation was further confirmed by the increase in alumina-induced PCNA levels (*P < 0.003; #P < 0.02), which was reduced in the alumina-exposed SIRT1 siRNA-transfected cells (∧P < 0.001) (Figure 5E and F). Suppression of SIRT1 also reduced cell viability measured by 3-(4,5-dimethythiazol-2yl)-2,5-diphenyl tetrazolium bromide assay (*P < 0.005, #P < 0.02, alumina: ∧P < 0.0001; controls: ∧P < 0.0006) (Figure 5G).
Fig. 5.

SIRT1 is essential for increased cell proliferation in alumina-exposed mouse epithelial cells. JB6 (cl41-5a) cells were transfected with siRNA for SIRT1 and control siRNA. SIRT1 siRNA significantly suppressed basal levels and alumina-induced SIRT1 expression (*P < 0.02; alumina: ∧P < 0.0001; controls: ∧P < 0.007) (A and B). S-phase population of cells was detected by the incorporation of BrdU, which was recognized by anti-BrdU-specific antibodies. Increase in S-phase population in alumina-treated cells (*P < 0.0002) was attenuated by SIRT1 siRNA transfection (∧P < 0.0004; controls: ∧P < 0.0004) (C and D). Western blot analysis revealed increase in alumina-induced PCNA levels (*P < 0.003; #P < 0.02), which was attenuated in alumina-exposed SIRT1 knockdown cells (∧P < 0.001) (E and F). Cell viability was assessed using 3-(4,5-dimethythiazol-2yl)-2,5-diphenyl tetrazolium bromide assay. Suppression of SIRT1 reduced cell viability in controls and alumina-treated cells (*P < 0.005, #P < 0.02, alumina: ∧P < 0.0001; controls: ∧P < 0.0006) (G). *Increase in protein levels, S-phase cells and viability in cells treated with alumina and transfected with control siRNA in comparison with untreated cells. Reduction in protein levels, S-phase cells and viability in SIRT1 knockdown untreated and treated JB6 cells, compared with respective control siRNA transfected cells. #Increase in PCNA levels in alumina-exposed JB6 cells transfected with siRNA for SIRT1.
SIRT1 is essential for the activation of AP-1 and its target gene, BclxL, in alumina-exposed mouse epithelial cells
To verify the role of SIRT1 in the activation of AP-1 and its components, JB6 cells were cotransfected with the AP-1 promoter construct (API-1pGL3-Luc) or (pGL3-Luc) and siRNA for SIRT1, or control siRNA. Transcriptional activity of AP-1 was measured using the luciferase reporter assay 72 h after transfection. Suppression of SIRT1 reduced alumina-induced and basal levels of AP-1 transcriptional activity (alumina: *P < 0.02; ∧P < 0.001, controls: ∧P < 0.001) (Figure 6A). SIRT1 knockdown also reduced alumina-induced protein expression of AP-1 component, JunD (*P < 0.002; ∧P < 0.0001) (Figure 6B and C) and c-Jun (*P < 0.0002; ∧P < 0.001) (Figure 6B and D) but not the level of the non-AP-1 target gene, c-Fos (Figure 6B and E). Further, alumina increased prosurvival AP-1 target gene BclxL, but the reverse occurred in SIRT1 knockdown cells (Figure 6F and G).
Fig. 6.

SIRT1 is essential for the activity of AP-1 and the expression of AP-1 target genes in alumina-exposed mouse epithelial cells. JB6 (cl41-5a) cells were cotransfected with either the AP-1-driven luciferase reporter construct (AP-1pGL3-Luc) or empty vector (pGL3-Luc), along with siRNA for SIRT1 or control siRNA. After 24 h of cotransfection, cells were left untreated or treated with alumina for 72 h. Cells were collected for luciferase activity as a measure of AP-1 transcriptional activity. AP-1 transcriptional activity was reduced in controls and alumina-exposed SIRT1 knockdown cells (alumina: *P < 0.02; ∧P < 0.001, controls: ∧P < 0.001) (A). Protein levels of AP-1 components JunD and c-Jun were attenuated in SIRT1 knockdown cells (JunD-alumina: *P < 0.002; ∧P < 0.0001) (B and C), (c-Jun-alumina: *P < 0.0002; ∧P < 0.001) (B and D). SIRT1 suppression did not alter the alumina-induced expression levels of c-Fos (*P < 0.05) (B and E). Prosurvival AP-1 target gene BclxL increased and proapoptotic Bax expression decreased in alumina-exposed JB6 cells, which was reversed in SIRT1 knockdown cells (BclxL: *P < 0.03; alumina: ∧P < 0.001, control: ∧P < 0.02; Bax: #P < 0.05; alumina: ∧P < 0.002, control: ∧P < 0.025) (F and G). *Increase in AP-1 activity and other protein levels in cells treated with alumina and transfected with control siRNA, compared with untreated controls. ∧Reduction in AP-1 transcriptional activity and protein expression in SIRT1 knockdown untreated and treated JB6 cells, compared with respective control siRNA-treated cells.
Discussion
Ultramicroscopic nanoparticles are used to facilitate novel state-of-the-art therapeutic regimens and targeted drug delivery systems in an attempt to improve treatment efficacy (30). They are also used in cosmetics and other consumer products (13,31). However, the increased surface to volume ratio of the miniscule nanoparticles increases reactivity and may result in intrinsic toxicity. Despite the wide application of nanoparticles, knowledge of their adverse effects, especially on carcinogenesis, is lacking. One of the most common entry routes for nanoparticles is inhalation, and early reports indicate that workers involved in aluminum production may be at increased risk of developing lung cancer (32). In vivo studies have demonstrated lung inflammation due to exposure to nanoparticles (33). Systemic distribution of nanoparticles has been reported into the blood stream and lymphatic pathways (34). Because aluminum distributes evenly in plasma and blood cells, aluminum concentrations in plasma and whole blood have similar value in assessing toxicity (35). Aluminum is excreted predominantly via the kidneys and therefore accumulates in patients with renal failure (36). Long-term exposure could lead to accumulation of aluminum, even in workers having normal renal function.
Another important route for nanoparticle entry is the skin, from accidental exposure and use of cosmetics and other topical applications. Although the outer layer of the epidermis, the stratum corneum, protects against environmental insults, TiO2 has been shown to penetrate the stratum corneum and even hair follicles (37). Penetration of nanosized titanium dioxide (5–20 nm) into the skin and interaction with the immune system has been demonstrated (38). Studies have also demonstrated that, in conjunction with motion, nanoparticles penetrate into the stratum corneum of human skin reaching to the epidermis and dermis (39).
Recently, aluminum has been found to be a potential pro-oxidant in sunscreens and sunblocks (40). Several studies report permeability and accumulation of aluminum salts in antiperspirants with dispersion to systemic sites (41). In addition, aluminum has been categorized as a metalloestrogen that can interfere with estrogen receptors and that has a potential role in breast cancer (31). Further, aluminum could function as a pro-oxidant increasing oxidative damage to the skin (42). However, whether and how nanoparticles of alumina exert a carcinogenic effect on skin epithelial cells are unknown.
Our results show that alumina is internalized and significantly increases MnSOD protein levels, indicating that the effect of alumina may occur, in part, via alteration of cellular redox status. Our results also indicate that nanoparticle exposure can cause increased proliferation and anchorage-independent transformation in JB6 cells. PCNA is a well-established indicator of cell proliferation, actively involved in DNA replication and repair (43). The increase in PCNA levels further validates the role of alumina in cell proliferation. Our results also demonstrate that treatment with alumina enhances MnSOD protein and activity as well as the levels of total cellular ROS. These results suggest that the observed increase in MnSOD levels is an adaptive response to alumina-induced oxidative stress. The finding that the total cellular ROS is also increased in the presence of higher MnSOD activity is consistent with this possibility. Further support for this possibility includes the finding that alumina activates AP-1, a redox-sensitive transcription factor. The major components of AP-1 are the ‘Jun’ (c-Jun, JunB and JunD) and ‘Fos’ (c-Fos, FosB, Fos-related antigen-1 and Fos-related antigen-2) family of proteins (44). They are characterized by the leucine zipper regions that allow the different components to form homodimers or heterodimers and bind to specific DNA-binding elements called TPA response elements (45). Unlike the Jun family of proteins, Fos proteins cannot form homodimers. They form heterodimers with the Jun family of proteins (46). Activation of AP-1 is essential for the neoplastic transformation of mouse epithelial JB6 cells (47). Inhibition of c-Jun or AP-1 represses transactivation of AP-1 and transformation of JB6 cells (48). Thus, AP-1 transcriptional activity instigated by alumina may result from redox-mediated events that lead to cell proliferation and neoplastic transformation.
Mammalian silent information regulator 2 homolog (SIRT1) has been recently identified as a prosurvival factor against stress-induced DNA damage (18,49). SIRT1 promotes cell survival by negatively regulating the tumor suppressor protein p53 (18,20,50,51). Previous studies have shown that the deacetylase activity of SIRT1 is responsible for gene silencing, DNA recombination, increase in survival and longevity in response to oxidative stress and other stress factors (18,19,50–54). Our studies indicate that alumina exposure to mouse epithelial cells increases SIRT1 protein and activity levels. Interestingly, we also observed interaction of SIRT1 with the AP-1 components c-Jun and JunD in alumina-exposed cells. This is the first study to demonstrate SIRT1 as a component of AP1-mediated transcription. Our results also show that SIRT1 is an essential modulator of AP-1 mediating cell proliferation and neoplastic transformation as the use of siRNA to block SIRT1 attenuates AP-1 transcriptional activity, protein levels of c-Jun, JunD and Bclxl, as well as PCNA levels, cells in S phase and cell viability.
The Bcl-2 family of proteins consists of both antiapoptotic and proapoptotic members and the ratio of these proteins often determines the life/death fate of cells (55,56). The Bcl-2 gene was originally identified as an oncogene involved in human follicular B cell lymphoma (57). Bcl-2 and BclxL prevent apoptosis by sequestering to death-inducing procaspases and/or preventing release of cytochrome c and apoptosis-inducing factor into the cytoplasm (55). In contrast, proapoptotic Bax and Bak trigger the release of cytochrome c that initiates the caspase signaling cascade (55,58,59). The BclxL protein is localized within the mitochondrial membrane (60) and inhibits apoptosis (61). An AP-1 consensus sequence was found at −267 of the promoter region of the mouse bcl-xL gene (62). Our findings that alumina increases the prosurvival AP-1 target gene BclxL and that suppression of SIRT1 reverses BclxL levels further support the possibilities that AP-1 activation is a mechanism by which nanoparticles of alumina can cause transformation.
The mechanisms by which SIRT1 participates in the carcinogenesis process are unknown. Although the precise mechanism by which SIRT1 modulates AP1 activity is unclear, our study indicates that SIRT1 may contribute to the carcinogenesis potential of alumina, at least in part, by interacting with AP-1 and modulating the expression of AP-1 target genes. These results reveal a novel mechanism involving the positive role of SIRT1 on transcription, leading to enhanced proliferation in alumina-treated cells. Further study in an animal model will be needed to establish this novel observation. Our initial observations in a cellular model suggest that alteration of cellular longevity and metabolic regulator should be considered in tandem with the evolving new opportunities using engineered nanoparticles to ensure the safety of nanomaterials.
Funding
National Cancer Institute (CA 49797 and 73599); University of Kentucky Nanoparticles Pilot Project funds.
Acknowledgments
Conflict of Interest Statement: None declared.
Glossary
Abbreviations
- AP-1
activator protein-1
- BrdU
bromodeoxyuridine
- DCFH
2′,7′-dichlorofluorescein diacetate
- MnSOD
manganese superoxide dismutase
- NBT
nitro blue tetrazolium
- PBS
phosphate-buffered saline
- PCNA
proliferating cell nuclear antigen
- ROS
reactive oxygen species
- SiRNA
small interfering RNA
- SIRT1
sirtuin 1
- TPA
12-O-tetradecanoylphorbol-13-acetate
References
- 1.Oberdorster G, et al. Principles for characterizing the potential human health effects from exposure to nanomaterials: elements of a screening strategy. Part. Fibre Toxicol. 2005;2:8. doi: 10.1186/1743-8977-2-8. [DOI] [PMC free article] [PubMed] [Google Scholar]
- 2.Xia T, et al. Comparison of the abilities of ambient and manufactured nanoparticles to induce cellular toxicity according to an oxidative stress paradigm. Nano Lett. 2006;6:1794–1807. doi: 10.1021/nl061025k. [DOI] [PubMed] [Google Scholar]
- 3.Elder A, et al. Translocation of inhaled ultrafine manganese oxide particles to the central nervous system. Environ. Health Perspect. 2006;114:1172–1178. doi: 10.1289/ehp.9030. [DOI] [PMC free article] [PubMed] [Google Scholar]
- 4.Borm PJ, et al. The potential risks of nanomaterials: a review carried out for ECETOC. Part. Fibre Toxicol. 2006;3:11. doi: 10.1186/1743-8977-3-11. [DOI] [PMC free article] [PubMed] [Google Scholar]
- 5.Oberdorster G, et al. Nanotoxicology: an emerging discipline evolving from studies of ultrafine particles. Environ. Health Perspect. 2005;113:823–839. doi: 10.1289/ehp.7339. [DOI] [PMC free article] [PubMed] [Google Scholar]
- 6.Donaldson K, et al. Inflammation caused by particles and fibers. Inhal. Toxicol. 2002;14:5–27. doi: 10.1080/089583701753338613. [DOI] [PubMed] [Google Scholar]
- 7.Donaldson K, et al. Nanotoxicology. Occup. Environ. Med. 2004;61:727–728. doi: 10.1136/oem.2004.013243. [DOI] [PMC free article] [PubMed] [Google Scholar]
- 8.Warheit DB, et al. Comparative pulmonary toxicity inhalation and instillation studies with different TiO2 particle formulations: impact of surface treatments on particle toxicity. Toxicol. Sci. 2005;88:514–524. doi: 10.1093/toxsci/kfi331. [DOI] [PubMed] [Google Scholar]
- 9.Yokel RA, et al. Aluminium toxicokinetics: an updated minireview. Pharmacol. Toxicol. 2001;88:159–167. doi: 10.1034/j.1600-0773.2001.d01-98.x. [DOI] [PubMed] [Google Scholar]
- 10.Exley C. Does antiperspirant use increase the risk of aluminium-related disease, including Alzheimer’s disease? Mol. Med. Today. 1998;4:107–109. doi: 10.1016/s1357-4310(98)01209-x. [DOI] [PubMed] [Google Scholar]
- 11.Siemiatycki J, et al. Listing occupational carcinogens. Environ. Health Perspect. 2004;112:1447–1459. doi: 10.1289/ehp.7047. [DOI] [PMC free article] [PubMed] [Google Scholar]
- 12.Exley C, et al. Aluminium in human breast tissue. J. Inorg. Biochem. 2007;101:1344–1346. doi: 10.1016/j.jinorgbio.2007.06.005. [DOI] [PubMed] [Google Scholar]
- 13.Darbre PD. Environmental oestrogens, cosmetics and breast cancer. Best Pract. Res. Clin. Endocrinol. Metab. 2006;20:121–143. doi: 10.1016/j.beem.2005.09.007. [DOI] [PubMed] [Google Scholar]
- 14.Flaten TP. Aluminium as a risk factor in Alzheimer’s disease, with emphasis on drinking water. Brain Res. Bull. 2001;55:187–196. doi: 10.1016/s0361-9230(01)00459-2. [DOI] [PubMed] [Google Scholar]
- 15.Colburn NH, et al. Correlation of anchorage-independent growth with tumorigenicity of chemically transformed mouse epidermal cells. Cancer Res. 1978;38:624–634. [PubMed] [Google Scholar]
- 16.Zhao Y, et al. Manganese superoxide dismutase deficiency enhances cell turnover via tumor promoter-induced alterations in AP-1 and p53-mediated pathways in a skin cancer model. Oncogene. 2002;21:3836–3846. doi: 10.1038/sj.onc.1205477. [DOI] [PubMed] [Google Scholar]
- 17.Blander G, et al. The Sir2 family of protein deacetylases. Annu. Rev. Biochem. 2004;73:417–435. doi: 10.1146/annurev.biochem.73.011303.073651. [DOI] [PubMed] [Google Scholar]
- 18.Luo J, et al. Negative control of p53 by Sir2alpha promotes cell survival under stress. Cell. 2001;107:137–148. doi: 10.1016/s0092-8674(01)00524-4. [DOI] [PubMed] [Google Scholar]
- 19.Brunet A, et al. Stress-dependent regulation of FOXO transcription factors by the SIRT1 deacetylase. Science. 2004;303:2011–2015. doi: 10.1126/science.1094637. [DOI] [PubMed] [Google Scholar]
- 20.Lim CS. SIRT1: tumor promoter or tumor suppressor? Med. Hypotheses. 2006;67:341–344. doi: 10.1016/j.mehy.2006.01.050. [DOI] [PubMed] [Google Scholar]
- 21.Nemoto S, et al. SIRT1 functionally interacts with the metabolic regulator and transcriptional coactivator PGC-1{alpha} J. Biol. Chem. 2005;280:16456–16460. doi: 10.1074/jbc.M501485200. [DOI] [PubMed] [Google Scholar]
- 22.Kops GJ, et al. Forkhead transcription factor FOXO3a protects quiescent cells from oxidative stress. Nature. 2002;419:316–321. doi: 10.1038/nature01036. [DOI] [PubMed] [Google Scholar]
- 23.Zhao Y, et al. p53 translocation to mitochondria precedes its nuclear translocation and targets mitochondrial oxidative defense protein-manganese superoxide dismutase. Cancer Res. 2005;65:3745–3750. doi: 10.1158/0008-5472.CAN-04-3835. [DOI] [PubMed] [Google Scholar]
- 24.Spitz DR, et al. An assay for superoxide dismutase activity in mammalian tissue homogenates. Anal. Biochem. 1989;179:8–18. doi: 10.1016/0003-2697(89)90192-9. [DOI] [PubMed] [Google Scholar]
- 25.Smith PS, et al. Inhibiting catalase activity sensitizes 36B10 rat glioma cells to oxidative stress. Free Radic. Biol. Med. 2007;42:787–797. doi: 10.1016/j.freeradbiomed.2006.11.032. [DOI] [PubMed] [Google Scholar]
- 26.Bowden G, et al. Molecular mechanisms involved in skin tumor initiation, promotion and progression. In: Mukhtar H, editor. Skin Cancer: Mechanisms and Human Relevance. Boca Raton, FL: CRC Press; 1995. pp. 99–111. [Google Scholar]
- 27.Luo J, et al. Deacetylation of p53 modulates its effect on cell growth and apoptosis. Nature. 2000;408:377–381. doi: 10.1038/35042612. [DOI] [PubMed] [Google Scholar]
- 28.Raivich G, et al. Role of the AP-1 transcription factor c-Jun in developing, adult and injured brain. Prog. Neurobiol. 2006;78:347–363. doi: 10.1016/j.pneurobio.2006.03.006. [DOI] [PubMed] [Google Scholar]
- 29.Zhao Y, et al. Overexpression of manganese superoxide dismutase suppresses tumor formation by modulation of activator protein-1 signaling in a multistage skin carcinogenesis model. Cancer Res. 2001;61:6082–6088. [PubMed] [Google Scholar]
- 30.McNeil SE. Nanotechnology for the biologist. J. Leukoc. Biol. 2005;78:585–594. doi: 10.1189/jlb.0205074. [DOI] [PubMed] [Google Scholar]
- 31.Darbre PD. Aluminium, antiperspirants and breast cancer. J. Inorg. Biochem. 2005;99:1912–1919. doi: 10.1016/j.jinorgbio.2005.06.001. [DOI] [PubMed] [Google Scholar]
- 32.Andersen A, et al. Risk of cancer in the Norwegian aluminium industry. Int. J. Cancer. 1982;29:295–298. doi: 10.1002/ijc.2910290312. [DOI] [PubMed] [Google Scholar]
- 33.Dailey LA, et al. Investigation of the proinflammatory potential of biodegradable nanoparticle drug delivery systems in the lung. Toxicol. Appl. Pharmacol. 2006;215:100–108. doi: 10.1016/j.taap.2006.01.016. [DOI] [PubMed] [Google Scholar]
- 34.Medina C, et al. Nanoparticles: pharmacological and toxicological significance. Br. J. Pharmacol. 2007;150:552–558. doi: 10.1038/sj.bjp.0707130. [DOI] [PMC free article] [PubMed] [Google Scholar]
- 35.van der Voet GB, et al. Distribution of aluminium between plasma and erythrocytes. Hum. Toxicol. 1985;4:643–648. doi: 10.1177/096032718500400613. [DOI] [PubMed] [Google Scholar]
- 36.Alfrey AC, et al. Metabolism and toxicity of aluminum in renal failure. Am. J. Clin. Nutr. 1980;33:1509–1516. doi: 10.1093/ajcn/33.7.1509. [DOI] [PubMed] [Google Scholar]
- 37.Lademann J, et al. Penetration of titanium dioxide microparticles in a sunscreen formulation into the horny layer and the follicular orifice. Skin Pharmacol. Appl. Skin Physiol. 1999;12:247–256. doi: 10.1159/000066249. [DOI] [PubMed] [Google Scholar]
- 38.Kreilgaard M. Influence of microemulsions on cutaneous drug delivery. Adv. Drug Deliv. Rev. 2002;54(suppl. 1):S77–S98. doi: 10.1016/s0169-409x(02)00116-3. [DOI] [PubMed] [Google Scholar]
- 39.Tinkle SS, et al. Skin as a route of exposure and sensitization in chronic beryllium disease. Environ. Health Perspect. 2003;111:1202–1208. doi: 10.1289/ehp.5999. [DOI] [PMC free article] [PubMed] [Google Scholar]
- 40.Nicholson S, et al. Aluminum: a potential pro-oxidant in sunscreens/sunblocks? Free Radic. Biol. Med. 2007;43:1216–1217. doi: 10.1016/j.freeradbiomed.2007.07.010. [DOI] [PubMed] [Google Scholar]
- 41.Flarend R, et al. A preliminary study of the dermal absorption of aluminium from antiperspirants using aluminium-26. Food Chem. Toxicol. 2001;39:163–168. doi: 10.1016/s0278-6915(00)00118-6. [DOI] [PubMed] [Google Scholar]
- 42.Exley C. The pro-oxidant activity of aluminum. Free Radic. Biol. Med. 2004;36:380–387. doi: 10.1016/j.freeradbiomed.2003.11.017. [DOI] [PubMed] [Google Scholar]
- 43.Paunesku T, et al. Proliferating cell nuclear antigen (PCNA): ringmaster of the genome. Int. J. Radiat. Biol. 2001;77:1007–1021. doi: 10.1080/09553000110069335. [DOI] [PubMed] [Google Scholar]
- 44.Wisdom R. AP-1: one switch for many signals. Exp. Cell Res. 1999;253:180–185. doi: 10.1006/excr.1999.4685. [DOI] [PubMed] [Google Scholar]
- 45.Angel P, et al. Phorbol ester-inducible genes contain a common cis element recognized by a TPA-modulated trans-acting factor. Cell. 1987;49:729–739. doi: 10.1016/0092-8674(87)90611-8. [DOI] [PubMed] [Google Scholar]
- 46.Mason JM, et al. Semirational design of Jun-Fos coiled coils with increased affinity: universal implications for leucine zipper prediction and design. Proc. Natl Acad. Sci USA. 2006;103:8989–8994. doi: 10.1073/pnas.0509880103. [DOI] [PMC free article] [PubMed] [Google Scholar]
- 47.Bernstein LR, et al. AP1/jun function is differentially induced in promotion-sensitive and resistant JB6 cells. Science. 1989;244:566–569. doi: 10.1126/science.2541502. [DOI] [PubMed] [Google Scholar]
- 48.Dong Z, et al. Blocking of tumor promoter-induced AP-1 activity inhibits induced transformation in JB6 mouse epidermal cells. Proc. Natl Acad. Sci. USA. 1994;91:609–613. doi: 10.1073/pnas.91.2.609. [DOI] [PMC free article] [PubMed] [Google Scholar]
- 49.Imai S, et al. Transcriptional silencing and longevity protein Sir2 is an NAD-dependent histone deacetylase. Nature. 2000;403:795–800. doi: 10.1038/35001622. [DOI] [PubMed] [Google Scholar]
- 50.Vaziri H, et al. hSIR2(SIRT1) functions as an NAD-dependent p53 deacetylase. Cell. 2001;107:149–159. doi: 10.1016/s0092-8674(01)00527-x. [DOI] [PubMed] [Google Scholar]
- 51.Langley E, et al. Human SIR2 deacetylates p53 and antagonizes PML/p53-induced cellular senescence. EMBO J. 2002;21:2383–2396. doi: 10.1093/emboj/21.10.2383. [DOI] [PMC free article] [PubMed] [Google Scholar]
- 52.Smith J. Human Sir2 and the ‘silencing’ of p53 activity. Trends Cell Biol. 2002;12:404–406. doi: 10.1016/s0962-8924(02)02342-5. [DOI] [PubMed] [Google Scholar]
- 53.Cohen HY, et al. Calorie restriction promotes mammalian cell survival by inducing the SIRT1 deacetylase. Science. 2004;305:390–392. doi: 10.1126/science.1099196. [DOI] [PubMed] [Google Scholar]
- 54.Bordone L, et al. Calorie restriction, SIRT1 and metabolism: understanding longevity. Nat. Rev. Mol. Cell Biol. 2005;6:298–305. doi: 10.1038/nrm1616. [DOI] [PubMed] [Google Scholar]
- 55.Tsujimoto Y. Role of Bcl-2 family proteins in apoptosis: apoptosomes or mitochondria? Genes Cells. 1998;3:697–707. doi: 10.1046/j.1365-2443.1998.00223.x. [DOI] [PubMed] [Google Scholar]
- 56.Tsujimoto Y, et al. Bcl-2 family: life-or-death switch. FEBS Lett. 2000;466:6–10. doi: 10.1016/s0014-5793(99)01761-5. [DOI] [PubMed] [Google Scholar]
- 57.Tsujimoto Y, et al. Involvement of the bcl-2 gene in human follicular lymphoma. Science. 1985;228:1440–1443. doi: 10.1126/science.3874430. [DOI] [PubMed] [Google Scholar]
- 58.Grutter MG. Caspases: key players in programmed cell death. Curr. Opin. Struct. Biol. 2000;10:649–655. doi: 10.1016/s0959-440x(00)00146-9. [DOI] [PubMed] [Google Scholar]
- 59.Jiang X, et al. Cytochrome C-mediated apoptosis. Annu. Rev. Biochem. 2004;73:87–106. doi: 10.1146/annurev.biochem.73.011303.073706. [DOI] [PubMed] [Google Scholar]
- 60.Gonzalez-Garcia M, et al. bcl-XL is the major bcl-x mRNA form expressed during murine development and its product localizes to mitochondria. Development. 1994;120:3033–3042. doi: 10.1242/dev.120.10.3033. [DOI] [PubMed] [Google Scholar]
- 61.Boise LH, et al. bcl-x, a bcl-2-related gene that functions as a dominant regulator of apoptotic cell death. Cell. 1993;74:597–608. doi: 10.1016/0092-8674(93)90508-n. [DOI] [PubMed] [Google Scholar]
- 62.Grillot DA, et al. Genomic organization, promoter region analysis, and chromosome localization of the mouse bcl-x gene. J. Immunol. 1997;158:4750–4757. [PubMed] [Google Scholar]