

Abstract
Autosomal dominant polycystic kidney disease (ADPKD) is the most common monogenetic disease predominantly caused by alteration or dysregulation of the PKD1 gene, which encodes polycystin-1 (PC1). The disease is characterized by the progressive expansion of bilateral fluid-filled renal cysts that ultimately lead to renal failure. Individual cysts, even within patients with germline mutations, are genetically heterogeneous, displaying diverse chromosomal abnormalities. To date, the molecular mechanisms responsible for this genetic heterogeneity remain unknown. Using a lentiviral-mediated siRNA expression model of Pkd1 hypomorphism, we show that loss of PC1 function is sufficient to produce centrosome amplification and multipolar spindle formation. These events lead to genomic instability characterized by gross polyploidism and mitotic catastrophe. Following these dramatic early changes, the cell population rapidly converges toward a stable ploidy in which centrosome amplification is significantly decreased, though cytological abnormalities such as micronucleation, chromatin bridges and aneuploidy remain common. In agreement with our in vitro findings, we provide the first in vivo evidence that significant centrosome amplification occurs in kidneys from conditional Pkd1 knockout mice at early and late time during the disease progression as well as in human ADPKD patients. These findings establish a novel function of PC1 in ADPKD pathogenesis and a genetic mechanism that may underlie the intrafamilial variability of ADPKD progression.
INTRODUCTION
ADPKD (autosomal dominant polycystic kidney disease) is characterized by progressive tubule dilatation and renal cystic enlargement that eventually destroy the kidney architecture and lead to end-stage renal disease (1–5). Mutations in the PKD1 gene, which encodes the polycystin-1 (PC1) transmembrane protein, account for ∼85% of cases of ADPKD (6). Early genetic analyses of polymorphism using markers limited to the region encompassing the PKD1 gene showed the intracystic but not intercystic monoclonality of cyst lining cells (7,8). These findings suggested that unique structural features of the PKD1 gene might be responsible for its mutability (7). Although there is some correlation between different mutations in the PKD1 gene and the severity of the renal phenotype (9), clinical manifestations and the course of the disease in individuals with identical germline mutations are highly variable. Such phenotypic variability has been ascribed to environmental factors and genetic modifiers (10–12). Comparative genomic hybridization and loss of heterozygosity analyses revealed an unexpectedly high frequency of chromosome anomalies and genetic aberrations in cystic cells from patients with ADPKD (13). Even though the genetic variations appeared to cluster around some chromosomes, different cysts from the same patient were genetically heterogeneous displaying diverse chromosomal abnormalities (13). Thus far, the cause of genetic variability remains obscure.
Here we investigated the mechanism underlying the genetic heterogeneity associated with PC1 dysregulation starting from the consideration that similar karyotypic alterations are observed during neoplastic transformation, as a result of genomic instability (14–16). Genomic instability results from mitotic spindle defects and chromosome missegregation, processes that are dependent on centrosome functions (14,17,18). Although there is no correlation between ADPKD and renal carcinoma, various observations liken ADPKD to a benign neoplasia (8,19,20). Cystic cells are hyperproliferative and display abnormal re-expression of N-cadherin, increased integrins expression, and resistance to anoikis (21–24).
To determine whether PC1 plays a direct role on genome organization, we investigated the early effects of PC1 loss on genomic integrity using a hypomorphic model of Pkd1 that we had previously shown to reproduce the cystogenic phenotype of ADPKD epithelia (24). Our findings indicate that the loss of PC1 leads to centrosome aberrations and a dramatic change of ploidy. We show that while cell ploidy rapidly converges toward a seemingly stable karyotype, in the absence of PC1, numerous cytological abnormalities remain. We further demonstrate that abnormal mitoses resulting from alterations of centrosome integrity trigger mitotic catastrophe, thereby contributing to the apoptotic phenotype characteristic of ADPKD cells. Finally, we provide in vivo evidence that centrosome amplification occurs in human ADPKD specimens and propose a new model of ADPKD pathogenesis. These findings provide a mechanism for the origin of genetic diversity of ADPKD cystic cells and a possible cystogenic triggering event that may contribute to the variable progression of the disease.
RESULTS
Loss of PC1 function leads to genomic instability
Recent findings support a role of PC1 in the control of the cell cycle (24,25) through the direct interaction of PC1 with the transcription factor regulator Id2 (26). Overexpression of PC1 in Madin–Darby canine kidney (MDCK) cells induces arrest in the G0/G1 phase of the cell cycle (27), whereas suppression of PC1 promotes rapid progression into S phase (24,25). To determine the early effects of PC1 inhibition on cell cycle progression, we analyzed the cycling profiles of genetically stable cells in a knockdown model of Pkd1 that recapitulates the cystogenic phenotype (24). PC1 expression was knockdown by the constitutive expression of specific anti-Pkd1 siRNA mediated by a puromycin-selectable lentiviral vector, VIRHD/P/siPKD13297 (24) (Fig. 1A and Materials and Methods). The murine inner medullary collecting duct cells, IMCD3, were transduced with the VIRHD/P/siPKD13297 or the control VIRHD/P/siLuc lentivector, in which the PKD1 siRNA was replaced by the anti-luciferase siRNA (Fig. 1A). Following 2 days of puromycin selection (3 days post-transduction), the IMCD/P/siLuc and IMCD/P/siPKD3297 cell populations were derived. PC1 expression in IMCD/P/siPKD13297 was reduced by more than 70% when compared with the transduced control, IMCD/P/siLuc or parental IMCD3 cells (Fig. 1B). Surprisingly, the cell cycle profiles uncovered the emergence of significant subpopulations with abnormal ploidy of 3n and 6n in the PC1 suppressed cells, but not in the control IMCD/P/siLuc (Fig. 1C). The aneuploid peaks were clearly visible at the early time points, but became undetectable by day 8 post-transduction. Such an effect could not be accounted for by the reconstitution of the normal PC1 expression level in the IMCD/P/siPKD13297 cells, as this remained stably inhibited (Fig. 1B). While the overlapping of different populations prevented the analysis of cell cycle progression, these observations revealed profound alterations of DNA content. Transfection of IMCD3 with the pVIRHD/P/siPKD13297, but not the pVIRHD/P/siLuc plasmid, produced cell ploidy changes comparable to those observed after viral transduction, ruling out any interference of the siRNA delivery method (Supplementary Material, Fig. S1A). Furthermore, the effects of PC1 knockdown were not peculiar to IMCD3 cells as similar profiles were observed with the MDCK collecting duct cell line early after transduction with VIRHD/P expressing siRNA targeting the homologous region within the canine PKD1 gene (Supplementary Material, Fig. S1B).
Figure 1.

Knockdown of PC1 induces polyploidy in vitro. (A) Scheme of the self-inactivating VIRHD/P lentiviral vector and its derivatives VIRHD/P/siLuc and VIRHD/P/siPKD1, expressing the control anti-luciferase siRNA and anti-Pkd1 siRNA, respectively. CMV, cytomegalovirus early promoter; RRE, rev responsive element; cPPT, central polypurine tract; H1, human H1 promoter; SV40 ori, SV40 early promoter; Puro, puromycin acetyltransferase; WPRE, Woodchuck Hepatitis Virus post-transcriptional regulatory element; Δ deletion in 3′-LTR. (B) Expression of PC1 in parental IMCD3 cells untransduced or transduced with the VIRHD/P/siLuc (IMCD/P/siLuc) or VIRHD/P/siPKD13297 (IMCD/P/siPKD13297) lentivectors at the indicated days post-transduction (Days pt). The faint band below the main one varies in parallel to the PC1 signal and likely represents a form of partially processed PC1. Actin expression was determined as control of sample loading. Molecular weight standards are indicated (kDa). The numbers under each lane indicate the PC1:Actin expression ratio reported as percentage of the control parental IMCD3 cells. (C) Cells cycle profiles of IMCD3 at different time post-transduction with VIRHD/P/siPKD13297 or VIRHD/P/siLuc. The ploidy of the subpopulations and the values of the subG0/G1 cellular fractions are indicated. (D) Lack of homology between the murine specific PKD112632 siRNA target sequence (boxed) and human PKD1 gene. (E) VIRHD/P/siPKD112632 suppresses the expression of the endogenous PC1 but not human flagged PC1 3 days following transduction (+) of IMCD3 untransfected or transfected with the control vector pCI or with the pCI/hPKD1-Flag plasmids. Control VIRHD/P/siLuc vector had no effect. Tubulin was used as sample loading control. The numbers under each lane indicate the PC1:Tubulin expression ratio reported as percentage of the control cells (untransfected and untransduced cells). (F) Parallel cell cycle analysis showed that following endogenous PC1 knockdown by VIRHD/P/siPKD112632, abnormal ploidy (3n or >4n) was induced in untransfected or control pCI-transfected cells but not in cells expressing the exogenous human PC1. Transduction with control lentivector VIRHD/P/siLuc had no effect at any time.
Specificity of Pkd1 knockdown
To rule out any off-target effects of siRNA, and specifically link the observed genomic alterations to the Pkd1 gene knockdown, rescue experiments were performed by constitutively expressing the human PKD1 gene in IMCD3. To selectively knockdown the expression endogenous murine PC1, we used the VIRHD/P/siPKD112632 lentivector, carrying the siRNA12632 specific for a sequence of the murine Pkd1 gene with no significant homology to the corresponding region of the human counterpart (Fig. 1D).
Murine IMCD3 cells were first transfected with the pCI/hPKD1-Flag plasmid expressing the human PC1 containing a flag epitope on the C-terminus from a full-length PKD1 cDNA driven by the cytomegalovirus (CMV) promoter (28). Untransfected cells or cells transfected with the empty pCI vector were used as control. Twelve hours after transfection, cells were split in three groups that were either left untransduced or transduced overnight with control VIRHD/P/siLuc or VIRHD/P/siPKD112632 lentivectors. Untransduced and transduced cells were then cultured for 48 h in complete medium in the absence or presence of puromycin, respectively. Finally, at day 3 post-transduction, cells were harvested and PC1 expression and cell cycle profiles were analyzed in parallel. As shown in Fig. 1E, using an antibody that does not discriminate between murine and human PC1, increased expression of PC1 was observed in cells transfected with pCI/hPKD1-Flag compared with the control cells (empty vector-transfected and untransfected cells). Across the cell groups, the expression of PC1 was not affected by the transduction with the control VIRHD/P/siLuc vector, but it was appreciably decreased following transduction with VIRHD/P/siPKD112632 (Fig. 1E). As expected, the levels of PC1 expression in pCI/hPKD1-Flag transfected cells remained higher than the normal basal levels of IMCD3 cells. The rehybridization of the membrane with an anti-Flag antibody showed unchanged levels of human PC1 in the pCI/hPKD1-Flag transfected groups, confirming the specific knockdown of the murine endogenous Pkd1 but not of the exogenous transfected PKD1 gene. Correspondingly, the functionality of the exogenous protein was shown in cell cycle profiles in which, similarly to what previously shown, PC1 overexpression arrested the cells in G0/G1 (29) (Fig. 1F). Importantly, following PC1 knockdown with the VIRHD/P/siPKD112632 lentivector, untransfected and control pCI-transfected cells developed abnormal profiles indicative of ploidy alterations (3n, >4n), while the profile of pCI/hPKD1-Flag transfected cells remained unaffected. Comparable results were obtained overexpressing the human PKD1 gene in human 293T cells and using a siRNA targeting the 3′-UTR of the endogenous PKD1 gene, which was not present in the transfected PKD1 cDNA (Supplementary Material, Fig. S2 and Materials and Methods).
Overall, these data indicated that the effects on ploidy and genetic stability observed during PKD1 suppression can be rescued by the expression of siRNA-resistant exogenous PKD1. These results excluded off-site effects and established a causal correlation between the dysregulation of PKD1 expression and genomic instability.
Loss of PC1 function causes aneuploidy and micronucleation
The rapid induction of 3n and >4n peaks indicated that PC1 suppression was associated with genomic alterations, while their progressive disappearance in time suggested the establishment of relatively stable cell populations, in a mechanism resembling genomic convergence (30). Interphase FISH, with chromosome enumerating probes specific for the murine chromosomes 1, 4 and 11, was used to assess ploidy variation observed between day 3 and day 5 following IMCD/P/siPKD13297 transduction (Fig. 2). This analysis indicated that early following PC1 knockdown, cells underwent massive ploidy increase at the whole genome level (Fig. 2A). Notice that similarly to most culture-adapted cell lines, the IMCD3 chromosome number deviates from the wild-type karyotype (chromosome counts around 58, data not shown). Only IMCD/P/siPKD13297 at day 4 post-transduction showed significant changes in chromosome number when compared with the same cells at day 10 post-transduction or parental IMCD3 (P < 0.001). No significant differences were observed in the control transduced IMCD/P/siLuc cells at any time. By day 10 post-transduction, the aberrant karyotypes converged toward the parental ploidy with no gross chromosomal gain or loss (Fig. 2B). This observation is in agreement with the apparently normal cell cycle profiles that we previously showed in long-term PC1 knockdown cystic cells (24). Despite the apparent rapid normalization of ploidy, the cytological analysis of control and PC1 knockdown cells three weeks post-transduction revealed persistent genetic instability (Fig. 2C). In fact, PC1 knockdown cells displayed a significantly higher number of micronuclei, some of which containing kinetochore positive DNA (centric micronuclei), than control IMCD/P/siLuc cells (Fig. 2D). Nucleoplasmic bridges and nuclear malformations were also frequently observed (data not shown), suggesting that PC1 suppression interfered with the mitotic process and chromosome segregation possibly by affecting mitotic spindle organization.
Figure 2.
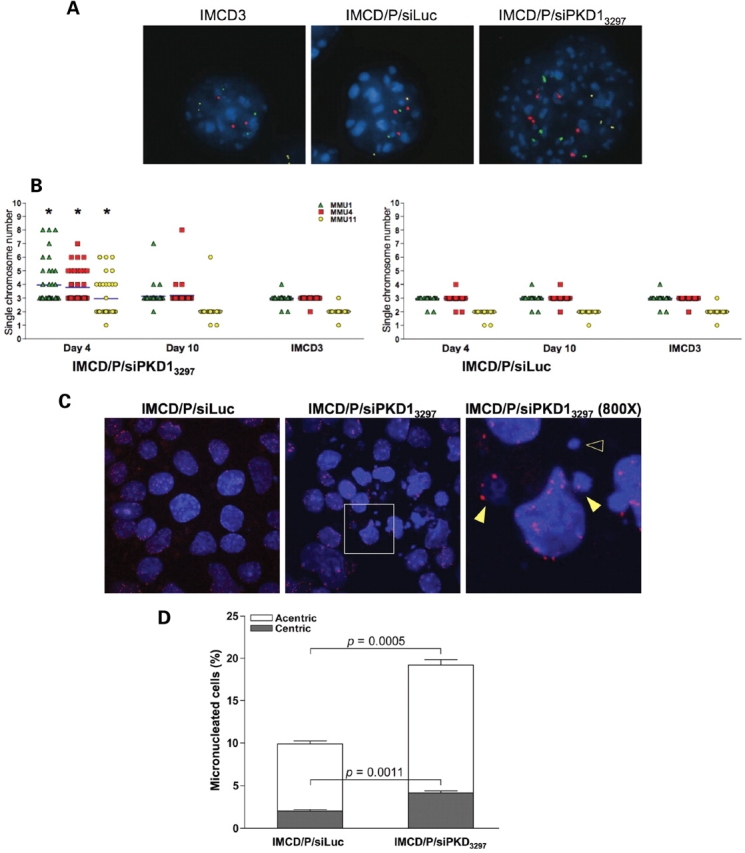
PC1 inhibition induces aneuploidy. (A) Representative interphase FISH with probes specific for the mouse chromosome 1 (green), 4 (red) and 11 (yellow) at day 4 post-transduction. (B) Individual chromosome counts were obtained from forty randomly chosen interphases for each control untransduced parental IMCD3 cells, or transduced control IMCD/P/siLuc and PC1 knockdown IMCD/P/siPKD13297 cells at the indicated times post-transduction (*P < 0.001, by ANOVA using the Kruskal–Wallis method with Dunn post test). (C) Immunostaining with an anti-centromeric proteins serum (red) and DAPI (blue) counterstaining revealed extensive micronucleation in PC1 knockdown cells following three weeks in culture (original magnification, ×200). The inset is enlarged to a final magnification of ×800 to show centric (kinetochore positive, filled arrowhead) and acentric (kinetochore negative, empty arrowhead) micronuclei. (D) The total number of micronuclei and the relative number of centric and acentric micronuclei were determined as mean ± SD in >900 cells. The P-value of the comparison between the two cell populations was determined using the two-tailed unpaired t-test with Welch correction.
PC1 knockdown causes centrosome amplification
To address the early events associated with genomic instability, immunohistological analysis was performed on IMCD3 3 days post-transduction using specific antibodies against α- and γ-tubulin to stain the spindle fibers and the centrosomes, respectively (Fig. 3). PC1 suppression by VIRHD/P/siPKD13297 resulted in a significant increase of the number of cells with supernumerary centrosomes (>2) (Fig. 3A and B). As expected following centrosome amplification, atypical mitoses with multipolar spindles were also a common finding in IMCD/P/siPKD13297 cells, but were absent in control IMCD/P/siLuc cells (P = 0.0003) (Fig. 4A and C). Transfection of the pVIRHD/P/siPKD13297 plasmid leads to centrosome amplification as well, further indicating that the effect was independent of viral transduction per se (Supplementary Material, Fig. S3A). Although IMCD/P/siPKD13297 cells with aberrant centrosome amplification persisted in long-term culture, their proportion decreased as the cells were maintained in culture (Fig. 3C, compare 4 and 21 days post-transduction and Supplementary Material, Fig. S3B, days 3 and 35 post-transduction). However, the number of micronucleated cells increased in time (Supplementary Material, Fig. S3B), suggesting that while the centrosome amplification phenotype is unstable, it results in accumulative genomic damage. Comparable centrosome amplification and nuclear aberrations were obtained using a second siRNA (siPKD10071) targeting a different Pkd1 sequence, supporting the specificity of centrosome amplification on PC1 loss (Supplementary Material, Fig. S3C–E). Furthermore, transduction of untransfected and control pCI-transfected IMCD3 with VIRDH/P/siPKD112632, but not with control lentivector VIRDH/P/siLuc, lead to a significant increase of cells with supernumerary centrosomes. Importantly, however, the expression of exogenous human PC1 in pCI-hPKD1-Flag transfected cells prevented centrosome amplification despite the knockdown of the endogenous Pkd1 by the VIRDH/P/siPKD112632 lentivector (Fig. 4D). The rescue of the normal phenotype was also observed following the transfection of exogenous PKD1 in 293T cells (Supplementary Material, Fig. S3F). These results confirmed the causal relationship between knockdown of PC1 and the loss of centrosome integrity.
Figure 3.
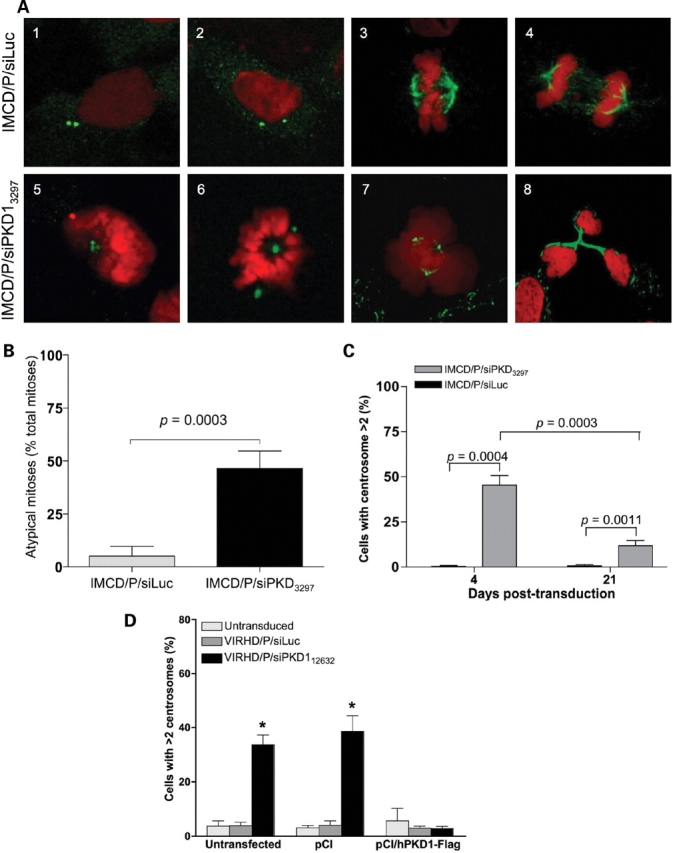
Suppression of PC1 induces centrosome amplification and multipolar spindle formation. (A) IMCD/P/siLuc (1–4) and IMCD/P/siPKD13297 (5–8) were immunostained for γ-tubulin (green) (1, 2, 5 and 6) or for α,β-acetylated-tubulin (green) (3, 4, 7 and 8) to visualize the centrosomes or the spindle fibers, respectively, and counterstained with propidium iodide (red). PC1 knockdown cells shows abnormal centrosomes numbers (5 and 6 versus 1 and 2) and atypical mitoses with multipolar spindles (7 and 8 versus 3 and 4). Original magnification: ×1000. (B) PC1 knockdown cells showed a significantly higher frequency of atypical mitoses indicated as mean ± SD of percentage of total mitoses from four experiments (Unpaired two-tailed t-test with Welch correction). (C) Following transduction, a significant number of cells displayed supernumerary centrosomes early after PC1 knockdown (day 4) and persisted, though at significant lower levels, when the same cells were cultured long-term (day 21). A total of 1000 cells from 3 independent experiments were counted and reported as mean ± SD. The unpaired two-tailed t-test with Welch correction was applied for statistical analysis. (D) The expression of exogenous PC1 prevented centrosome amplification following the knockdown of the endogenous gene by VIRHD/P/siPKD112632, while significant increase in cells with supernumerary centrosomes was evident in untransfected or control pCI-transfected cultures (*P < 0.0001 by ANOVA).
Figure 4.

Loss of PC1 function induces mitotic catastrophe. (A) Immunohistochemical detection of cytochrome C (green) and caspase-3 (red) on DAPI (blue) counterstained DNA provided evidence of apoptotic activation during multipolar spindle separation only in PC1 knockdown cells but not in control cells. Original magnification ×1000. (B) 3 days post-transduction, mitoses (black bars) in apoptotic cells with diffuse cytochrome C staining and co-expression of caspase-3 (white bars) were estimated in five randomly chosen fields and reported as mean ± SD (n > 500 for each culture). *P = 0.003; **P = 0.0002 by two-tailed t-test with Welch correction (IMCD/P/siLuc versus IMCD/P/siPKD13297).
PC1 knockdown causes mitotic catastrophe
The centrosome is the main microtubule organizing center that functions as multiplatform scaffold for the intersection of diverse signaling networks important for cell motility, cell division, subcellular organelle organization and protein transport (31). Centrosome amplification and spindle rearrangement cause asymmetric chromosome segregation and genomic instability (16,18). These events lead to aneuploidy or mitotic catastrophe, a form of cell death occurring during mitosis or from mitotic failure (32,33). To determine whether PC1 inhibition caused mitotic catastrophe, IMCD/P/siLuc and IMCD/P/siPKD13297 cells were co-stained with antibodies specific for caspase-3 and cytochrome C and counterstained with DAPI, 3 days post-transduction. In PC1 knockdown cells, diffused cytochrome C staining, consequent to mitochondrial membrane permeabilization, overlapped with increased activated caspase-3 and atypical mitoses with multipolar spindles (Fig. 4). Consistently with the slight accumulation of the subG0/G1 cell fraction in the IMCD/P/siPKD13297 but not in the control IMCD/P/siLuc cells, evidence of mitotic catastrophe was not found in control cells (Fig. 1C). Based on the visual cytological evidence, the quantitative estimate of the apoptotic cells in mitosis revealed a significant frequency of mitotic catastrophe in IMCD/P/siPKD13297 (Fig. 4B), and indicated that mitotic catastrophe, at least in part, accounted for the cell death associated with ADPKD and PC1 knockdown (2–4,24).
PC1 dysregulation causes genomic instability and centrosome amplification in human primary renal cells
To corroborate the role of PC1 in genomic stability, we analyzed the effects of its knockdown in human primary renal epithelia cells (Fig. 5). Transduction of human primary renal cells with the VIRHD/P/siPKD3211 but not the VIRHD/P/siLuc lentivector produced cell cycle profiles indicative of ploidy alteration (Fig. 5A). Abnormal peaks representing ploidy of 3n and >4n appeared at day 3 post-transduction and persisted for the duration of the experiments until day 11. These abnormalities were confirmed by interphase FISH using probes specific for human chromosomes 6, 9 and 17, indicating the aneuploid state of the PC1 knockdown cells (Fig. 5B). Notably, compared with the fast growing IMCD3 cells, both the abnormal cell cycle profiles and aneuploidy persisted in the slow growing primary human renal epithelial cells for the duration of the time of culture. These results suggest the tendency of primary human renal epithelial cells to stabilize around a tetraploid status under this culture conditions or, more likely, that cell division is required for the rapid convergence toward the near-parental ploidy. Immunostaining γ-tubulin revealed a significant increase in the number of cells with amplified centrosomes following PKD1-siRNA but not control Luc-siRNA expression, indicating that the effect of PC1 knockdown was not restricted to established cells lines (Fig. 5C and D).
Figure 5.
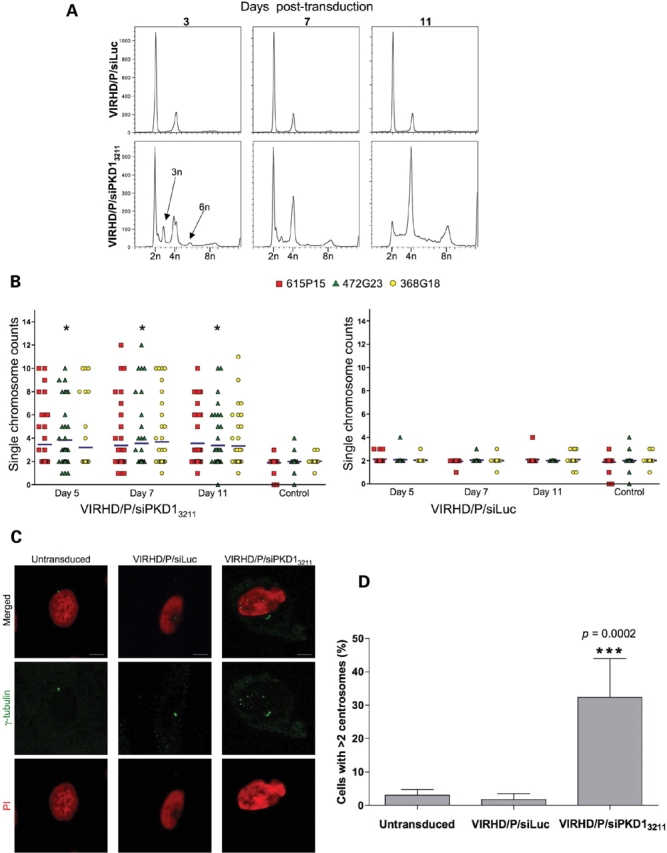
Genomic instability and centrosomal amplification by PC1 knockdown in primary human renal epithelial cells. (A) Cell cycle analysis of VIRHD/P/siLuc (control) or VIRHD/P/siPKD13211 transduced primary human renal epithelial cells revealed peaks of aberrant ploidy in PC1 knockdown cells only. (B) Interphase FISH confirmed significant aneuploidy in the VIRHD/P/siPKD13211- but not in control-transduced cells (*P = 0.002 by ANOVA). (C) Amplified centrosomes were detected using an anti-γ-tubulin antibody (green) 5 days following PC1 knockdown. Nuclei were counterstained with propidium iodide (red). Characteristic increased nuclear size is also observable in PC1 knockdown cells. Reference bars represent 2.5 µm length (original magnification ×1000). (D) The number of cells with supernumerary centrosomes in untransduced, control transduced (VIRHD/P/siLuc) and PC1 knockdown cells (VIRHD/P/siPKD13211) is shown as percentage mean ± SD of the total number of cells counted (n > 200 for each culture from two independent experiments). Statistical analysis was performed using a two-tailed unpaired t-test with Welch correction.
Centrosome amplification occurs in ADPKD
To determine whether centrosome amplification occurs in vivo during Pkd1 dysregulation, we analyzed the kidneys of a murine ADPKD model in which the Pkd1 gene is conditionally inactivated in the distal segments of the nephrons (34) (Fig. 6). This model allows the generation of viable offspring in which severe renal cystic disease progresses rapidly leading to renal failure and cell death by day 17 after birth (34). Kidney specimens were analyzed at two stages of disease progression, P7 and P14 (Fig. 6A). To unequivocably identify the centrosome in primary tissues, immunostaining was performed with antibodies specific for γ-tubulin (green) and for a second centrosomal protein, pericentrin (red) (Fig. 6B). Supernumerary centrosomes were readily detectable in a significant number of cells at both time points, but absent in control kidneys, in which one or occasionally two centrosomes per cells were counted (Fig. 6C). Despite the more extensive renal damage of the later time point, no significant difference in the number of cells with abnormal centrosomes was observed at P7 and P14. This evidence confirmed the instability of the amplified centrosome phenotype and indicated that centrosome amplification is not secondary to the renal damage. Importantly, loss of centrosome integrity was not confined to the ADPKD knockout mouse model but was also observed in the kidneys of ADPKD patients. In fact, centrosome amplification was detected in all renal specimens from ADPKD patients (n = 3), but not in cells from control non-cystic human kidneys (n = 5) (Fig. 7A and B). Interestingly, similarly to the animal ADPKD mouse model, centrosomal amplification was also observed in epithelial cells of tubules with seemingly normal histological appearance (Fig. 7C), suggesting that centrosomal amplification may precede rather than follow the cystogenetic process.
Figure 6.
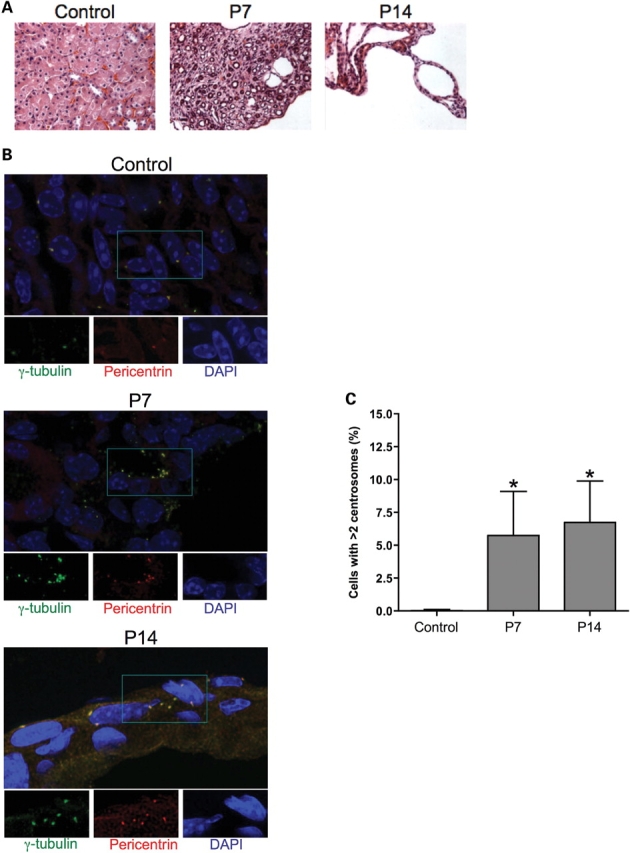
Centrosomal amplification in Pkd1 knockout mouse model. (A) Sections from control (P15) and Pkd1flox/-:Ksp-Cre (P7 and P14) kidneys were stained with hematoxylin and eosin (H&E) to define the cystic progression (original magnification ×400). (B) Centrosomes were identified using pericentrin (red) and γ-tubulin (green) immunostaining and DAPI-counterstaining. Large frames show the merged images. Individual stainings of areas in the insets are shown below (original magnification ×1000). (C) The number of cells with supernumerary centrosomes (>2) was determined by counting six randomly chosen fields across two slides (n > 350). Statistical analysis was performed using ANOVA with Bonferroni post-test; *P = 0.0011 compared to control. No statistical difference was observed between P7 and P14.
Figure 7.
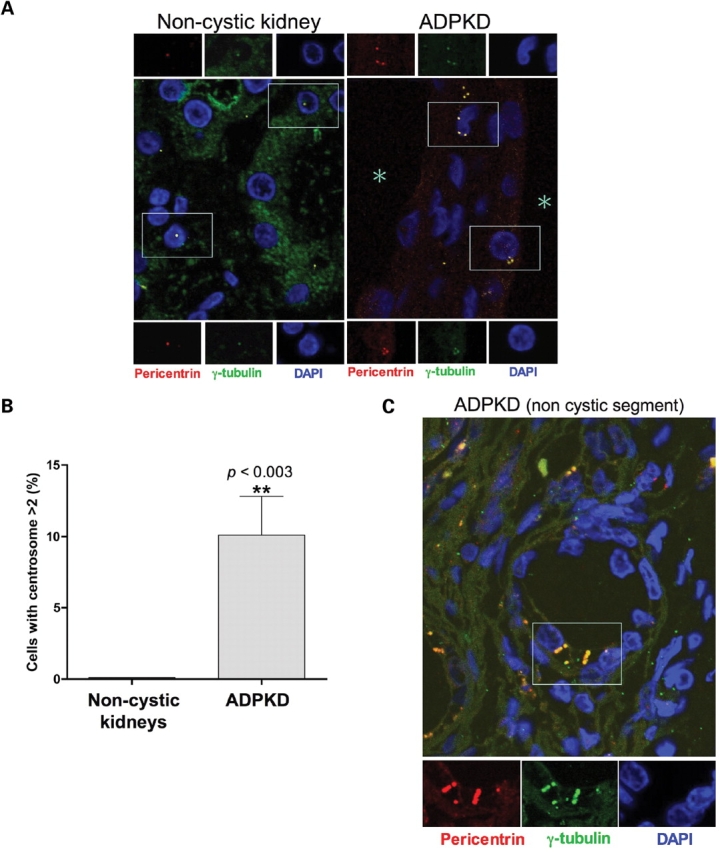
Centrosome amplification occurs in ADPKD patients. (A) Pericentrin (red) and γ-tubulin (green) immunostaining of DAPI-counterstained archival tissues from control non-cystic and ADPKD human kidneys (original magnification ×1000). The large frames show the merged fields while individual staining of centrosomal markers corresponding to the near insets are further magnified at the top and the bottom. Shown are representative images from one of five non-cystic controls and one of three ADPKD patients. (B) Scores of cells with more than two centrosomes were obtained from different non-cystic and ADPKD patients (each group n = 3; total count of randomly chosen cells >600). Statistical analysis was performed using the unpaired two-tailed t-test with Welch correction. (C) Centrosome amplification was observed also in epithelial cells within non-cystic tubules from ADPKD specimens. The asterisks mark the lumen of the cysts.
DISCUSSION
Our results show that PC1 is involved in the maintenance of centrosome integrity and that centrosome amplification and consequent failure to form bipolar spindles are early events following loss of PC1 function. We also provide the first in vivo evidence that centrosomal aberrations occur in ADPKD patients and animal models but not in non-cystic control kidneys, suggesting a role of centrosome amplification in ADPKD pathogenesis.
The amplification of centrosome, as well as the formation of micronuclei and defects in DNA segregation, leads to genetic instability (18). This may cause the cell to die or survive a cycle through asymmetric division and the generation of viable, yet aneuploid, cells in which cell death may ensue as consequence of excessive loss of genetic material (33). We showed that PC1 suppression induced mitotic catastrophe, a mechanism of cell death triggered by mitotic failure that limits the survival of cells with aberrant genetic composition.
Centrosome amplification occurred early upon PC1 suppression but became significantly less frequent at later times, confirming the unstable nature of supernumerary centrosomes. Correspondingly, karyotypic heterogeneity reached its maximum in the first days post-transduction and then progressively decreased in time. Though less obvious than change in ploidy, genetic abnormalities persisted in PC1 suppressed cells as indicated by the accumulation of cytological aberrations in long-term cultures (Supplementary Material, Fig. S3), in agreement with the cytogenetic anomalies previously reported in cystic epithelial cells (13). This genomic damage may underlie the apoptotic phenotype characteristic of cystic cells and PC1 knockdown cells (2,4,24). It should be noted that changes in ploidy are independent of the near-triploid karyotype of IMCD3. Some degree of aneuploidy is also a common response of primary cells following in vitro adaptation (Fig. 5) (35,36) and the vast majority of established cell lines possesses an aberrant karyotype, which remains relatively stable under normal culture conditions. Therefore, the departure from the vegetative ploidy (which, in agreement with previous literature, for the cell cycle purpose we referred to as 2n) is not a peculiar effect of the in vitro growth of IMCD3 cells but a specific response to PC1 knockdown. The persistence of aneuploidy in human primary cells is likely due to their much slower growth rate compared with IMCD3, 293T or MDCK cells (Supplementary Material, Figs. S1 and 2), again suggesting that the selection of genomically unstable cells occurs during mitosis and mitotic failure.
The importance of the centrosome in the cystogenetic process is underlined by the localization of most cystogenic proteins within the centrosome or with the cilium, which stems from one of the basal bodies around which the centrosome is organized (37,38). While PC1 also localizes in cilia (39) and has been observed in the centrosome of human endothelial cells (40), our results establish the first direct functional link between PC1 and centrosome integrity.
Recently, the loss of planar cell polarity consequent to alteration of mitotic spindle orientation has been suggested as an early mechanism of the cystogenic process in a mouse polycystic kidney model (41). Whether the interference of PC1 knockdown on centrosome integrity contributes to spindle misorientation and loss of planar cell polarity remains an important question to address. The presence of amplified centrosome in non-dilated nephron segments suggests that similarly to loss of planar cell polarity, centrosome aberrations precede cystic transformation. Further studies will be required to elucidate the complex molecular events leading to centrosomal amplification in the absence of PC1. However, the present findings provide a mechanism underlying the genetic heterogeneity of renal cystic epithelia and possibly supporting the variable progression of the disease in individuals with identical germline mutations.
The rapid disappearance of the remarkable polyploidism in the fast growing cell lines, early after PC1 inhibition, suggested that cells genomically converged toward a chromosomal composition adaptive to growth, similarly to what described in aneuploid cells and tumors (30,42–45). The emergence of genomic convergence is consistent with the seemingly stable but altered karyotypes and apoptosis observed in ADPKD epithelial cells (8,13,46) and PC1 knockdown cells (24). Cells with randomly generated genetic reassortment may survive genomic instability and focally expand under the selective pressure of the local environment, leading to the intracystic monoclonality. Since the results of genomic instability are unpredictable and the adaptation process occurs independently in different cells, intercystic polyclonality would be expected consequently to centrosome amplification and chromosomes missegregation (13,42). Therefore, the diverse intrafamilial progression of ADPKD may result from the variable interaction between cells that are genetically altered, due to the loss of PC1, and their surrounding milieu. The formation of cysts, rather than their growth, correlates with the disease progression (47). The rapid occurrence of centrosome amplification following PC1 dysregulation and its presence in non-cystic tubular cells suggest that the loss of centrosome integrity may be an early component of the cystogenetic mechanism. However, it is impossible to determine whether disease progression correlates with centrosome amplification, as this phenotype is highly unstable. While we never observed centrosome amplification in control renal tissues, the number of cells with aberrant centrosomes did not appear to change significantly with the stage of the disease in the ADPKD mouse model. The attempt to determine the number of micronucleated cells in vivo proved unsuccessful due to the difficulty to perform such morphological analysis in solid tissues because of the overlapping of nuclei from adjacent cells. Although in vitro micronucleated cells accumulated in time, it is not possible to extrapolate their frequency in vivo, and the extent and the persistence of genomic damage in vivo remains to be further characterized.
Centrosomal aberrations and aneuploidy are common findings in neoplastic cells and are generally associated with increased aggressiveness (48). However, recent evidence indicated that aneuploidy-induced transformation is a slow process with incomplete penetrance and that high levels of genomic instability may actually inhibit tumorigenesis (35). Though this may account for the lack of correlation between ADPKD and malignant carcinomas, the genomic instability of the PC1 knockdown emphasizes the remarkable similarities that this hyperproliferative disease shares with benign neoplasias, as previously observed (8,19,20). Similarly to carcinogenesis studies, it is equally difficult to define the causal relationship between the centrosomal aberrations and the cystogenic process. Nevertheless, our data provide further rationale for the development and use of antiproliferative agents, which have shown promising results in different models of polycystic kidney disease (49–54).
The link of PC1 with centrosome integrity and genomic instability has profound implications on the pathogenetic mechanisms of ADPKD. Based on the focal nature of the cysts, it has been proposed that PKD1 may be a recessive trait at cellular level and that a second molecular hit is necessary for the development of ADPKD (two-hit hypothesis) (7,55). Evidence has been provided of a two-step process of cystogenesis based on the disease gene-dependent cyst initiation and a disease gene-independent cyst expansion (47). On the other hand, the level of PC1 expression has been shown to be important for cyst development, supporting the haploinsufficiency mechanism in the pathogenesis of ADPKD (56,57). Based on our findings, we propose that the second hit and somatic mutation is inherent to the dysregulation of PC1 per se and the consequent genomic instability. Accordingly, a model can be envisioned in which the derailment of PC1 expression from the physiological range triggers centrosome amplification, genetic instability and the emergence of genotypic heterogeneity. Although the genomically aberrant cells would be generally eliminated through mitotic catastrophe or apoptosis, sporadic adaptation of these cells may allow the selection of the cystic phenotype. This model is consistent with the evidence of cyst formation in a relative low number of nephrons (58), the presence of apoptotic cells in both tubular and cystic cells in ADPKD kidneys (59) and the clonality of cystic epithelia (7). The adaptive response following genomic instability is stochastically determined, thereby supporting the great variability of ADPKD manifestations despite identical germline mutations (12). The genetic instability model that we propose reconciles the two-hit and the haploinsufficiency hypotheses of ADPKD pathogenesis (2,60) and provides a PC1-dependent mechanism for the generation of somatic mutation that may trigger cyst initiation. Similarly to the two-phase cystogenic process (47), such interpretation suggests caution in directly correlating PC1 functions with the biological manifestations characteristic of cystic cells. While the cystic phenotype is unambiguous, it may be the result of adaptive responses of genotypically diverse cells and, possibly, mechanistically independent from the primary functions of PC1. It will be important to determine whether centrosomal aberrations occur in other renal and non-renal cystic diseases.
In conclusion, we demonstrated that the loss of PC1 function causes centrosome amplification and genomic instability. In vitro, these events reveal an extraordinary genomic plasticity that may provide the genetic diversity from which the cystogenic phenotype can eventually evolve. These new functions of PC1 provide novel insights into the early events of ADPKD pathogenesis.
MATERIALS AND METHODS
Cell cultures and reagents
Cell lines were maintained at 37°C in 5% CO2 in DMEM (Invitrogen, Carlsbad, CA) supplemented with 10% fetal bovine serum (FBS) (293T cells) or in a 1:1 (vol:vol) of DMEM/F12 medium (Invitrogen) supplemented with 10% FBS (murine inner medullary collecting duct epithelial cells, IMCD3, and the transduced cell lines, IMCD/P/siPKD13297 and IMCD/P/siLuc). Murine renal tissues were obtained from P7 and P14 Pkd1flox/-:Ksp-Cre mice as previously described (34) and 5 µm thick section were prepared for H&E and immunohistochemical analyses. Normal adult human primary renal epithelial cells were purchased from Cambrex (Cambrex Bio Science, Walkersville, MD). All primary cells were plated in type I collagen-coated plates and maintained in complete REBM medium (Cambrex Bio Science). Human specimens were obtained from archival materials according to the guidelines of a protocol approved by the IRB of The Mount Sinai School of Medicine. Renal biopsy specimens were fixed in formalin and embedded in paraffin before 2–4 µm section were cut. Sections from three ADPKD patients, age 44, 53 and 70, were used. Five control kidneys were used including: 1 transplant donor (age 67), 3 idiopathic membranous nephropathy (ages 19, 43 and 68); 1 diffuse segmental sclerosing lupus glomerulonephritis (age 45). Renal specimens from the lupus patient and one of the membranous nephropathy patients had moderate parenchymal scarring; the others contained no significant tubular atrophy or interstitial fibrosis.
Lentiviral vector generation
The self-inactivating VIRHD/P lentiviral vector was generated by inserting the SV40ori/puromycin cassette from the pBABE/Puro retroviral vector (kindly provided by Dr Land) digested with EcoRI and ClaI and filled-in with Klenow polymerase between the EcoRV and filled-in XhoI sites of the VIRHD/E vector (24). The following oligonucleotides were annealed and inserted between the BamHI and EcoRI sites of VIRHD/P under the control of the H1 promoter for specific gene targeting. Murine Pkd1 gene: PKD1/3297/S 5′-gatccgccatgtgagcaacatcaccattagatcaggtgatgttgctcacatggtttttcg-3′ and PKD1/3297/AS 5′-aattcgaaaaaccatgtgagcaacatcacctgatctaatggtgatgttgctcacatggcg-3′ siPKD1/12632/S 5′-gatcccgtctgcttgtccagtttgattcaagagatcaaactggacaagcagactttttcg-3′ and siPKD1/12632/AS: 5′-aattcgaaaaagtctgcttgtccagtttgatctcttgaatcaaactggacaagcagacgg-3′. Human PKD1 gene: PKD1/3211/S 5′-gatccgccacgtgagcaacgtcaccattagatcaggtgacgttgctcacgtggttttttggaag-3′ and PKD1/3211/AS 5′-aattcttccaaaaaaccacgtgagcaacgtcacctgatctaatggtgacgttgctcacgtggcg-3′. Luciferase gene (siLuc): Luc/850/S 5-gatccgtgcgttgctagtaccaacttcaagagagttggtactagcaacgcacttttttgg-3′ and Luc/850/AS 5-aattccaaaaaagtgcgttgctagtaccaactctcttgaagttggtactagcaacgcacg-3′ (specific complementary siRNA sequences are italicized). The siPKD13211 and siPKD13927 shRNAs differ by two nucleotides as they are designed to target homologous regions in the human and mouse PKD1 genes, respectively. Lentiviral vectors were produced by transient transfection of 293T cells and titered as previously detailed (61). Transductions were carried out at a multiplicity of infection of 20. Selection in the presence of 10 µg/ml puromycin was started 16-h post-transduction.
IMCD3 cells were transfected with the pCI/hPKD1-Flag plasmid [kindly provided by Dr G. Germino (28)] using Amaxa Nuclefector system (Amaxa, Inc., Gaithersburg, MD) according to the manufacturer's instructions. Transfection efficiencies, as determined by cotransfection with an EGFP-expressing plasmid (1:20 of total DNA), were higher than 90%. The control empty pCI plasmid was from Promega, Corp. (Madison, WI).
Immunodetection
Cells were harvested by scraping, washed twice in PBS and lysed in RIPA buffer containing Complete Protease Inhibitors Cocktail (Roche Diagnostics, Indianapolis, IN), and Phosphatase Inhibitors Cocktail-1 (Sigma Aldrich, St Louis, MO). Protein concentration was, determined using Bio-Rad Protein Assay (Bio-Rad, Hercules, CA). Protein extracts (200 µg) from each sample were resolved by SDS–polyacrylamide gel electrophoresis on a 4–12% gradient gel and electrophoretically blotted onto immobilon-P membrane (Millipore, Bedford, MA). The membrane was incubated with primary goat polyclonal anti-polycystin-1 (C20, Santa Cruz Biotechnology, Santa Cruz, CA) (24,62) in 5% milk in PBS containing 0.05% Tween-20. Immunocomplexes were detected with peroxidase-conjugated goat anti-goat IgG antibody (1:5000) and the enhanced chemiluminescence detection kit, Lumi-Light Plus (Roche Diagnostics). To control for sample loading, membranes were stripped and actin or tubulin expression was detected using an anti-actin (1:20 000, Chemicon International, Temecula, CA) or anti-tubulin (1:20 000, Santa Cruz Biotechnology) antibodies, respectively. Relative protein expression was determined following densitometric analysis of radiographic films using ImageJ software (NIH). Values are expressed as percentage of the PC1/Actin or PC1/Tubulin ratio of control cells.
Cell cycle analysis
At the indicated time points post-transduction, cells were washed twice with PBS, trypsinized and resuspended at 106 cells/ml in DMEM/F2 supplemented with 10% FCS. The samples were then processed using the CycleTEST PLUS (Becton Dickinson, San Jose, CA) following the manufacturer's protocol, and run through a FACScan flow cytometer (Beckman Coulter). Data were analyzed using the FlowJo software.
Immunohistochemistry
In preparation for immunofluorescence microscopy, cells grown on type I collagen-coated glass coverslips were fixed with −20°C methanol for 10 min. Murine and human tissues were deparaffined and rehydrated before blocking in PBS with 5% BSA (PBSB) for 60 min at room temperature. Samples were then incubated with the indicated primary antibodies in PBSB for 60 min and then washed three times for 5 min each with PBSB at room temperature. The following specific primary antibodies were utilized at the indicated final dilutions: goat polyclonal anti-γ-tubulin (1:100); goat polyclonal anti-cytochrome C (1:50); goat polyclonal anti-caspase-3 (1:50) (Santa Cruz Biotechnology); rabbit polyclonal anti-pericentrin (1:300) (Covance, Berkeley, CA); human anti-centromere proteins serum (1:100) (Antibodies Inc., Davis, CA). Primary antibodies were visualized with FITC-conjugated donkey anti-goat (1:500), Texas Red-conjugated mouse anti-rabbit (1:500), Cy5 goat anti-human (1:500) secondary antibodies (Jackson Immuno Research), whereas nuclei were counterstained with 4′,6-diamidino-2-phenylindole (DAPI) or propidium iodide. The slides were then mounted in Vectashild anti-fade reagent (Vector Laboratories, Burlingame, CA) and analyzed with a Leica confocal fluorescence microscope.
FISH analysis
The following mouse BAC clones 99M3 (MMU1), 321A18 (MMU4) and RP23-333B13 (MMU11), or human BAC clones RP11-472G23 (chromosome 6), RP11-615P15 (chromosome 9), RP11-368G18 (chromosome 17) (Children's Hospital Oakland Research Institute) were labeled by nick-translation and hybridized to interphase cells according to standard procedures (protocols available at http://www.riedlab.nci.nih.gov). Labeling was performed as following: 99M3 and RP11-472G23–Spectrum Green dNTP (Molecular Probes), RP23-333B13 and RP11-615P15–Spectrum Orange dNTP (Molecular Probes) and 321A18 and RP11-368G18–biotin (Roche) detected with avidin Cy5 (1:200) (Rockland Immunochemicals). Images were acquired using an Axiovert 200 microscope (Zeiss), connected to a Retiga 4000 camera (Q-Imaging) using the Openlab software (Improvision). Forty interphases were counted for each time point.
Statistical analysis
For the statistical analyses, the InStat 3.0 software (GraphPad Software, San Diego, CA) was used to perform the ANOVA or the unpaired two-tailed t-test with Welch correction, as indicated.
SUPPLEMENTARY MATERIAL
Supplementary Material is available at HMG Online.
FUNDING
Funding for this work was provided by the National Institutes of Health (DK63611 to G.L.G.) and by a research grant from the PKD Research Foundation (G.L.G.).
ACKNOWLEDGEMENTS
We thank Dr Hyink, C. Iomini, P. Klotman, P. Mundel, and P. Wilson for critical review of this manuscript and G. Germino for kindly providing the pCI/hPKD1-Flag plasmid. We are thankful to J. Smith at the Genome Imaging Sheared Resource at the Albert Einstein College of Medicine and to Xin Tian at the Yale School of Medicine for technical assistance.
Conflict of Interest statement. None declared.
REFERENCES
- 1.Igarashi P. Genetics and pathogenesis of polycystic kidney disease. J. Am. Soc. Nephrol. 2002;13:2384–2398. doi: 10.1097/01.asn.0000028643.17901.42. [DOI] [PubMed] [Google Scholar]
- 2.Ong A.C., Harris P.C. Molecular pathogenesis of ADPKD: the polycystin complex gets complex. Kidney Int. 2005;67:1234–1247. doi: 10.1111/j.1523-1755.2005.00201.x. [DOI] [PubMed] [Google Scholar]
- 3.Sutters M., Germino G.G. Autosomal dominant polycystic kidney disease: molecular genetics and pathophysiology. J. Lab. Clin. Med. 2003;141:91–101. doi: 10.1067/mlc.2003.13. [DOI] [PubMed] [Google Scholar]
- 4.Wilson P.D. Polycystic kidney disease. N. Engl. J. Med. 2004;350:151–164. doi: 10.1056/NEJMra022161. [DOI] [PubMed] [Google Scholar]
- 5.Torres V.E., Harris P.C. Mechanisms of Disease: autosomal dominant and recessive polycystic kidney diseases. Nat. Clin. Pract. Nephrol. 2006;2:40–55. doi: 10.1038/ncpneph0070. [DOI] [PubMed] [Google Scholar]
- 6.Harris P.C. Molecular basis of polycystic kidney disease: PKD1, PKD2 and PKHD1. Curr. Opin. Nephrol. Hypertens. 2002;11:309–314. doi: 10.1097/00041552-200205000-00007. [DOI] [PubMed] [Google Scholar]
- 7.Qian F., Watnick T.J., Onuchic L.F., Germino G.G. The molecular basis of focal cyst formation in human autosomal dominant polycystic kidney disease type I. Cell. 1996;87:979–987. doi: 10.1016/s0092-8674(00)81793-6. [DOI] [PubMed] [Google Scholar]
- 8.Brasier J.L., Henske E.P. Loss of the polycystic kidney disease (PKD1) region of chromosome 16p13 in renal cyst cells supports a loss-of-function model for cyst pathogenesis. J. Clin. Invest. 1997;99:194–199. doi: 10.1172/JCI119147. [DOI] [PMC free article] [PubMed] [Google Scholar]
- 9.Rossetti S., Burton S., Strmecki L., Pond G.R., San Millan J.L., Zerres K., Barratt T.M., Ozen S., Torres V.E., Bergstralh E.J., et al. The position of the polycystic kidney disease 1 (PKD1) gene mutation correlates with the severity of renal disease. J. Am. Soc. Nephrol. 2002;13:1230–1237. doi: 10.1097/01.asn.0000013300.11876.37. [DOI] [PubMed] [Google Scholar]
- 10.Persu A., Duyme M., Pirson Y., Lens X.M., Messiaen T., Breuning M.H., Chauveau D., Levy M., Grunfeld J.P., Devuyst O. Comparison between siblings and twins supports a role for modifier genes in ADPKD. Kidney Int. 2004;66:2132–2136. doi: 10.1111/j.1523-1755.2004.66003.x. [DOI] [PubMed] [Google Scholar]
- 11.Fain P.R., McFann K.K., Taylor M.R., Tison M., Johnson A.M., Reed B., Schrier R.W. Modifier genes play a significant role in the phenotypic expression of PKD1. Kidney Int. 2005;67:1256–1267. doi: 10.1111/j.1523-1755.2005.00203.x. [DOI] [PubMed] [Google Scholar]
- 12.Peters D.J., Breuning M.H. Autosomal dominant polycystic kidney disease: modification of disease progression. Lancet. 2001;358:1439–1444. doi: 10.1016/S0140-6736(01)06531-X. [DOI] [PubMed] [Google Scholar]
- 13.Gogusev J., Murakami I., Doussau M., Telvi L., Stojkoski A., Lesavre P., Droz D. Molecular cytogenetic aberrations in autosomal dominant polycystic kidney disease tissue. J. Am. Soc. Nephrol. 2003;14:359–366. doi: 10.1097/01.asn.0000046963.60910.63. [DOI] [PubMed] [Google Scholar]
- 14.Gisselsson D. Mitotic instability in cancer: is there method in the madness? Cell Cycle. 2005;4:1007–1010. doi: 10.4161/cc.4.8.1884. [DOI] [PubMed] [Google Scholar]
- 15.Nakanishi M., Shimada M., Niida H. Genetic instability in cancer cells by impaired cell cycle checkpoints. Cancer Sci. 2006;97:984–989. doi: 10.1111/j.1349-7006.2006.00289.x. [DOI] [PMC free article] [PubMed] [Google Scholar]
- 16.Kramer A., Neben K., Ho A.D. Centrosome replication, genomic instability and cancer. Leukemia. 2002;16:767–775. doi: 10.1038/sj.leu.2402454. [DOI] [PubMed] [Google Scholar]
- 17.Emdad L., Sarkar D., Su Z.Z., Fisher P.B. Emerging roles of centrosomal amplification and genomic instability in cancer. Front. Biosci. 2005;10:728–742. doi: 10.2741/1567. [DOI] [PubMed] [Google Scholar]
- 18.Fukasawa K. Centrosome amplification, chromosome instability and cancer development. Cancer Lett. 2005;230:6–19. doi: 10.1016/j.canlet.2004.12.028. [DOI] [PubMed] [Google Scholar]
- 19.Grantham J.J. Polycystic kidney disease: neoplasia in disguise. Am. J. Kidney Dis. 1990;15:110–116. doi: 10.1016/s0272-6386(12)80507-5. [DOI] [PubMed] [Google Scholar]
- 20.Harris P.C., Watson M.L. Autosomal dominant polycystic kidney disease: neoplasia in disguise? Nephrol. Dial. Transplant. 1997;12:1089–1090. doi: 10.1093/ndt/12.6.1089. [DOI] [PubMed] [Google Scholar]
- 21.Roitbak T., Ward C.J., Harris P.C., Bacallao R., Ness S.A., Wandinger-Ness A. A polycystin-1 multiprotein complex is disrupted in polycystic kidney disease cells. Mol. Biol. Cell. 2004;15:1334–1346. doi: 10.1091/mbc.E03-05-0296. [DOI] [PMC free article] [PubMed] [Google Scholar]
- 22.Wilson P.D., Geng L., Li X., Burrow C.R. The PKD1 gene product, ‘polycystin-1,’ is a tyrosine-phosphorylated protein that colocalizes with alpha2beta1-integrin in focal clusters in adherent renal epithelia. Lab. Invest. 1999;79:1311–1323. [PubMed] [Google Scholar]
- 23.van Adelsberg J. Murine polycystic kidney epithelial cell lines have increased integrin-mediated adhesion to collagen. Am. J. Physiol. 1994;267:F1082–F1093. doi: 10.1152/ajprenal.1994.267.6.F1082. [DOI] [PubMed] [Google Scholar]
- 24.Battini L., Fedorova E., Macip S., Li X., Wilson P.D., Gusella G.L. Stable knockdown of polycystin-1 confers integrin-α2β1-mediated anoikis resistance. J. Am. Soc. Nephrol. 2006;17:3049–3058. doi: 10.1681/ASN.2006030234. [DOI] [PubMed] [Google Scholar]
- 25.Kim H., Bae Y., Jeong W., Ahn C., Kang S. Depletion of PKD1 by an antisense oligodeoxynucleotide induces premature G1/S-phase transition. Eur. J. Hum. Genet. 2004;12:433–440. doi: 10.1038/sj.ejhg.5201136. [DOI] [PubMed] [Google Scholar]
- 26.Li X., Luo Y., Starremans P.G., McNamara C.A., Pei Y., Zhou J. Polycystin-1 and polycystin-2 regulate the cell cycle through the helix-loop-helix inhibitor Id2. Nat. Cell. Biol. 2005;7:1202–1212. doi: 10.1038/ncb1326. [DOI] [PubMed] [Google Scholar]
- 27.Boletta A., Qian F., Onuchic L.F., Bhunia A.K., Phakdeekitcharoen B., Hanaoka K., Guggino W., Monaco L., Germino G.G. Polycystin-1, the gene product of PKD1, induces resistance to apoptosis and spontaneous tubulogenesis in MDCK cells. Mol. Cell. 2000;6:1267–1273. doi: 10.1016/s1097-2765(00)00123-4. [DOI] [PubMed] [Google Scholar]
- 28.Hanaoka K., Qian F., Boletta A., Bhunia A.K., Piontek K., Tsiokas L., Sukhatme V.P., Guggino W.B., Germino G.G. Co-assembly of polycystin-1 and -2 produces unique cation-permeable currents. Nature. 2000;408:990–994. doi: 10.1038/35050128. [DOI] [PubMed] [Google Scholar]
- 29.Bhunia A.K., Piontek K., Boletta A., Liu L., Qian F., Xu P.N., Germino F.J., Germino G.G. PKD1 induces p21(waf1) and regulation of the cell cycle via direct activation of the JAK-STAT signaling pathway in a process requiring PKD2. Cell. 2002;109:157–168. doi: 10.1016/s0092-8674(02)00716-x. [DOI] [PubMed] [Google Scholar]
- 30.Heim S., Mandahl N., Mitelman F. Genetic convergence and divergence in tumor progression. Cancer Res. 1988;48:5911–5916. [PubMed] [Google Scholar]
- 31.Doxsey S., McCollum D., Theurkauf W. Centrosomes in cellular regulation. Annu. Rev. Cell Dev. Biol. 2005;21:411–434. doi: 10.1146/annurev.cellbio.21.122303.120418. [DOI] [PubMed] [Google Scholar]
- 32.Castedo M., Perfettini J.L., Roumier T., Andreau K., Medema R., Kroemer G. Cell death by mitotic catastrophe: a molecular definition. Oncogene. 2004;23:2825–2837. doi: 10.1038/sj.onc.1207528. [DOI] [PubMed] [Google Scholar]
- 33.Castedo M., Perfettini J.L., Roumier T., Valent A., Raslova H., Yakushijin K., Horne D., Feunteun J., Lenoir G., Medema R., et al. Mitotic catastrophe constitutes a special case of apoptosis whose suppression entails aneuploidy. Oncogene. 2004;23:4362–4370. doi: 10.1038/sj.onc.1207572. [DOI] [PubMed] [Google Scholar]
- 34.Shibazaki S., Yu Z., Nishio S., Tian X., Thomson R.B., Mitobe M., Louvi A., Velazquez H., Ishibe S., Cantley L.G., et al. Cyst formation and activation of the extracellular regulated kinase pathway after kidney specific inactivation of Pkd1. Hum. Mol. Genet. 2008;17:1505–1516. doi: 10.1093/hmg/ddn039. [DOI] [PMC free article] [PubMed] [Google Scholar]
- 35.Weaver B.A., Silk A.D., Montagna C., Verdier-Pinard P., Cleveland D.W. Aneuploidy acts both oncogenically and as a tumor suppressor. Cancer Cell. 2007;11:25–36. doi: 10.1016/j.ccr.2006.12.003. [DOI] [PubMed] [Google Scholar]
- 36.Draper J.S., Smith K., Gokhale P., Moore H.D., Maltby E., Johnson J., Meisner L., Zwaka T.P., Thomson J.A., Andrews P.W. Recurrent gain of chromosomes 17q and 12 in cultured human embryonic stem cells. Nat. Biotechnol. 2004;22:53–54. doi: 10.1038/nbt922. [DOI] [PubMed] [Google Scholar]
- 37.Zhang Q., Taulman P.D., Yoder B.K. Cystic kidney diseases: all roads lead to the cilium. Physiology (Bethesda) 2004;19:225–230. doi: 10.1152/physiol.00003.2004. [DOI] [PubMed] [Google Scholar]
- 38.Badano J.L., Teslovich T.M., Katsanis N. The centrosome in human genetic disease. Nat. Rev. Genet. 2005;6:194–205. doi: 10.1038/nrg1557. [DOI] [PubMed] [Google Scholar]
- 39.Yoder B.K., Hou X., Guay-Woodford L.M. The polycystic kidney disease proteins, polycystin-1, polycystin-2, polaris, and cystin, are co-localized in renal cilia. J. Am. Soc. Nephrol. 2002;13:2508–2516. doi: 10.1097/01.asn.0000029587.47950.25. [DOI] [PubMed] [Google Scholar]
- 40.Iomini C., Tejada K., Mo W., Vaananen H., Piperno G. Primary cilia of human endothelial cells disassemble under laminar shear stress. J. Cell Biol. 2004;164:811–817. doi: 10.1083/jcb.200312133. [DOI] [PMC free article] [PubMed] [Google Scholar]
- 41.Fischer E., Legue E., Doyen A., Nato F., Nicolas J.F., Torres V., Yaniv M., Pontoglio M. Defective planar cell polarity in polycystic kidney disease. Nat. Genet. 2006;38:21–23. doi: 10.1038/ng1701. [DOI] [PubMed] [Google Scholar]
- 42.Chiba S., Okuda M., Mussman J.G., Fukasawa K. Genomic convergence and suppression of centrosome hyperamplification in primary p53−/− cells in prolonged culture. Exp. Cell Res. 2000;258:310–321. doi: 10.1006/excr.2000.4916. [DOI] [PubMed] [Google Scholar]
- 43.Nigg E.A. Origins and consequences of centrosome aberrations in human cancers. Int. J. Cancer. 2006;119:2717–2723. doi: 10.1002/ijc.22245. [DOI] [PubMed] [Google Scholar]
- 44.Svartman M., Stone G., Stanyon R. Molecular cytogenetics discards polyploidy in mammals. Genomics. 2005;85:425–430. doi: 10.1016/j.ygeno.2004.12.004. [DOI] [PubMed] [Google Scholar]
- 45.Thorpe P.H., Gonzalez-Barrera S., Rothstein R. More is not always better: the genetic constraints of polyploidy. Trends Genet. 2007;23:263–266. doi: 10.1016/j.tig.2007.03.016. [DOI] [PubMed] [Google Scholar]
- 46.Qian F., Germino G.G. ‘Mistakes happen’: somatic mutation and disease. Am. J. Hum. Genet. 1997;61:1000–1005. doi: 10.1086/301618. [DOI] [PMC free article] [PubMed] [Google Scholar]
- 47.Harris P.C., Bae K.T., Rossetti S., Torres V.E., Grantham J.J., Chapman A.B., Guay-Woodford L.M., King B.F., Wetzel L.H., Baumgarten D.A., et al. Cyst number but not the rate of cystic growth is associated with the mutated gene in autosomal dominant polycystic kidney disease. J. Am. Soc. Nephrol. 2006;17:3013–3019. doi: 10.1681/ASN.2006080835. [DOI] [PubMed] [Google Scholar]
- 48.D'Assoro A.B., Barrett S.L., Folk C., Negron V.C., Boeneman K., Busby R., Whitehead C., Stivala F., Lingle W.L., Salisbury J.L. Amplified centrosomes in breast cancer: a potential indicator of tumor aggressiveness. Breast Cancer Res. Treat. 2002;75:25–34. doi: 10.1023/a:1016550619925. [DOI] [PubMed] [Google Scholar]
- 49.Shillingford J.M., Murcia N.S., Larson C.H., Low S.H., Hedgepeth R., Brown N., Flask C.A., Novick A.C., Goldfarb D.A., Kramer-Zucker A., et al. The mTOR pathway is regulated by polycystin-1, and its inhibition reverses renal cystogenesis in polycystic kidney disease. Proc. Natl. Acad. Sci. USA. 2006;103:5466–5471. doi: 10.1073/pnas.0509694103. [DOI] [PMC free article] [PubMed] [Google Scholar]
- 50.Wang X., Gattone V., II, Harris P.C., Torres V.E. Effectiveness of vasopressin V2 receptor antagonists OPC-31260 and OPC-41061 on polycystic kidney disease development in the PCK rat. J. Am. Soc. Nephrol. 2005;16:846–851. doi: 10.1681/ASN.2004121090. [DOI] [PubMed] [Google Scholar]
- 51.Gattone V.H., II, Wang X., Harris P.C., Torres V.E. Inhibition of renal cystic disease development and progression by a vasopressin V2 receptor antagonist. Nat. Med. 2003;9:1323–1326. doi: 10.1038/nm935. [DOI] [PubMed] [Google Scholar]
- 52.Bukanov N.O., Smith L.A., Klinger K.W., Ledbetter S.R., Ibraghimov-Beskrovnaya O. Long-lasting arrest of murine polycystic kidney disease with CDK inhibitor roscovitine. Nature. 2006;444:949–952. doi: 10.1038/nature05348. [DOI] [PubMed] [Google Scholar]
- 53.Sweeney W.E., Jr, Hamahira K., Sweeney J., Garcia-Gatrell M., Frost P., Avner E.D. Combination treatment of PKD utilizing dual inhibition of EGF-receptor activity and ligand bioavailability. Kidney Int. 2003;64:1310–1319. doi: 10.1046/j.1523-1755.2003.00232.x. [DOI] [PubMed] [Google Scholar]
- 54.Tao Y., Kim J., Schrier R.W., Edelstein C.L. Rapamycin markedly slows disease progression in a rat model of polycystic kidney disease. J. Am. Soc. Nephrol. 2005;16:46–51. doi: 10.1681/ASN.2004080660. [DOI] [PubMed] [Google Scholar]
- 55.Germino G.G. Autosomal dominant polycystic kidney disease: a two-hit model. Hosp. Pract. (Off. Ed). 1997;32:81–82. doi: 10.1080/21548331.1997.11443444. 85–88, 91–82 passim. [DOI] [PubMed] [Google Scholar]
- 56.Lantinga-van Leeuwen I.S., Dauwerse J.G., Baelde H.J., Leonhard W.N., van de Wal A., Ward C.J., Verbeek S., Deruiter M.C., Breuning M.H., de Heer E., et al. Lowering of Pkd1 expression is sufficient to cause polycystic kidney disease. Hum. Mol. Genet. 2004;13:3069–3077. doi: 10.1093/hmg/ddh336. [DOI] [PubMed] [Google Scholar]
- 57.Jiang S.T., Chiou Y.Y., Wang E., Lin H.K., Lin Y.T., Chi Y.C., Wang C.K., Tang M.J., Li H. Defining a link with autosomal-dominant polycystic kidney disease in mice with congenitally low expression of Pkd1. Am. J. Pathol. 2006;168:205–220. doi: 10.2353/ajpath.2006.050342. [DOI] [PMC free article] [PubMed] [Google Scholar]
- 58.Baert L. Hereditary polycystic kidney disease (adult form): a microdissection study of two cases at an early stage of the disease. Kidney Int. 1978;13:519–525. doi: 10.1038/ki.1978.75. [DOI] [PubMed] [Google Scholar]
- 59.Nadasdy T., Laszik Z., Lajoie G., Blick K.E., Wheeler D.E., Silva F.G. Proliferative activity of cyst epithelium in human renal cystic diseases. J. Am. Soc. Nephrol. 1995;5:1462–1468. doi: 10.1681/ASN.V571462. [DOI] [PubMed] [Google Scholar]
- 60.Sutters M. The pathogenesis of autosomal dominant polycystic kidney disease. Nephron Exp. Nephrol. 2006;103:e149–e155. doi: 10.1159/000093216. [DOI] [PubMed] [Google Scholar]
- 61.Fedorova E., Battini L., Prakash-Cheng A., Marras D., Gusella G.L. Lentiviral gene delivery to CNS by spinal intrathecal administration to neonatal mice. J. Gene Med. 2006;8:414–424. doi: 10.1002/jgm.861. [DOI] [PubMed] [Google Scholar]
- 62.Chae S.W., Cho E.Y., Park M.S., Lee K.B., Kim H., Kim U. Polycystin-1 expression in fetal, adult and autosomal dominant polycystic kidney. J. Korean Med. Sci. 2006;21:425–429. doi: 10.3346/jkms.2006.21.3.425. [DOI] [PMC free article] [PubMed] [Google Scholar]
Associated Data
This section collects any data citations, data availability statements, or supplementary materials included in this article.