Abstract
This paper proposes an efficient array beam-forming method using spatial matched filtering (SMF) for ultrasonic imaging. In the proposed method, ultrasonic waves are transmitted from an array subaperture with fixed transmit focus as in conventional array imaging. At receive, radio frequency echo signals from each receive channel are passed through a spatial matched filter that is constructed based on the system transmit-receive spatial impulse response. The filtered echo signals are then summed without time delays. The filter concentrates and spatially registers the echo energy from each element so that the pulse-echo impulse response of the summed output is focused with acceptably low side lobes. Analytical beam pattern analysis and simulation results using a linear array show that this spatial filtering method can improve lateral resolution and contrast-to-noise ratio as compared with conventional dynamic receive focusing (DRF) methods. Experimental results with a linear array are consistent but point out the need to address additional practical issues. Spatial filtering is equivalent to synthetic aperture methods that dynamically focus on both transmit and receive throughout the field of view. In one common example of phase aberrations, the SMF method was degraded to a degree comparable to conventional DRF methods.
I. INTRODUCTION
The goal of ultrasonic pulse-echo beam forming is to focus all the available acoustic energy at each point in the imaging field.1 Conventional beam formers currently used in array systems apply separate focusing methods during pulse transmission and echo reception. The focal length and aperture size during transmission generate point spread functions that vary with tissue depth. Launching M pulses for each line of site allows focusing at M depths at the cost of a proportional reduction in frame rate. To keep frame rates high, the transmission f number (ratio of focal length to aperture size) is often set relatively large to maximize the depth of focus.
Conversely, on receive, the focal length and active aperture size are varied dynamically (dynamic-receive focusing2 or DRF) to focus the received beam at each depth with a relatively constant f number. The pulse-echo cross-range resolution, however, is determined by the product of the transmitted and received beamwidths, so the pulse-echo point spread function from DRF beam forming is most compact near the transmit focal length and thus remains time varying for real-time imaging. Ideal improvements in beam forming require methods able to uniformly focus both transmit and receive beams at all depths without significantly lowering frame rate or echo signal-to-noise ratio (eSNR).
One solution is synthetic aperture (SA) imaging.3,4 SA imaging is a label that defines a family of techniques each designed to provide uniformly high spatial resolution, but frequently at the cost of side-lobe growth, reduced eSNR, and/or frame rate. For example, pulses can be transmitted from a source element smaller than the wavelength that is scanned across the large aperture area to be synthesized. Following transmission, echoes are recorded, time delayed, and coherently summed. The pulse-echo point spread function from this SA method in effect corresponds to focusing on both transmit and receive. Unfortunately, tissue or transducer movements occurring during SA acquisition generate phase distortions, thus producing beam-forming errors that widen the beam and degrade image quality. Receive aperture sizes can be varied to speed acquisition time and reduce system complexity but with diminished performance.5 Alternatively motion compensation has been applied,6,7 but at the costs of greater computational load and lower frame rate.
Another beam-forming solution involves spatial filtering of the echo signals. In one technique, transmit and receive foci are both fixed. Focusing is achieved by Wiener filtering the beam-formed rf echo signals in two dimensions, where the filter is constructed from prior knowledge of the pulse-echo point spread function and noise properties.8 Under limited conditions, this approach is ideal for detecting large, low-contrast targets provided the impulse response and noise properties are known.9 Spatial filtering has also been applied in SA methods for deconvolving finite-sized subapertures to improve spatial resolution, sensitivity, and frame rate,10 and to design voltage signals applied to array elements during transmission that improve focusing in aberrating media.11 Still others have suggested echo filtering methods for beam forming in combination with coded-pulse transmission or SA-type acquisition schemes.12,13
In this context, our goal is to explore beam-forming strategies that are efficient in terms of computational and hardware requirements and robust, and to evaluate them through comparison with conventional methods. We propose a large-aperture, fixed-focus technique for pulse transmission in which rf echo signals are matched filtered by the pulse-echo point spread function and summed. This spatial matched filtering (SMF) approach to beam forming yields a lateral resolution equivalent to common SA methods for one-dimensional (1D) arrays. In addition, eSNR is superior to conventional DRF methods although axial resolution is somewhat compromised. We show that spatial matched filtering of individual receive-element signals has the potential to generate significantly lower side lobes than does filtering beam-formed echo signals, although practical issues for lD arrays lead us to prefer filtering of beam-formed echoes. Also the effects of phase aberrations on lesion visibility appear no worse than those for DRF methods at least for one situation. Spatial filtering offers the additional advantage of not requiring delay circuits in the beam former, which simplifies the stringent hardware requirements for imaging with arrays particularly at high frequencies. Conditions under which the SMF method offers an efficient beam-forming solution are discussed.
This paper is organized as follows. Section II describes SMF beam forming in the context of classical Fourier optics. Section III summarizes our simulation results using linear array transducer and Field II to verify predicted performance. Also, experimental results using Siemens Antares scanner and phantom are presented. Finally, the paper concludes in Sec. IV.
II. METHODS AND ANALYSIS
A. Continuous-wave fields
To compare the proposed SMF method with the conventional DRF beam former, we briefly review standard expressions for complex fields from a continuous-wave (CW) radiator that guide focusing strategies.
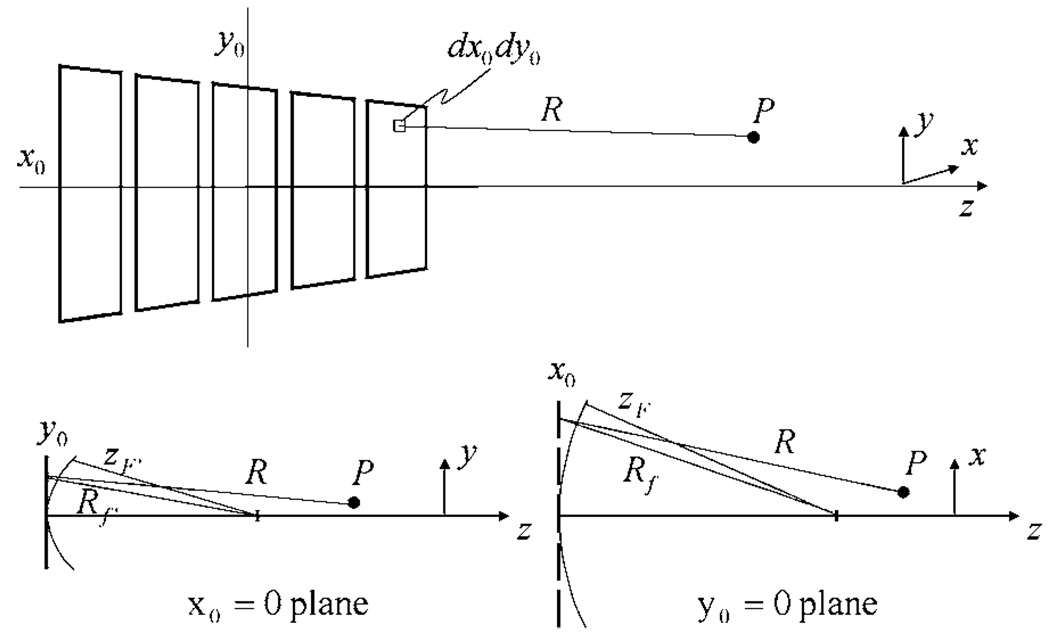
Figure 1 illustrates a standard 3D geometry for describing pressure profiles from a planar, rectangular aperture of a 1D array transducer. The coordinates on the array surface are (x0, y0) while those in the measurement field are (x, y, z), such that is the distance from the transmit aperture surface at(x0, y0) to the field point P. The Rayleigh-Sommerfeld diffraction formula at wavelength λ and wave-number k = 2π/λ gives the following expression for the complex field14 transmitted at radial temporal frequency ω = kc, where c is the speed of sound
| (1a) |
CW pressure pω is related to the complex field φω via
| (1b) |
where Re{·} is the real part of the argument and Q(ω) is the complex pressure amplitude. The subscript ω indicates that the function applies to a single frequency value.
FIG. 1.
The geometry of the beam pattern analysis is illustrated.
Factors ejkR/R and z/R in Eq. (1a) are the Green’s function and obliquity factor, respectively.14 Limiting our attention to field points near the z axis, we approximate
| (2) |
which allows us to expand and simplify Eq. (1a)
| (3) |
It is well known that the objective of focusing when imaging under the Fresnel approximation is to eliminate the quadratic phase factor in Eq. (3). Success achieves diffraction-limited cross-range resolution,15 where the field pattern is given by the spatial Fourier transform of the transmit aperture function.
A conventional delay-and-sum beam former1 uses the geometry of Eq. (3) to calculate the time delays that focus the CW field. Focusing is equivalent to multiplying by the phase factor exp[−jk(Rf−zF+Rf′−zF′)], where zF (see Fig. 1) and zF′ are the radii of curvature along the lateral x0 and elevational y0 axes, respectively. Also and are the distances from points on the aperture to the corresponding radius of curvature in the y 0 = 0 and x 0 = 0 planes, respectively. Applying the paraxial approximation to the focusing phase factor, as in Eq. (2), yields , so that Eq. (3) becomes
| (4) |
where β = 1/2z − 1/2zF and β′ = 1/2z − 1/2zF′. We also assumed separability of the transmit aperture function to write at(x0, y0) = at(x0)at(y0).
B-mode imaging for 1D arrays occurs in the x, z plane at y = 0. Consequently
| (5) |
The z dependence of Cω reminds us that a fixed elevational focus from a 1D linear array gives a depth dependent point spread function regardless of scan plane focusing. In the focal region, z ≅ zF implies β ≅ 0 and therefore the field in Eq. (5) is simply the spatial Fourier transform of the aperture function
| (6) |
where At(ux) = ℑ{at(x0)}ux=x/λz is shorthand for the spatial Fourier transform of the transmit aperture function at. It is evaluated at spatial frequency ux, which is a function of lateral field position x. Finally, from Eq. (1b), a band-limited pressure pulse in the scan plane with bandwidth Ω is given by
| (7) |
B. Conventional delay-and-sum beam forming
Assume we transmit a broadband, focused acoustic pulse at one focal length. We then receive echoes on each array element that are delayed and summed assuming an ideal, in-plane, dynamic-receive focusing (DRF) technique with fixed f number. This focusing is ideal in the sense that the in-plane radius of curvature zF(z) and in-plane receive aperture ar(x0, z) are continuously varied such that ar(x0, z)/zF(z) and the received field are both relatively constant with depth. Equation (5) applies to both transmit and receive apertures because of the principle of reciprocity.16 The pulse-echo field at frequency ω, ψω, is the product of the transmitted φω and received fields. For a conventional beam former, we find from Eq. (5) and Eq. (6) that
| (8) |
where Ar(ux, z) = ℑ{ar(x0, z)}ux=x/λz is the spatial Fourier transform of the receive aperture function that varies with depth. Equation (8) is the narrowband pulse-echo field at y=0 for a conventional beam former; it is our standard for comparison. If the transmit-receive apertures have equal length in the scan plane at(x0) = ar(x0) = a(x0), and the transducer is weakly focused in elevation, e.g., a(y0)/zF′ for a f number of 4, the best lateral resolution is obtained at the transmit focal length z=zF, where β=0. From Eq. (8) we see that
| (9) |
The goal of the SMF beam former is to efficiently obtain the field in Eq. (9) for all z while compromising eSNR and contrast resolution as little as possible.
C. Spatial matched filtering (SMF)
1. Filtering before summing
The above equations and Fig. 1 may also be used to explain and analyze the SMF beam former. In this section, we filter receive-channel echoes individually before summation. A focused array aperture at(x0, y0) transmits sinusoids at frequency ω. Echoes are received by individual array elements located at x0=xr. If the element width along x is smaller than the wavelength, each receive aperture may be approximated by ar(x0, y0) = δ(x0−xr)ar(y 0). From Eq. (5), the pulse-echo field from the array element at xr becomes
| (10) |
We now matched filter the receive fields along the x axis with Eq. (10) evaluated at the corresponding value of xr. The corresponding pulse-echo point spread function for this SMF beam former is the convolution of ψω with its complex conjugate along the x axis
| (11) |
where represents the spatial Fourier transform of the squared transmit aperture function. Equation (11) clearly shows that spatial matched filtering eliminates the quadratic phase factor from the transmit aperture, and therefore it is a method for focusing the transmitted beam at all depth if we know ψω accurately.
The final step is to sum the outputs of the filtered fields weighted by the square of the receive aperture
| (12) |
where we have set at(x) = ar(x, z) = a(x). ψ̄ω,S is the pulse-echo field for the SMF beam former where the echoes are filtered before being summed.
Examination of Eq. (8) and Eq. (12) allows us to compare conventional DRF and SMF beam formers. SMF is able to focus at all depths and not just at the transmit focal length. Also SMF does not require application of echo delays before summing. However, both advantages are only realized if the shift-varying point spread functions ψω(x, z; xr) are known accurately for all depths z and for each receive array element at xr. Similarly, the focusing geometry that applies to the DRF beam former must also be known. Geometric or filtering errors will increase side lobes energy and the main lobe width in either beam former. Consequently Eq. (8) and Eq. (12) are both idealizations that require experimentation to evaluate relative performances under realistic conditions.
2. Filtering after summing
Implementation of the SMF method is much simpler if it is possible to filter just once after summing all the receiver channel outputs. From Eq. (5), where we assume a fixed focal geometry that is equal on transmission and reception, we have
If we now spatially matched filter Eq. (13) in the manner of Eq. (11) we find
| (14) |
where ψ̿ω,S is the pulse-echo field for the SMF beam former where the echoes are filtered after being summed, and A(4)(2ux) = ℑ{a4(x)}2ux = 2x/λz is the spatial Fourier transform of the fourth power of the aperture function. Let us compare Eq. (9), Eq. (12), and Eq. (14). It is significant that the spatial frequency in Eq. (14) is scaled by a factor of 2 compared with Eq. (9) and Eq. (12). The factor of 2 means that the SMF applied to beam-formed echo data Eq. (14) has a narrower main lobe, like synthetic aperture focusing techniques.5 However it also produces relatively higher-amplitude side-lobe levels because the pulse-echo point spread function depends on the one-way focused beam pattern; i.e., A is to the first power in Eq. (14) and it is squared in Eq. (9) and Eq. (12). These feature combinations may be considered strengths or weaknesses depending on if the application is resolution or contrast limited.
Finally, introducing a linear-array aperture function we obtain results that permit comparisons with other techniques found in the literature.5 For rectangular transmit-receive apertures of equal area and unit amplitude, where the array has 2N+1 elements each of area wx × wy that are separated by a distance d along the x axis, we have
| (15) |
From Eq. (12), the lateral pulse-echo point spread function for SMF before summing is
| (16) |
where sinc(x) = sin(πx)/πx. The methods can be compared at the transmit focal length as follows. From Eq. (9), we find ψω,C(x, zF) for the DRF method is also given by Eq. (16) except that is replaced by . Applying the same rectangular array of Eq. (15) to Eq. (14) also results in Eq. (16) for ψ̿ω,S(x, z), except that the squared terms are to the first power on the right side of the equation and x is replaced by 2x.
To simplify the equations and concentrate on lateral resolution assessment, the main results summarized in Eq. (8), Eq. (12), and Eq. (14) are expressed as narrow-band complex fields, which are not directly measurable. Conversions from complex fields to broadband echo signal voltages1,17 involve computation of the time-varying force on the transducer aperture surface from the pressure field Eq. (1b) scattered from a point reflector followed by a weighted integration over the transducer bandpass. The process produces a product of the transmit-receive lateral field patterns as shown in Eq. (8) and a convolution in time, which means the pulse-echo impulse response is longer in duration than the transmitted pulse. To form a beam using a frame of echo signals, we apply a 2D spatiotemporal matched filter.18 For example, if g(t, x) is the broadband rf echo signal from a scattering medium using a system with impulse response h(t, x) and y(t, x) is echo signal output from the spatiotemporal filter, we have y(t, x) = h(−t, −x)*g(t, x). Although the filter focuses the beam along the x axis as shown in Eq. (12) and Eq. (14) above, it also lengthens the duration of the temporal impulse response. For a Gaussian-shaped pulse, axial resolution is reduced because the effective pulse length increases by a factor of using filtering as compared with conventional DRF methods.
III. SIMULATION AND EXPERIMENTAL RESULTS
The above predictions of beam-former performances were validated using rf echo simulations from Field II (Ref. 19) for a broadband linear array transducer. The center frequency of the Gabor pulse transmitted was 10 MHz, and the −6 dB bandwidth was 7 MHz. The array element pitch was chosen to be d=0.20 mm, elements were wy = 5 mm long in elevation, and the transmit foci are fixed at zF=40 mm and for all data processed with DRF and SMF techniques. Ninety-six transmit-receive channels were used so that the apertures were fixed in area (no aperture growth) and equal to 19.2 mm × 5 mm.
In the following results, “DRF-focus” beam plots describe patterns obtained when transmit and receive apertures are both focused at the center of the image field, either 20, 40, or 60 mm. “DRF” plots describe results for a fixed 40-mm in-plane focal length on transmit; the receive beam is dynamically focused. “SMF” results are from Eq. (12) where zF=40 mm for the fixed transmit and fixed receive focal lengths unless otherwise noted.
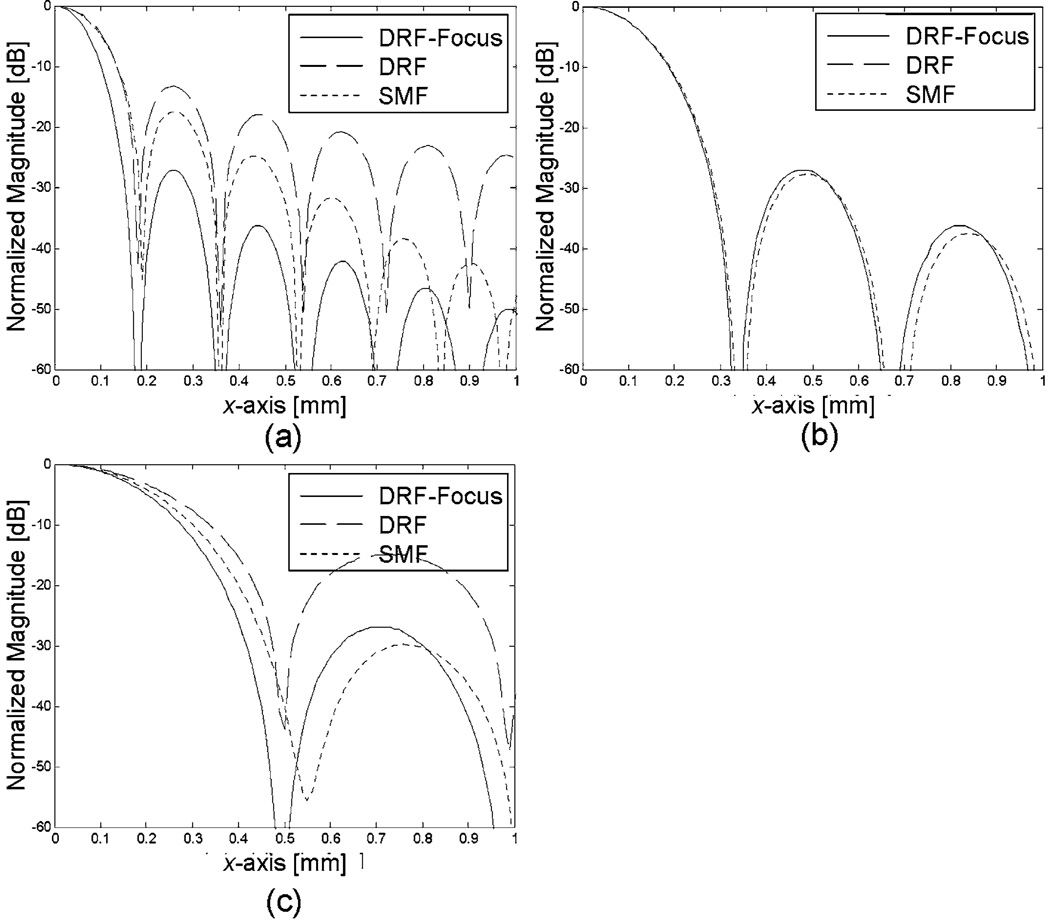
Figure 2 shows CW transmit-receive beam patterns for the DRF-focus, DRF, and SMF beam formers when a point reflector is positioned on axis at 20, 40, and 60 mm depths. These distances are proximal to, at, and distal to the fixed 40-mm transmit focal length of the DRF and SMF methods. For these data, SMF results are from a 1D spatial filter applied along the x0 axis. The three methods have very similar lateral profiles at the transmit focal length [Fig. 2(b)]. The DRF-focus method generates diffraction-limited sinc2 beam patterns at all depths because the beam is focused on both transmit and receive—it is a gold standard for beam forming. Although SMF widens the main lobe and spreads the nulls compared with the DRF-focus [Figs. 2(a) and 2(c)], it also generates side lobes that are lower than those of conventional DRF methods.
FIG. 2.
Comparison of CW, transmit receive, lateral beam patterns for the DRF-focus, DRF, and SMF beam formers for a point reflector placed on axis at (a) 20 mm depth, (b) 40 mm depth, and (c) 60 mm depth. The transmit focus is fixed at 40 mm for the DRF and SMF methods and is refocused at each depth for the DRF-focus method.
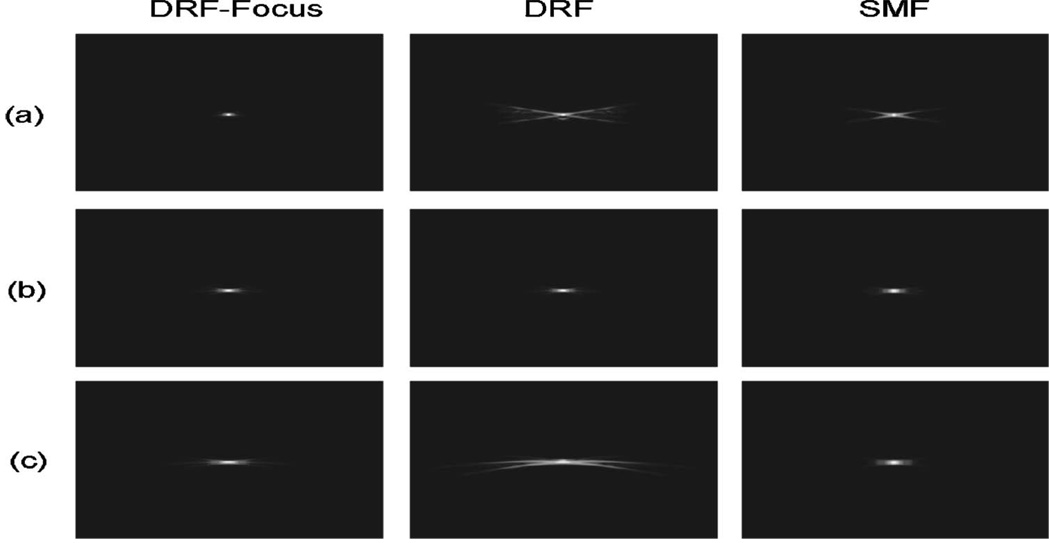
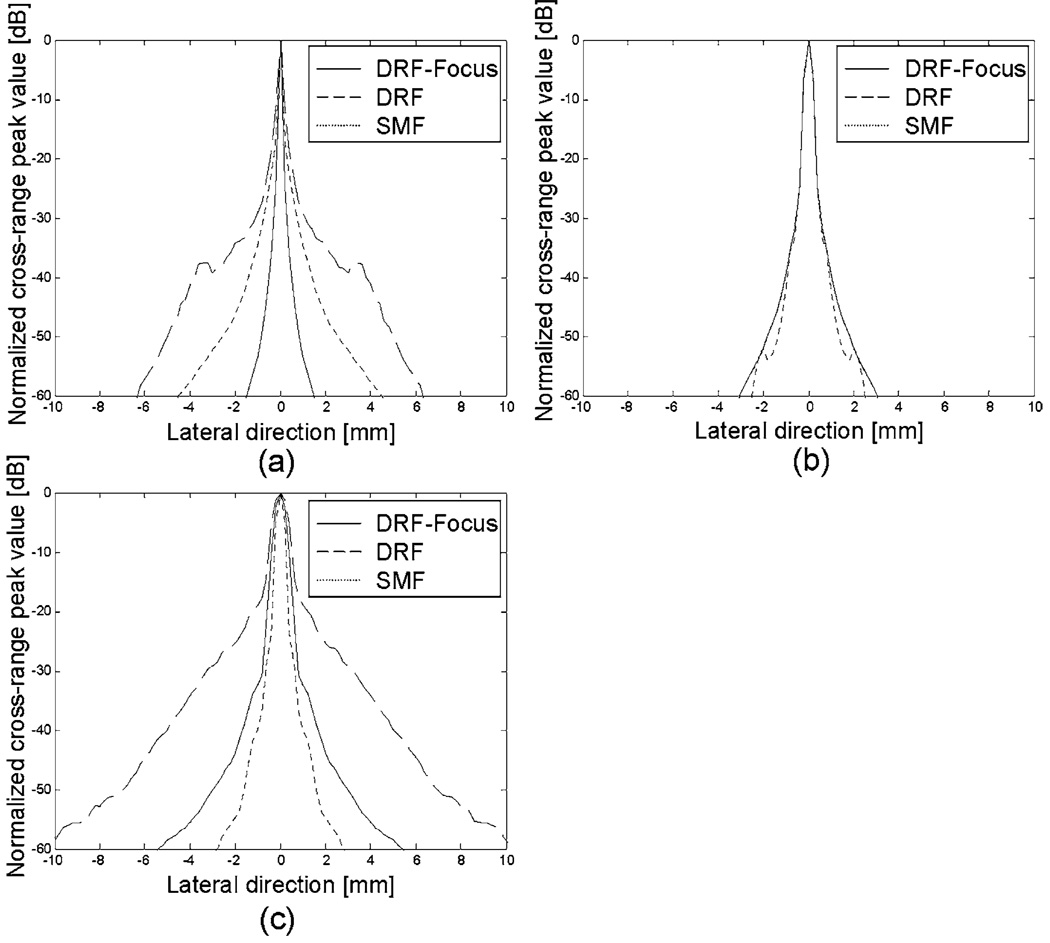
Figure 3 shows broadband, 2D, in-plane, pulse-echo point spread functions for each method. After beam formation, the point spread functions are envelope detected, the amplitudes are normalized to the peak values, log compressed with a dynamic range of 60 dB, and scan converted for display. The SMF results are from a 2D spatial matched filter applied in the x–z plane. Figure 4 shows corresponding lateral beam patterns; however they are not necessarily amplitude values plotted along the x axis for constant z as in Fig. 2. Instead we plot peak amplitude values found at any depth along each axial scan line. Figure 3(a) shows that DRF-focus provides the best broadband lateral resolution in the near field (20 mm) despite the claim of Eq. (12) for narrow band CW beams that diffraction limited resolution is obtained. In the near field, the paraxial approximation breaks down so that Eq. (12) is an optimistic predictor of beamwidth. Nevertheless the broadband pulse energy is more spatially compact with the SMF method compared to the DRF method in the near field. At the transmit focal depth of 40 mm, all lateral beamwidths are comparable and yet there is some loss of axial resolution for the SMF method as expected from 2D filtering. In the far-field (60 mm), the broadband beamwidth for the 2D SMF method is narrowest, unlike the narrow band beam patterns of Fig. 2. It is not that SMF surpasses the diffraction limit; rather the broadband results are not accurately predicted by the simple narrow band equations above. Beam simulations provide more accurate results for comparing broadband beam-forming strategies.
FIG. 3.
Comparison of broadband, pulse echo, 2D point spread functions for the DRF-focus, DRF, and SMF beam formers at (a) 20 mm depth, (b) 40 mm depth, and (c) 60 mm depth. The transmit focus is fixed at 40 mm for the DRF and SMF methods and is refocused at each depth for the DRF-focus method. Images are normalized to the individual peak values and displayed with 60 dB dynamic range.
FIG. 4.
Lateral beam patterns from the broadband pulse-echo point spread functions in Fig. 3.
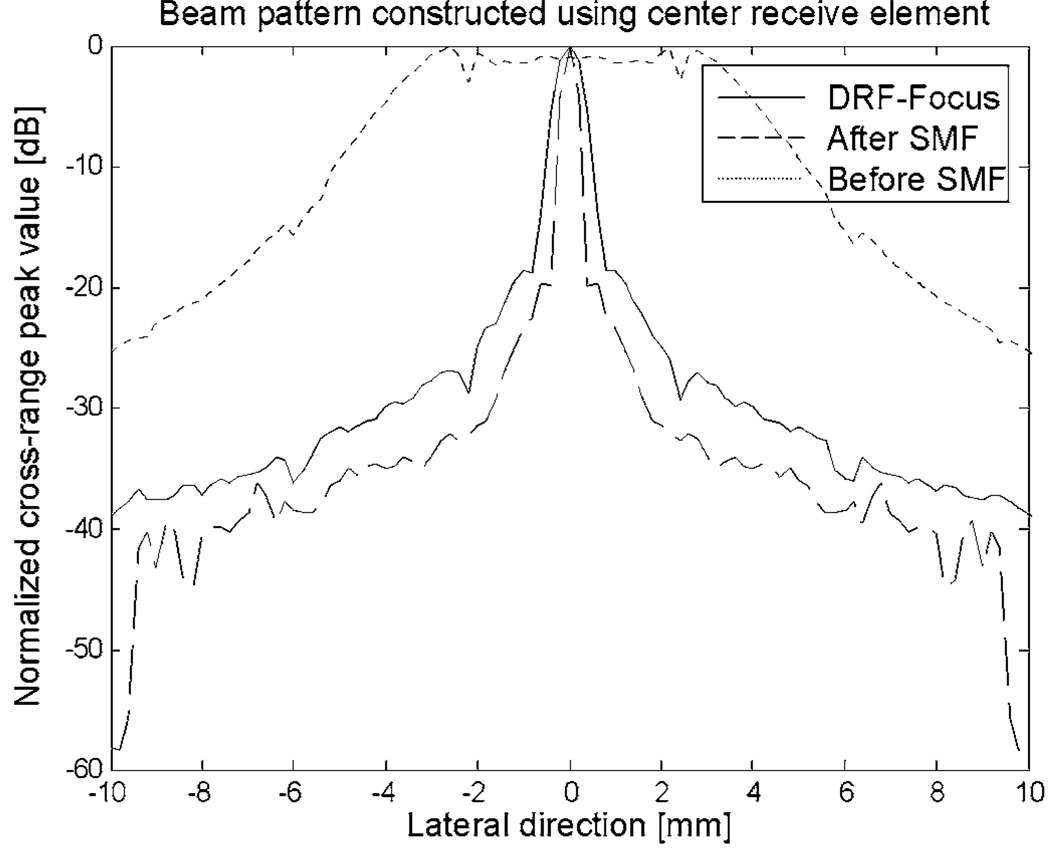
Further insights into the SMF method can be obtained from Fig. 5 and Fig. 6. Figures 5(a) and 5(b) show images of a point reflector placed on the beam axis at 60 mm. The full transmit aperture is activated and focused at 40 mm, but only the center element of the receive aperture is activated. In Fig. 5(a), a B-mode image was formed from the echo signal [Eq. (10)], and in Fig. 5(b), the echo was matched filtered before creating the image [Eq. (11)]. That is, Fig. 5(b) is a 2D autocorrelation of the rf echo signal corresponding to the image in Fig. 5(a). Clearly two effects of filtering are to condense the pulse energy and straighten the phase front. Consequently, when echoes from other receiver elements are also filtered and then summed to form a receive aperture, Eq. (12), the resulting pulse is more focused than a delay-and-sum strategy without filtering. Also, because filtering concentrates echo energy, eSNR is greater for SMF than DRF. Even when the transmit focus is moved from 40 mm to the scatterer position at 60 mm [Fig. 5(c)], the 2D SMF method [Fig. 5(b)] is better able to focus the beam. The effects are more clearly seen using the beam profiles in Fig. 6 that are taken from the data in Fig. 5.
FIG. 5.
B-mode images of a point target placed on the z axis at 60 mm. The full transmit aperture was applied with a fixed, 40-mm focal length but only the center transducer element was used to receive echoes (a). Applying a 2D matched filter to the rf echo signal in (a) results in the image of (b). (c) is the image constructed also from center receive element but where the transmit focus was moved to 60 mm (DRF-focus result).
FIG. 6.
Lateral beam patterns from the broadband pulse echo point spread functions in Fig. 5.
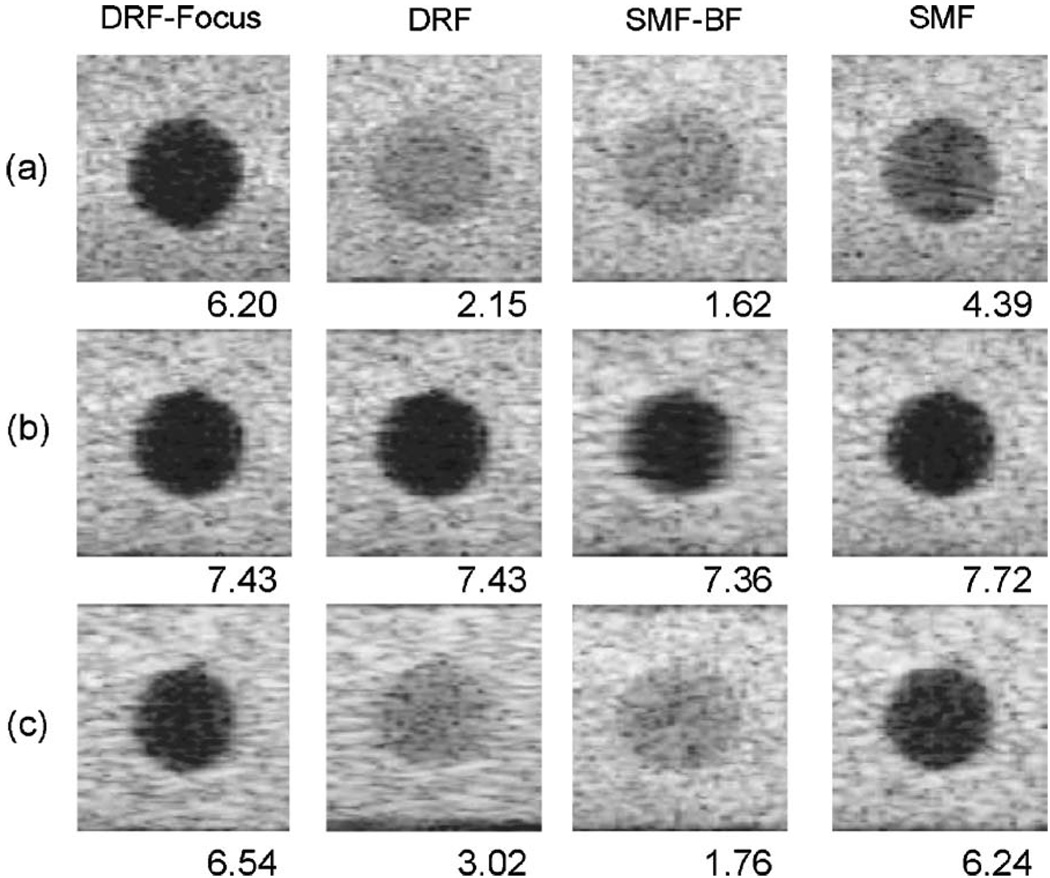
Complete comparisons must extend beyond point reflectors to include scattering fields that generate speckle and have low-contrast targets. Such fields were simulated with Field II for a 2D anechoic target; the results are shown in Fig. 7. Also included are images formed using the spatial matched filter applied after summing receive elements, Eq. (14); these are labeled “SMF-BF.” SMF-BF and DRF images appear to provide comparable target visibility. The SMF (filtering before summing) results are comparable to the gold-standard DRF-focus method at and beyond the focal length. The SMF contrast is degraded in the near field relative to DRF-focus and yet is superior to DRF. Results are consistent with the lateral beam profiles of Fig. 4(a). Contrast-to-noise ratio (CNR) values for the SMF images are superior to DRF everywhere but at the focus where all four methods are comparable. For these conditions, filters constructed from the impulse response at the vertical center of the imaging field apply reasonably well over a depth of focus of approximately 10 mm.
FIG. 7.
The images are from echo simulations of a cyst phantom that were processed using DRF-focus (left panel), DRF (center panel), and SMF (right panel) beam formers. The transmit focus is set to 40 mm for DRF and SMF and is refocused at each depth for the DRF-focus method. The cyst diameter is 4 mm and the medium has a constant speed of sound. All images are displayed with 60 dB dynamic range. Cyst centers are placed at depths of (a) 20 mm, (b) 40 mm, and (c) 60 mm. CNR values appearing in each image are computed using , where 〈Si,o〉 and are the mean and variance of image pixels inside and outside the target.
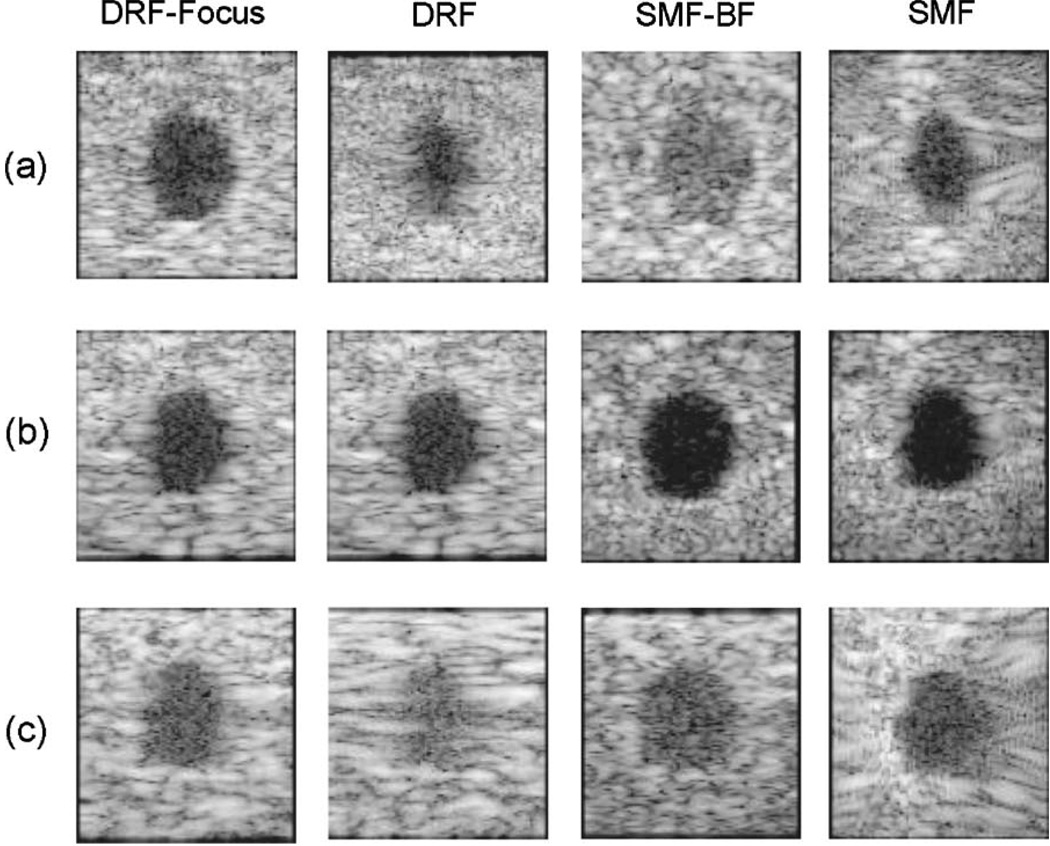
The SMF beam former was implemented experimentally on a standard Siemens Antares system with the ultrasound research interface (URI) feature to acquire beam-formed rf data. Also we applied special software from the manufacturer to control features of the transmit/receive apertures. The sound speed used by the system for beam forming was adjusted to match the ATS™ phantom (Model 539) scanned. RF data were recorded individually from each of the 192 receive channels, and B-mode images were formed and displayed offline (Fig. 8).
FIG. 8.
The images are from pulse-echo experiments of a cyst phantom that were processed using DRF-focus (left column), DRF (center-left column), SMF-BF (center-right column), and SMF (right column) beam formers. The transmit focus is fixed at 20 mm for the DRF SMF-BF, and SMF images. However the transmit beam is repositioned at each depth for the DRF-focus method. The cyst diameter is 4 mm, and all images are logarithmically compressed and displayed with 50 dB dynamic range. Cyst centers are placed at depths of (a) 10 mm, (b) 20 mm, and (c) 30 mm.
The transducer was a 10 MHz (VF10–5) linear array with 0.2 mm element spacing. The lateral image line density was about 10/mm and the transmit focus was fixed at f/2. Figure 8 displays phantom images for the DRF-focus, DRF, SMF-BF, and SMF beam formers when the center of the anechoic region was positioned at 10, 20, and 30 mm depths. The speckle pattern and brightness of the SMF method is nonuniform in this initial experiment because the size and phase steering of the transmit aperture scanned across the array was varied in a way we could not control. Our matched filter only accounted for an axially varying impulse response. In spite of speckle heterogeneities caused by our limited control of the transmit aperture, image contrast for the spatial matched filter applied before or after receive-signal summation was superior to conventional DRF methods.
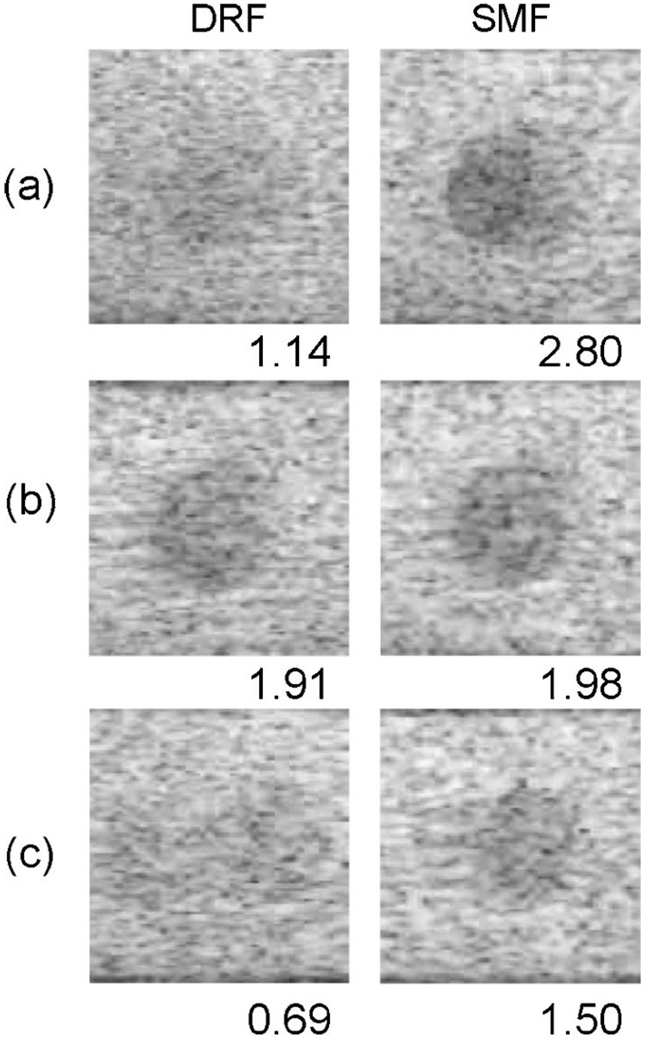
We tested the robustness of SMF relative to DRF in the presence of phase aberrations using Field II simulations for one specific situation. A random phase screen was placed at the aperture surface with a correlation length of 3.6 mm inplane and aberration strength of 34 ns. These parameters are considered typical values for breast tissue.20 Other conditions were set to be the same as those of Fig. 7. The images of Fig. 9 may be directly compared to those in the right two columns of Fig. 7 except the images of Fig. 9 were acquired through the phase screen. Targets imaged through the screen are degraded for both beam formers, more in the far field than in the near field. However, for this specific situation, aberrations do not appear to affect the SMF method any more or less than the DRF method; specifically, SMF continues to provide somewhat better CNR values at all depths.
FIG. 9.
The effects of phase aberration. These images are the same as those in the right two columns of Fig. 7 except that a random phase screen was placed in a plane at the aperture surface. The correlation length of the random phase distortion in the x, y plane is 3.6 mm and the aberration strength is 34 ns.
Table I lists the relative eSNR values for each beamforming method at three depths. eSNR is defined in the scan plane (fixed y) and at a fixed depth z for random point-scattering media and white Gaussian noise as
| (17) |
where and are the object and noise variances, T is the duration of the time series, and h(t, x, y, z) is the spatiotemporal pulse-echo point spread function.17 We fixed the depth at z=20 mm, computed the integrals in Eq. (17), and then selected a value for of 0.311 × 10⁻⁷, which gave us an in-plane eSNR(y, z) = 104(40 dB). Assuming , we computed for these conditions and added the corresponding noise to the simulated rf echo data. Table I gives the measured eSNR values resulting from images simulated for each method. Values in the table are normalized by the value of the DRF-focus beam former at z=20 mm.
TABLE I.
Echo signal-to-noise ratio values (eSNR in decibels) for each beam-forming method. The results are relative to the DRF-focus beam former at 20 mm depth.
| Focus | DRF | SMF-BF | SMF | |
|---|---|---|---|---|
| 20 mm | 0 | −14.43 | −7.52 | +7.91 |
| 40 mm | −24.30 | −24.30 | −15.11 | −14.26 |
| 60 mm | −43.22 | −52.10 | −38.59 | −33.03 |
IV. DISCUSSION AND CONCLUSIONS
As with synthetic aperture methods, SMF effectively focuses both transmit and receive beams. The resulting pulse-echo point spread function yields superior lateral resolution compared to conventional DRF except near the transmit focal length where they are comparable. Table I clearly shows that one advantage of the SMF beam former over the DRF method is a significant increase in eSNR ratio at all depths. The improvement in eSNR results from more effective use of the signal energy by the SMF method.8 Details of each process affect eSNR and relative side lobe energy in addition to spatial resolution, and so the merits of each technique depend on the application.
Also, in terms of implementation, another important difference between conventional delay-sum beam formers and SMF beam formers is that SMF needs shift variant 2D finite impulse response (FIR) filters instead of digital delay circuits. It is well known that current commercial ultrasound systems employ different kinds of (receive) beam-forming methods, for example, interpolation beam former, phase rotator, and partial beam former. These beam formers are implemented efficiently in terms of cost and hardware complexity in different manners by companies. Like conventional delay-sum beam formers, therefore, SMF can also be implemented in many different ways such as in time domain or frequency domain, which are being investigated by the authors.
Other implementation effects are seen by comparing the SMF-BF and SMF results for the simulation in Fig. 7 and the phantom experiment in Fig. 8. As is typically the case in commercial systems, beam properties vary as the aperture scans across the linear array. These effects are not part of the simulations, so it is accurate to assume shift invariance laterally. When impulse response functions used to filter echo data are exact, it is better to filter each receive signal before summing (column SMF in Fig. 7) than to filter echoes summed over the receive aperture (column SMF-BF in Fig. 7). However, when the impulse responses are only known approximately, then it is better to filter echoes after summation (column SMF-BF in Fig. 8) than before summation (column SMF in Fig. 8). Summing before filtering concentrates the acoustic energy so that filter errors are less important. The alternative is to extend the filter bank to form match filters that vary with lateral position as well as axial position, thus increasing the computational load.
We summarize for comparison of beam-forming methods several important imaging features in Table II. Features include the beam width parameter λzF/aperture length, maximum side lobe height, and eSNR. For the DRF-focus and SMF methods, there are N′ = 2N+1 elements that make up the active aperture of the 1D array. We compare these results to those for a synthetic aperture focusing (SAF) method,5 where the single element used to transmit and receive wave forms is scanned sequentially along the x0 axis for the N′ -elements aperture. We also include results for a multielement synthetic phased array (M-SPA) method,5 where a single element is used to transmit while all N′ elements are used on receive. Note that eSNR for the SA and M-SPA methods can vary widely depending on the use of defocusing and coded pulse excitation techniques.5,21
TABLE II.
Performance comparisons for various beam-forming methods.
| Methods | Lateral beam width | Main lobe width (×λzF) |
Max side lobe height (dB) |
eSNR (dB) |
|||
|---|---|---|---|---|---|---|---|
| DRF | DRF-focus |
|
|
−26 | 0 | ||
| SA | SAF |
|
|
−13 | - | ||
| M-SPA |
|
|
−26 | - | |||
| SMF-BF |
|
|
−13 | 13.35 | |||
| SMF |
|
|
−26 | 20.63 |
Compared to the DRF-focus standard method, the M-SPA and SMF [before summing, Eq. (12)] methods provide equivalent beam properties but over the entire depth of field and with greater eSNR. Lateral resolution is improved with SAF and SMF-BF [after summing, Eq. (14)] but at the cost of higher amplitude side lobes and relatively lower eSNR. The best choice of method depends on the application. For example, to view small, high contrast targets such as calcified plaques or microcalcifications, high lateral resolution methods are desired for spatial-resolution-limited conditions. Conversely, to differentiate cystic voids from hypoechoic tumors, low side lobes and high eSNR are desired for these contrast-resolution-limited conditions. SMF methods have an advantage over SA techniques in that the data are acquired in parallel, thus minimizing motion artifacts.
Finally we point out that Table II results are for SMF methods that assume a rectangular aperture without apodization. For shift-varying point spread functions the single match filter is replaced by a filter bank to account for depth dependence and minimize side lobes from mismatched filters. To minimize the number of filters in the bank or to reduce aberrating effects, one might be tempted to minimize side lobes by apodization. However, Eq. (12) and Eq. (14) show that apodization will also significantly reduce lateral resolution because the beam profile is given by the aperture function raised to a power.
Above all, to maximize the performance of SMF beamformers, we should be able to estimate system transmit-receive spatial impulse response in different media to form filters. There are various factors affecting filter design such as wave-front distortions (amplitude and phase), frequency dependent attenuation, and nonlinear propagation. These characteristics have been widely studied in the context of beamforming. The performance of SMF beamformers will improve as our ability to adaptively form beams advances.
ACKNOWLEDGMENT
This project was supported in part by the National Institutes of Health, R01 CA082497.
References
- 1.Macovski A. Medical Imaging Systems. Englewood Cliffs, NJ: Prentice-Hall; 1983. [Google Scholar]
- 2.Angelsen BAJ. Ultrasonic Imaging: Waves, Signals, and Signal Processing. Norway: Emantec AS, Trondheim; 2000. [Google Scholar]
- 3.Burckhardt CB, Grandchamp P-A, Hoffmann H. An experimental 2 MHz synthetic aperture sonar system intended for medical use. IEEE Trans. Sonics Ultrason. 1974;SU–21:1–6. [Google Scholar]
- 4.Steinberg BD. Principles of Aperture and Array System Design: Including Random and Adaptive Arrays. NY: Wiley; 1976. [Google Scholar]
- 5.Karaman M, Li P-C, O’Donnell M. Synthetic aperture imaging for small scale systems. IEEE Trans. Ultrason. Ferroelectr. Freq. Control. 1995;42:429–442. [Google Scholar]
- 6.Trahey GE, Nock LF. Synthetic receive aperture imaging with phase correction for motion and for tissue inhomogeneities. Part I: Basic principles. IEEE Trans. Ultrason. Ferroelectr. Freq. Control. 1992;39:489–495. doi: 10.1109/58.148539. [DOI] [PubMed] [Google Scholar]
- 7.Kadah YM, El-Sharkawy AE-M, Youssef A-BM. Navigator echo motion artifact suppression in synthetic aperture ultrasound imaging. IEEE Trans. Biomed. Eng. 2005;52:127–131. doi: 10.1109/TBME.2004.836501. [DOI] [PubMed] [Google Scholar]
- 8.Zemp RJ, Insana MF. Nearfield coding and spatial processing for ultrasonic imaging. Proa-IEEE Ultrason. Symp. 2004:1258–1261. [Google Scholar]
- 9.Zemp RJ, Parry MD, Abbey CK, Insana MF. Detection performance theory for ultrasound imaging systems. IEEE Trans. Med. Imaging. 2005;24:300–310. doi: 10.1109/tmi.2004.841226. [DOI] [PMC free article] [PubMed] [Google Scholar]
- 10.Fredrik Lingvall, Tomas Olofsson, Tadeusz Stepinski. Synthetic aperture imaging using sources with finite aperture: Deconvolution of the spatial impulse response. J. Acoust. Soc. Am. 2003;114:225–234. doi: 10.1121/1.1575746. [DOI] [PubMed] [Google Scholar]
- 11.Tanter M, Aubry J-F, Gerber J, Thomas J-L, Fink M. Optimal focusing by spatio-temporal inverse filter. I. Basic principles. J. Acoust. Soc. Am. 2001;110:37–47. doi: 10.1121/1.1377051. [DOI] [PubMed] [Google Scholar]
- 12.Jensen JA, Gori P. Spatial filters for focusing ultrasound images. Proc.-IEEE Ultrason. Symp. 2001:1507–1511. [Google Scholar]
- 13.Li ML, Li PC. Filter based synthetic transmit and receive focusing. Ultrason. Imaging. 2001;23:73–89. doi: 10.1177/016173460102300201. [DOI] [PubMed] [Google Scholar]
- 14.Goodman JW. Introduction to Fourier Optics. 2nd ed. NY: McGraw-Hill; 1996. [Google Scholar]
- 15.Cross-range spatial resolutions are labeled in rectangular coordinates as lateral (x0) and elevational (y0).
- 16.Pierce AD. Acoustics: An Introduction to Its Physical Principles and Applications. NY: McGraw-Hill; 1981. [Google Scholar]
- 17.Zemp RJ, Abbey CK, Insana MF. Linear system models for ultrasonic imaging: Application to signal statistics. IEEE Trans. Ultrason. Ferroelectr. Freq. Control. 2003;50:642–654. doi: 10.1109/tuffc.2003.1209551. [DOI] [PMC free article] [PubMed] [Google Scholar]
- 18.Liu J, Kim K-S, Insana MF. Beamforming using spatio-temporal filtering. Proc.-IEEE Ultrason. Symp. 2005 [Google Scholar]
- 19.Jensen JA, Svendsen NB. Calculation of pressure fields from arbitrarily shaped, apodized, and excited ultrasound transducers. IEEE Trans. Ultrason. Ferroelectr. Freq. Control. 1992;39:262–267. doi: 10.1109/58.139123. [DOI] [PubMed] [Google Scholar]
- 20.Dahl JJ, Guenther DA, Trahey GE. Adaptive imaging and spatial compounding in the presence of aberration. IEEE Trans. Ultrason. Ferroelectr. Freq. Control. 2005;52:1131–1144. doi: 10.1109/tuffc.2005.1503999. [DOI] [PubMed] [Google Scholar]
- 21.Gammelmark KL, Jensen JA. Multielement synthetic transmit aperture imaging using temporal encoding. IEEE Trans. Med. Imaging. 2003;22:552–563. doi: 10.1109/TMI.2003.809088. [DOI] [PubMed] [Google Scholar]


