

Abstract
Current approaches to study biomaterial mineralization are invasive and prevent dynamic characterization of this process within the same sample. Polarized light scattering spectroscopy (LSS) may offer a non-invasive alternative for assessing the levels of mineraliazation as well as some aspects of the organization of the mineral deposits. Specifically, we used LSS to characterize the formation of hydroxyapatite deposits on three types of silk films (water-annealed, methanol-treated and poly aspartic acid (PAA)-mixed) following 1, 3, 5 and 7 cycles of mineralization. We found that the total light scattering intensity provided a quantitative measure of the degree of mineralization as confirmed by thermal gravimetric analysis (TGA). The PAA-mixed silk films yielded the highest level of mineral deposition and the water-annealed ones the least, consistent with the β sheet content of the films prior to the onset of mineralization. The wavelength dependence of the singly backscattered light was consistent with a self-affine fractal morphology of the deposited films within scales in the range of 150 to 300 nm; this was confirmed by Fourier analysis of scanning electron microscopy (SEM) images of the corresponding films. The deposits of minerals in the water-annealed films were predominantly flake-like, with positively correlated density fluctuations (Hurst parameter, H>0.5), whereas methanol-treated and PAA-mixed silk films resulted in densely-packed, bulk mineral deposits with negatively correlated density fluctuations (H<0.5). Therefore, LSS could serve as a valuable tool for understanding the role of biomaterial properties in mineral formation, and, ultimately, for optimizing biomaterial designs that yield mineral deposits with the desired organization.
Keywords: Silk, Fibroin, Tissue engineering, Polarization, Light scattering
1. Introduction
Nature synthesizes hierarchical, self-assembled, organic/biomineral complex composites under ambient conditions with superior mechanical properties. These composite systems provide a rich ground for insight into mechanisms of biomineralization and novel material design [1]. In general, biomineralization can be divided in two categories: biologically induced mineralization, in which an organism modifies its local microenvironment to establish conditions suitable for the chemical precipitation of extracellular mineral phases, or boundary organized biomineralization, in which inorganic particles are grown within or on a matrix generated by an organism [2, 3]. The biological substances which produce biologically induced mineralization do not strictly control the crystallization process, resulting in mineral particles without unique morphology and with a broad particle size distribution [4]. In contrast, boundary organized biomineralization provides better control over size, morphology and crystallographic orientation of the mineralized particles [5]. The central tenet in the regulation of mineral deposition in biological systems is that organic matrices control the nucleation and growth of the inorganic structure. This control is exerted through the use of organic macromolecules that provide sites of nucleation and dictate crystal orientation and crystal morphology; however, these events are not well characterized.
A better understanding of the mineralization process and crystal formation in biocomposites may provide a way to engineer new types of high performance materials in laboratories. Further, these types of mineralized systems have significant relevance and impact in areas of biomaterials and bone repair/regeneration treatments. These biominerals often have nanoscale crystal morphologies at the beginning, but their orientation, size and shape changes at different stages of mineralization. Scanning electron microscopy (SEM) has been traditionally used as a characterization technique to study the detailed surface topography and crystal morphology of the mineral deposits [6]. However, SEM is an invasive technique, as are most of the other commonly used methods to study mineralized samples, such as X-ray diffraction, X-ray photoelectron spectroscopy (XPS), and transmission electron microscopy (TEM). Therefore, time dependent measurements at different stages of mineralization on the same sample are not possible. Fourier transform infrared (FTIR) spectroscopy is a non-invasive technique and has been used for molecular characterization of the mineralized samples, but it lacks the ability to provide morphological information and its use is limited in samples with high water content. Further, in biomedical imaging for bone formation, micro computed tomography or X-ray analysis are most often used to assess bone density and mineral distribution. These methods are effective for biomaterial and tissue assessments, however, the resolution is lacking to understand fine control of mineralization, and detection levels are not sufficient to assess early stages in the process, such as during tissue remodeling. This approach is also destructive, thus tissues can not be monitored on a real time basis.
Light scattering spectroscopy (LSS) has been used extensively in biomedical research to find small scale morphological changes in human tissues and cells [7–10]. LSS has also been performed in vivo to detect non-invasively changes in nuclear morphology in pre-cancerous lesions in the esophagus, colon, oral cavity, bladder and the cervix [8–10]. This approach relies on the fact that the intensity of the light scattered off of structures that have a different refractive index from their surroundings varies as a function of wavelength and scattering angle in a manner that depends on the size, shape and refractive index of the scatterer. Therefore, we sought to assess the use of LSS as a non-invasive means to characterize the amount and organization of minerals deposited on silk films.
Silk fibroin is a fibrous protein with high mechanical strength and elasticity, which has been used as biomaterial for scaffolds in tissue engineering to produce bone, ligaments and skin in-vitro [11–13]. Unlike native silk fibroin, whose structure includes a high percentage of aligned β sheets and α helices, regenerated silk fibroin adopts a random coil conformation in solution and is intrinsically amorphous when formed into solid materials. A number of processing approaches have been developed to enhance formation of β sheet and α-helical domains in these materials, in order to influence the solubility, biocompatibility, thermal and mechanical properties of the material [14–15]. This can be accomplished by physico-chemical treatment such as application of mechanical forces (stretching, shearing, rolling, spinning or compressing), thermal treatment, and immersion in selected organic solvents such as methanol, which causes dehydration of the hydrated structure, leading to crystallization, i.e. higher β sheet content [16–21]. Silk fibroin protein has been used as an organic macromolecule to regulate mineralization in silk films [22]. It has also been shown that co-processing of the silk with polyaspartic acid leads to an increase in the control and level of mineral deposits on silk fiber mats [6].
In the present work, we examined the use of LSS as a method to assess the progression of mineralization in three different types of silk films (water annealed, methanol treated and poly aspartic acid (PAA) mixed) exhibiting different levels of crystallinity. To gain a better understanding of the origins of the LSS signals, we compared the LSS analysis results with standard thermal techniques and SEM. We demonstrate that LSS may serve as a useful non-invasive tool to assess not only the amount, but also the organization of mineral deposits. Further, it is a technique that can be used at early stages of mineralization, offering early insight in dynamic processes at organic-inorganic interfaces. As such, it offers a novel approach that could result in improved monitoring, understanding and control of biomineralization.
2. Materials and Methods
2.1. Silk Film Preparation
To extract the silk fibroin protein, Bombyx mori silkworm cocoons were boiled for 30 minutes in an aqueous solution of 0.02 M Na2CO3 and rinsed thoroughly with water to extract the glue-like sericin proteins. The extracted silk was then dissolved in 9.3 M LiBr solution at 60°C, yielding a 20% (w/v) solution. This solution was dialyzed in water using Slide-a-Lyzer dialysis cassettes (Pierce, MWCO 3500). The final concentration of aqueous fibroin solution was 8.0% w/v, which was determined by weighing the remaining solid after drying. Pure silk films were cast by pouring the silk fibroin solution into polystyrene petri dishes and allowing it to dry at ambient temperature in a hood for 2 days. To increase the β sheet content, the films were kept in a water-filled vacuumed (less than 10−3 mmHg) desiccator for approximately 24 hours (water-annealed). To further induce β sheet content some films were also immersed in a 90% methanol solution for about 10 hours (methanol-treated). Polyaspartic acid (PAA) films were prepared by adding 0.2% PAA in the aqueous fibroin solution (PAA-mixed). The thickness of all films was approximately 90±5 μm as assessed using a Leica DMIRE2 microscope equipped with a spectral confocal TCS SP2 scanner (Wetzlar, Germany).
For each mineralization cycle the films were kept in a 0.2 M CaCl2 solution for 20 minutes and then allowed to dry at room temperature. Subsequently, the films were moved to a 0.12 M aqueous Na2HPO4 solution for 20 minutes [6]. Di-calcium phosphate (CaHPO4) mineral deposits were formed on the surface of silk fibroin films after each mineralization cycle. Each film was subject to seven mineralization cycles.
2.2. Light Scattering Spectroscopy
The LSS system used in this study has been described in detail previously [23]. Briefly, the set-up acquired the scattering angle- and wavelength-dependent intensity of light scattered in the backward direction. Light in the 450–700 nm region from a 500 watt Xenon lamp was collimated and linearly polarized before illuminating the sample at 45° from the surface normal in order to avoid detecting specular reflections. The backscattered light was detected through an analyzer that was placed either parallel (Ipar) or perpendicular (Iperp) to the polarizer. Singly scattered photons maintained their initial polarization, while multiply scattered photons are depolarized and consist of equal amounts of light polarized along the parallel and perpendicular polarizations. Thus, the differential signal, ΔI = Ipar−Iperp can be used to select only singly scattered light from a specimen. Backscattered intensity maps were acquired from silk films and background, at angles between − 4.2 to + 4.2 degrees. The acquisition time for each scattering map was 30 seconds. To account for the angular and spectral effects induced by the lamp properties, the transmission of the optical components, the spectrograph grating characteristics and the camera quantum efficiency, scattered intensity maps were also obtained from a 99% reflectance standard (LabSphere). Thus, for each polarization, a calibrated intensity matrix was acquired by subtracting the background from the data and dividing with the reflectance standard map. LSS data were acquired from three films of each type included in this study.
To analyze the differential (i.e. ΔI(λ)) wavelength-dependent LSS data, a model described in detail previously [24] assuming self-affine fractal morphology of the scatterers (i.e. mineral deposits) was used. The characteristic property of a fractal object is scale invariance. In the case of a self-similar fractal, the scale invariance is isotropic (an object appears indistinguishable at varying scales), whereas self-affinity implies anisotropic scale invariance i.e., a self-affine fractal function f(x) has a variance, S(x) = <|f(x+a) − f(x)|2>, which scales according to S(bx) ∝ bHS(x), where the Hurst parameter, H, is limited to the range 0<H<1 [25]. In self-similar fractals, scale invariance often results from a highly organized, iterative generative process (e.g., the progressive branching in fern leaves or human lung architecture). Self-affinity, on the other hand, is associated with random (or quasi-random) processes [26]. Brownian motion, for example, is a self-affine process: the projection of a “drunkard’s walk” on any particular spatial axis, as a function of time, is a self-affine function with a value of H=0.5. Fractional values of H smaller than, or greater than, H=0.5 imply varying degrees of persistence (positive correlations), or anti-persistence (negative correlations), superimposed on an underlying random process.
Self-affine fractal organization has been observed widely in nature [26], including in CT images of trabecular bone [27]. According to the self-affine fractal model we used to analyze the LSS data, the wavelength dependence of the singly scattered light is described by the expression:
| (1) |
L is the fractal upper scale (the upper bound of fractal correlation lengths) and the exponent α is related to the Hurst parameter, H, via:
| (2) |
Where, DE is the Euclidean dimension of the scattering system (i.e., DE = 1, 2 or 3 for filamentous, sheet-like or bulk scatterers, respectively) [25]. We note that eqn. (1) is valid under the Born approximation, which applies to weakly scattering systems [24]. We expect this equation to hold for the topmost layer (few hundred nm) of our mineral films, for which the optical path difference of incident and scattered rays is small despite the high refractive index of the hydroxyapatite films (n~1.6) [28].
2.3. Thermal measurements
To estimate the β sheet content in the three different types of films, temperature modulated differential scanning calorimetry (TMDSC) was used, as described previously [29]. Specifically, we employed reversing heat capacity curves to determine the heat capacity increment, ΔCp, at the glass transition temperature, Tg, of each film type. The reversing heat capacity in TMDSC represents a heat effect that is reversible within the range of the temperature modulation employed in these measurements. The glass transition temperature is the temperature that defines the change in the physical properties of amorphous materials from a solid-like to a liquid-like phase. Only the mobile fraction of the silk fibroin contributes to the principal glass transition step. Thus, ΔCp is directly proportional to the mobile fraction of the silk protein and inversely proportional to the rigid fraction of the protein. It has been shown that over 97% of this rigid fraction consists of crystalline β-sheets and the crystalline fraction of the silk protein, φc, within a sample examined by TMDSC can be related to ΔCp using the expression: ΔCp = 0.475–0.494* φc [29]. Samples with weight of about 5–8 mg were placed into aluminum pans and heated in a TA Instruments 2920 DSC, which was purged with a dry nitrogen gas flow of 30 mL/min. The instrument was calibrated for empty cell baseline and with indium for heat flow and temperature. The samples were heated at 4°C/min from room temperature to ~230°C, i.e. the degradation temperature of the fibroin molecule [29], with a modulation period of 60s and temperature amplitude of 0.315°C. To calculate the specific reversing heat capacity increment ΔCp, a tangent was drawn along the specific reversing heat capacity curve before the glass transition temperature and extrapolated up to 230°C. The perpendicular distance between the heat capacity at 230°C and this tangent was defined as ΔCp.
The mineral content in different films was estimated from thermogravimetric measurements (TGA). TGA is used primarily for determining thermal stability of polymers. Besides providing information on thermal stability, TGA may be used to characterize polymers through weight loss of a known entity and the residual weight of the sample [30, 31]. In the case of mineralized silk films the residual weights were correlated with amount of mineralization in each film. TGA measurements were performed using a TA 500Q machine. Samples were heated up to 600°C with a step of 10°C/min under an inert nitrogen atmosphere.
2.4. SEM measurements
A small part of silk film was removed after LSS data acquisition, coated with gold and examined using a LEO Gemini 982 Field Emission Gun SEM (Thornwood, NY) to assess the morphology of mineral deposits on the films. In order to characterize quantitatively the organization of mineral deposits as revealed by 10,000X SEM images, Fourier analysis was used. Specifically, we determined the angularly averaged power spectral density (PSD) as a function of spatial frequency, κ, for each image. Our PSD spectra showed inverse power law behavior at high spectral frequencies, and a consistent tendency to level off (κ-independence) at low values of κ. As described by Schmitt and Kumar [32], this behavior is characteristic of a self-affine fractal with an upper scale, L, limiting the range of fractal correlations, and can be described by the following equation:
| (3) |
where 1/L is the spatial frequency at which the PSD function transitions from inverse power law, Φ(κ) ∝ κ−δ to κ-independence, and the power exponent δ = 2m is related to the Hurst parameter via:
| (4) |
Although some of our PSD spectra followed eqn. (3) closely, many exhibited additional low frequency components that deviated from eqn. (3). Quantitative analysis of our SEM images, therefore, was only performed in the inverse power law (fractal) regime at high spatial frequencies, by fitting to a simple inverse power law, Φ(κ) ∝ κ−δ over the range 6 μm−1 < κ < 22 μm−1,. The Hurst parameters thus obtained were compared to those derived via differential LSS (eqn. (2)).
2.5. Statistical analysis
To assess the level of significance in the differences of parameters characterizing the different types of films we performed a standard two-tailed t-test [33]. The reported correlation coefficients were calculated using a built-in Matlab function.
3. Results and Discussion
3.1. Quantitative assessment of mineralization in silk film using light scattering spectroscopy
Wavelength and scattering-angle dependent light scattering maps were acquired from water annealed, methanol-treated and PAA-mixed silk films prior to and following 1, 3, 5 and 7 mineralization cycles. The sum of the maps acquired along the parallel and perpendicular polarizations relative to the incident light represent the total amount of light backscattered from these films. An example of a set of such maps from a water annealed silk film is shown in Figure 1. Water annealed and methanol treated films were almost transparent before mineralization and did not scatter much of the incident light, as evident from the very low intensity of the map shown in Figure 1A. A significant growth in scattering intensity was observed after each cycle of mineralization for all types of films, consistent with the maps included in Figure 1B–E. This is explicitly shown in Figure 2, which includes the mean integrated intensity of the light scattered over the entire detected wavelength and angular range from three films of each type.
Figure 1.
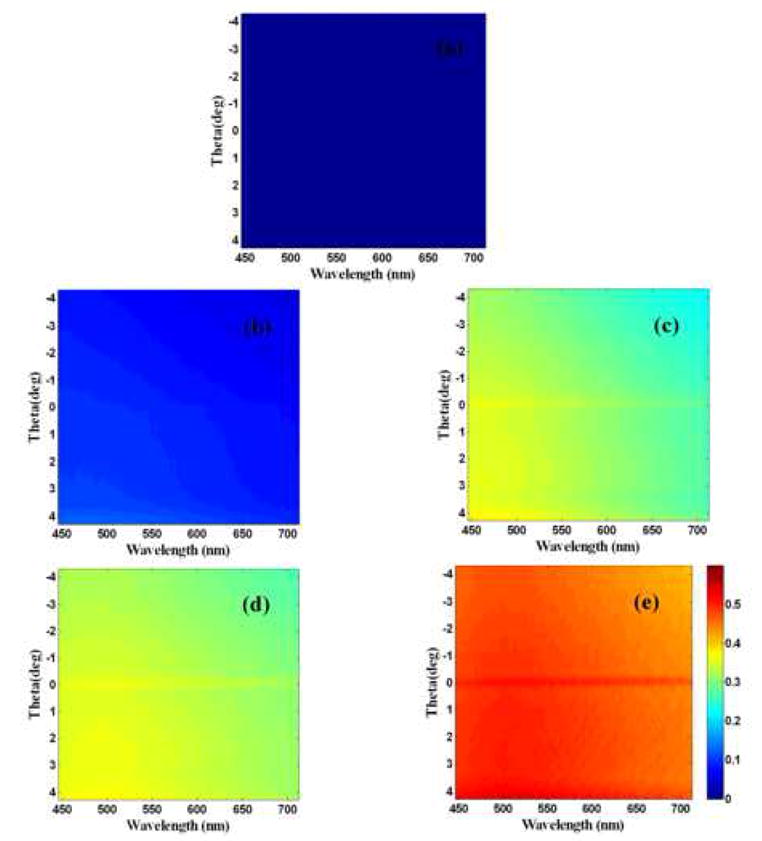
Total light scattering maps for a water annealed film before mineralization (a), first cycle (b), third cycle (c), fifth cycle (d) and seventh cycle (e) of mineralization. All images are on the same color map as shown in figure (e).
Figure 2.
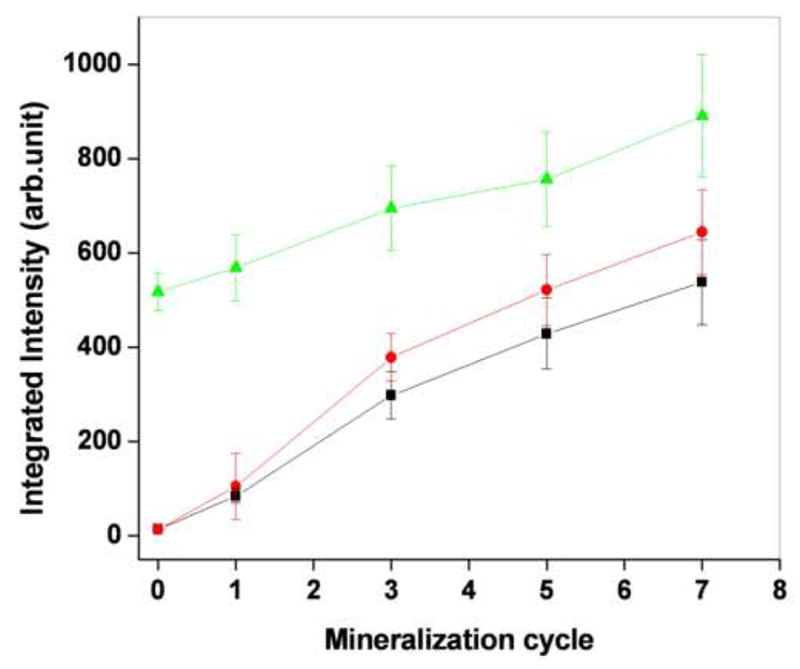
Total integrated intensity of water annealed (■ solid square), MeOH treated ( solid circles) and PAA mixed silk films (
 solid triangles) are different cycle of mineralization
3.2. β sheet assessment of silk films using TMDSC
The light scattered intensity detected from the PAA-mixed films is significantly higher than that detected from the water annealed and methanol-treated films prior to mineralization (p<0.001). This is consistent with the more hazy appearance of the PAA films, which in turn may be attributed to the higher content of β-sheets. To assess directly the β sheet content of the films included in the study, we performed a series of TMDSC measurements on all types of silk films. The thermal stability of silk filmed varies with the β sheet content, with a higher amount of β sheet leading to a higher thermal stability. As a result, the heat capacity increment ΔCp extracted from these measurements as described in the methods section has been shown to correlate highly with the β sheet content of silk films [24]. The specific reversing heat capacity as a function of temperature calculated from these measurements for representative films is shown in Figure 3a. The reversing heat capacity increment for water annealed, MeOH and PAA films was found to be 0.2092±0.002, 0.20±0.005 and 0.19451±0.009 (J/g-C), respectively, corresponding to crystalline fractions of 53.8%, 55.67% and 56.78% respectively. These measurements indicate that the β sheet content of PAA-mixed films is higher than that of the methanol-treated and water annealed films, which could at least partially explain the higher integrated light scattering levels prior to mineralization for these films.
Figure 3.

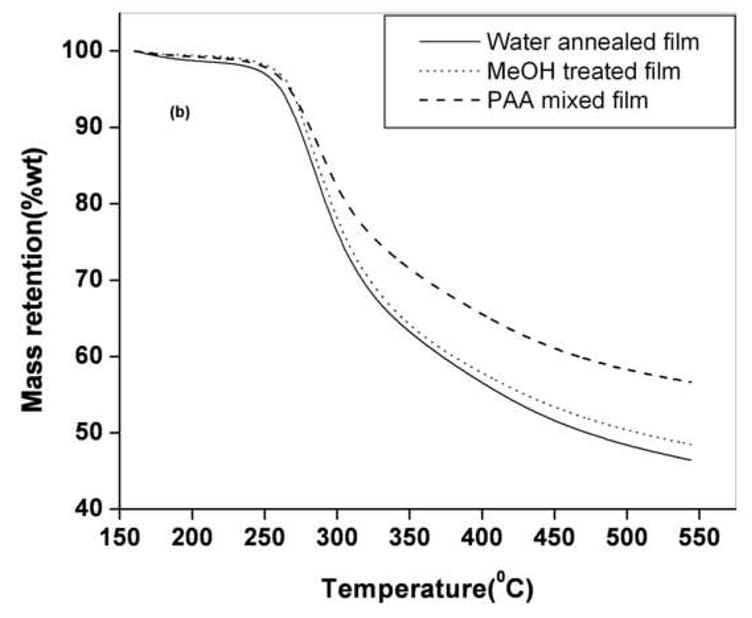
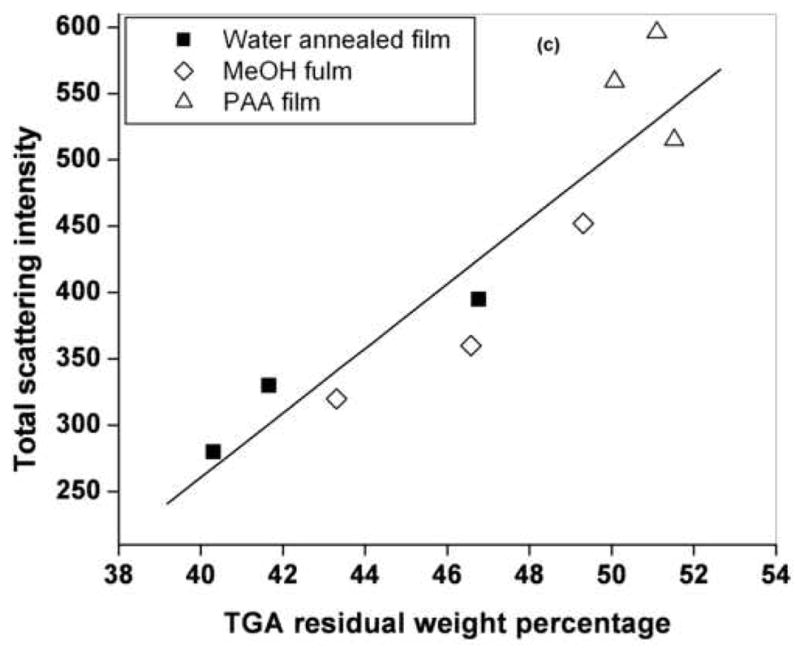
Figure 3a. Specific reversing heat capacity Cp of MeOH treated (dot line), water annealed (dash line) and PAA mixed (solid line) films during TMDSC scanning at the heating rate of 4 °C/min. Inset shows the method of ΔCp calculation for MeOH treated
Figure 3b. TGA thermograms of water annealed (solid line), MeOH treated (dots) and PAA mixed film (dash) after seventh cycle of mineralization. PAA mixed films demonstrate highest residual weights at higher temperatures
Figure 3c. Correlation (correlation coefficient of 0.8924) of light scattering intensity and TGA residual weights for water annealed, MeOH treated and PAA mixed silk films.
3.3. Quantitative characterization of mineralization using TGA and LSS
To determine whether the integrated light scattering intensity of the films following mineralization could be correlated with the level of mineral deposition, we performed TGA measurements of the films at the end of the 7th cycle of mineralization. The TGA thermograms of a representative set of mineralized silk films are shown in Figure 3b. The PAA mixed film had the highest residual weight and the water annealed films has the least residual weight at 400°C and above. The difference in the residual weight of the respective films was due to difference in the amount of deposited mineral [25]. The TGA residual weight of each film correlated (correlation coefficient 0.89) with the corresponding integrated light scattering intensity, as shown in Figure 3c. Therefore, the amount of light backscattered from the films could serve as a non-invasive indicator of the level of mineral deposition. The addition of the PAA provides a significant increase in carboxyl group content, chemistry known to promote nucleation and crystal growth [6, 22]. The TMDSC and TGA measurements indicate that higher levels of crystallinity yield higher levels of mineralization. This correlation may reflect the more ordered structures in more highly crystalline materials, perhaps inducing more organization for the serine hydroxyl groups present in the crystalline domains, as possible sites of mineral nucleation. Further, the increased beta sheet content may also induce more organization in the less crystalline domains in the silk structures as well, altering location of nucleating groups, such as the aspartic and glutamic acid side chains (~3% of the total amino acids) containing carboxyl groups, further optimizing locations for nucleation and crystal growth.
3.4. Assessment of mineral deposit organization using LSS and SEM
The wavelength and angle-dependent features of singly backscattered light has been used to assess subtle differences in the organization of sub-cellular organelles that occur during the development of pre-cancerous lesions [7–10, 34]. As the technique relies on the presence of refractive index variations, we sought to determine whether it could also be used to characterize the organization of the minerals deposited on the film surface, since their refractive index is different from that of air and the underlying film. To identify the spectral features of the light that is scattered in the backward direction after undergoing a single scattering event, we subtract the LSS maps acquired along the parallel and perpendicular directions of polarization relative to that of the incident light. The wavelength dependent features of these residually-polarized LSS spectra, ΔI(λ), at θ = 1° from a representative set of water annealed, methanol-treated and PAA-mixed films prior to and following 1, 3, 5 and 7 mineralization cycles is shown in Figure 4. We observe that the single scattering intensity of mineralized films decreased with increasing wavelength in a manner consistent with a self-affine fractal morphology of the mineral deposits as described by Eq. 1. Figure 5 summarizes the self-affine fractal parameters α and L obtained from analysis of the LSS spectra of the different films shown in Figure 4. Methanol-treated and PAA-mixed films showed similar power exponents (1.75<α<2.0) and little sensitivity to the mineralization cycle. Water-annealed films, on the other hand, showed markedly lower power exponents (0.95<α<1.7) and a trend towards lower values at higher mineralization cycles. For all films, the fractal upper scale values were constrained to the range 150 nm<L<350 nm, indicating the dominant LSS single-scattering signature was from submicron morphological features of these films.
Figure 4.

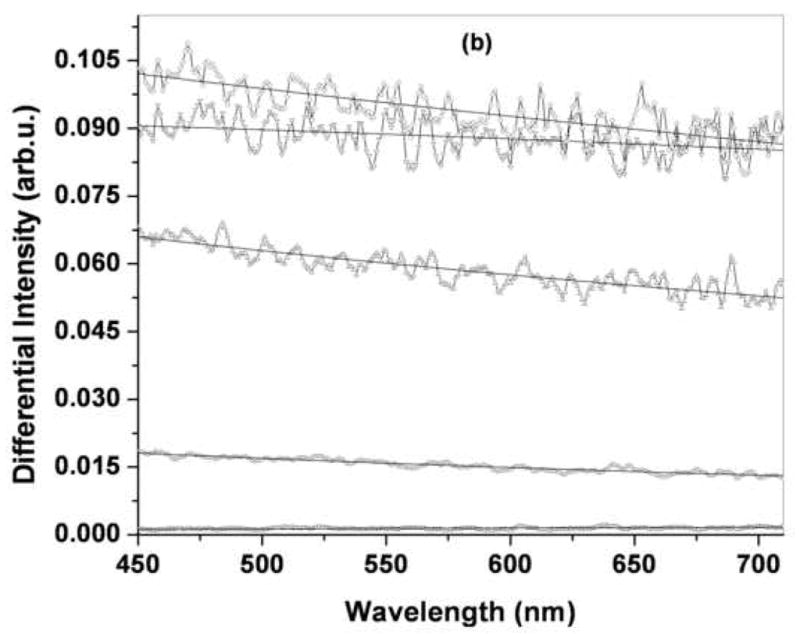

LSS spectra of (a) water annealed, (b) MeOH treated and (c) PAA mixed films at different cycles of mineralization. Solid lines are fits of the fractal model to the light scattering data
Figure 5.
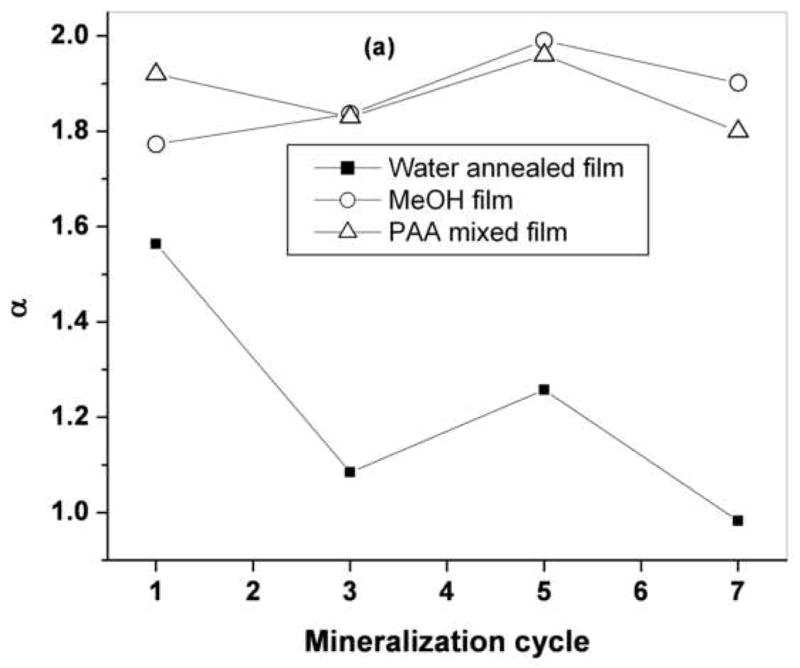

Plot of fractal parameters ‘α’ (figure a) and upper scale ‘L’ (fugure b) for water annealed, MeOH treated and PAA mixed silk films
As discussed above, the exponent α contains information about the fractal organization of a mineral film (Hurst parameter, H) as well as about the dominant film topology (DE). Since H can vary between 0<H<1, the range of α values allowed for each Euclidean dimension is 0.5<α1<1.5, 1.0<α2<2.0 and 1.5<α3<2.5 for DE=1, 2 and 3, respectively. This suggests that in water-annealed films the dominant film topology contributing to LSS spectra, ΔI(λ), was DE=1 and/or 2, whereas in methanol-treated and PAA-mixed films the dominant single-scattering contributions arose from DE=2 and/or 3 features.
For the case of water-annealed films, the ambiguity in film topology derived via differential LSS can be removed by visual inspection of the SEM images from these films. A value of DE=1 would imply the dominant surface morphology to be composed of a random (or near-random) network of mineral filaments of submicron diameter and mesh size on the order of L (180–250 nm in water-annealed films). No such features were evident in the SEM images of the water-annealed films (Fig. 6), even at 30,000x magnification (Figure 7a), thereby ruling out a filamentous fractal film morphology (DE=1). This implies that the differential LSS signal from the water-annealed films is dominated by single scattering from sheet-like fragments or flakes in the mineral surfacelayer (i.e., DE=2), with flake sizes on the order of L. This interpretation is consistent with the loosely packed, scaled appearance of the SEM images shown in Figs. 6 and 7a. According to eqn. 2, the measured values 1.75<α<2.0 in water-annealed films thus indicate a surface film morphology dominated by self-affine, submicron platelets with Hurst parameters in the range 0.75<H<1 (indicating persistently, or positively, correlated surface height variations, as in typical Earth landscapes [26, 35])
Figure 6.

SEM images of a water annealed film before mineralization (a), first cycle (b), third cycle (c), fifth cycle (d) and seventh cycle (e) of mineralization at 10000 × resolution.
Figure 7.
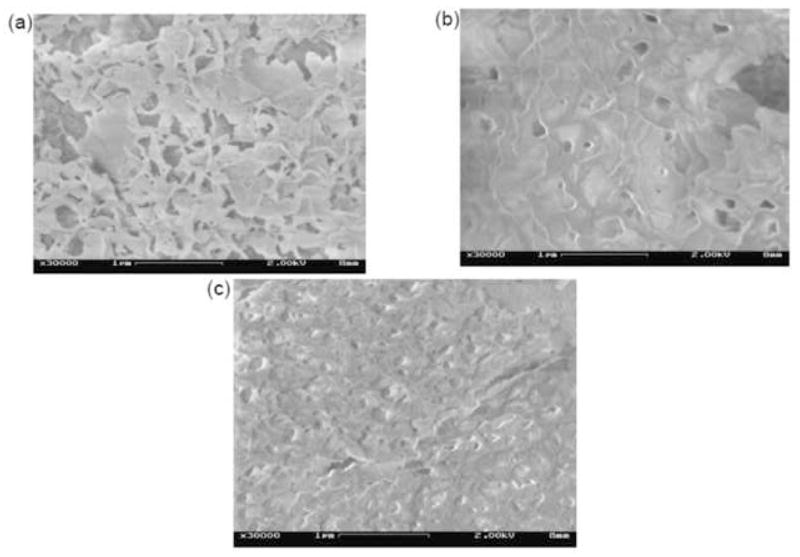
SEM images of mineralized silk films, at 30000x magnification, after seventh cycle of mineralization. (a) Water-annealed, (b) Methanol-treated, (c) PAA-mixed.
For methanol-treated and PAA-mixed films it is harder to distinguish between the two possible film topologies, DE=2 and DE=3, in the SEM images (Figs. 7b and 7c). These mineral films, however, appear far more densely packed than in the water-annealed silk, and it is thus more likely that differential LSS from these films samples bulk (DE=3) sections of their topmost layer, rather than flakes or plates (DE=2). According to eqn. 2, a value of DE=3 would imply the Hurst parameter in these films to vary over the range 0.25<H<0.5, indicating anti-persistent (or negative) correlations in their 3-dimensional packing or density. This is in sharp contrast to the persistent (positive) correlations inferred for the water-treated films.
To determine whether the fractal parameters extracted from the analysis of the polarized light scattering spectra were indeed representative of the organization of mineral deposits on silk films, we removed a small piece of one set of films after each LSS measurement and imaged it using SEM. A representative set of images acquired from the water annealed films is shown in Figure 6. To study the nature of the variation in the surface structures of these films, we evaluated the angularly averaged (radial) power spectral density (PSD), Φ(κ), of these images from their two-dimensional Fourier transform [32]. Figures 8 shows the corresponding angle-averaged (radial) power spectral density (PSD), Φ(κ), curves over a range of spatial frequencies 0.4 μm−1 < κ < 25 μm−1 of the SEM images shown in Fig. 6 The PSD curves generally exhibit three types of functional dependence on spatial frequency. At high frequencies (0.8 μm−1 < log10 κ <1.35 μm−1), there is a clear inverse power law behavior, Φ(κ) ∝ κ−δ with power exponents typically in the range 1 < δ < 2. At intermediate frequencies (0.5 μm−1 < log10 κ < 0.8 μm−1), the PSD spectra transition into a κ-independent region, which in some cases persists over the entire low frequency range (e.g, Fig. 7 in 1st and 3rd cycles of mineralization). In other cases, however, an additional and sometimes structured (oscillatory) component develops at low spatial frequencies (log10 < 0.5 μm−1).
Figure 8.
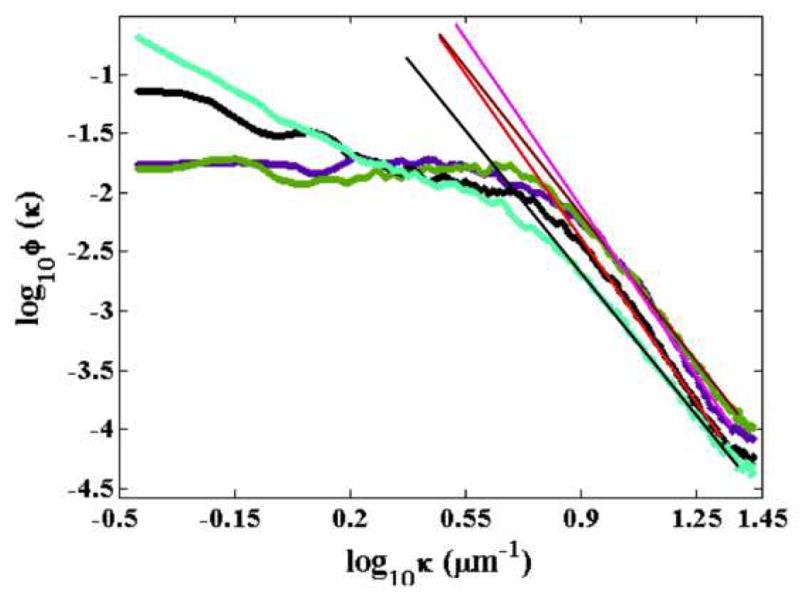
Inverse power law fitted PSD profiles of 10000X water annealed mineralized silk films at first cycle (purple color), third cycle (green color), fifth cycle (black color) and seventh cycle (light green color) of mineralization.
The high frequency inverse power law behavior in the PSD functions of the SEM images is indicative of scale-invariant fractal organization (self-affinity) of the mineralized films’ morphology at submicron scales, in accordance with the single-scattering LSS results discussed above. Figure 8 includes the inverse power law fits to the PSD functions of water-annealed films over the high spatial frequency range 0.85 μm−1 < log10 κ < 1.25 μm−1. The PSD power exponents obtained from all the mineralized films are shown in Figure 9, where they are plotted against the corresponding self-affine fractal power exponent, α, obtained by LSS. Significant correlation is observed between the SEM and LSS fractal power exponents, corroborating the sensitivity of the LSS technique to the fractal mineral morphology at submicron scales. The correlation coefficients for water annealed, MeOH treated and PAA mixed films were found to be R= 0.72, 0.59 and 0.57 respectively
Figure 9.
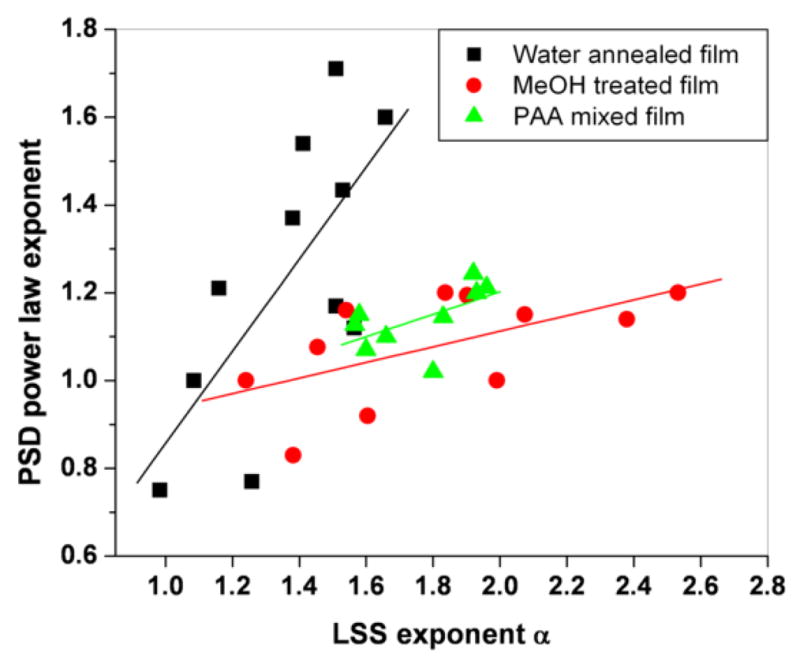
Correlation of light scattering slopes and PSD inverse power law slopes for different types of silk films water annealed (■ solid square, correlation coefficient 0.72), MeOH treated (
solid circles, correlation coefficient 0.59), PAA mixed silk films (
solid triangles, correlation coefficient 0.57)
It is interesting that in methanol-treated and PAA-mixed films, the relationship between LSS and SEM fractal exponents, α and δ, was very similar to each other, but quite different than in the water-annealed films (see slopes in Fig. 9). This is qualitatively in line with the different fractal parameters, H and DE, inferred via LSS for water-annealed films on one hand, and methanol-treated and PAA-mixed films on the other. We note, however, that the relationship between LSS and SEM fractal parameters for all films shown in Fig. 9 is not in quantitative agreement with our LSS model for a weakly-scattering, self-affine substrate. According to eqns. 2 and 4, the relationship between α and δ is given by:
| (5) |
The slopes for all films in Fig. 9, however, were all markedly lower than 2 and the y-intercepts were also not consistent with the inferred values of DE for these films. The discrepancy could be due to a variety of factors. If the differential LSS signal in these experiments, for example, is sensitive to deeper surface layers than assumed (depth > few hundred nm), the weak scattering (Born approximation) assumption would no longer be valid and our LSS model would need to be modified. Systematic errors in the PSD fractal exponents, δ, could have also resulted from contamination by the κ-dependent signal often seen at low spatial frequencies. Future work will address these issues by examining films at much lower stages of mineralization, to ensure low optical density of the films and to minimize LSS contributions from larger clumps (low spatial frequency) of deposited minerals.
Finally, the transition away from a power law PSD regime to a κ-independent, low frequency zone is indicative of an upper limit to the correlation distance over which fractal behavior is exhibited by these films (the fractal upper scale, L, discussed above). Although a precise characterization of these upper scales is not always possible from our PSD curves, due to the frequent presence of additional low-frequency components, an estimate can be made from the approximate position of the “elbow” in the PSD curves (0.5 μm−1 < log10 κ < 0.8 μm−1) [32]. These spatial frequencies correspond to upper scale values in the range 150 nm<L<300 nm, which is in remarkably close agreement with the values obtained by LSS (Fig. 5).
4. Conclusion
We demonstrated the use of LSS as a potential non-invasive technology to assess the amount and organization of mineral deposits on silk films. Specifically, we showed that the integrated intensity of backscattered light in the 450 to 700 nm region can be used to assess the overall amount of mineral deposited on the films, as confirmed by correlations with TGA measurements. In addition, we found that the PAA-mixed films with the highest β sheet content yield enhanced levels of mineral deposition, when compared to methanol treated and water annealed films. The deposited minerals had a self-affine fractal morphology, with an upper limit to the range of fractal organization in all films in the range 150 nm<L<300 nm, as confirmed by both differential LSS and SEM analyses. Minerals on the water-annealed films were predominantly flake-like, with positively correlated height fluctuations within each flake (H>0.5), whereas methanol-treated and PAA-mixed silk films supported densely-packed, bulk mineral films with negatively correlated density fluctuations (H<0.5). Our future studies will focus on the use of LSS to characterize mineral deposition occurring at slower rates, which may be more relevant to biomaterial mineralization processes occurring naturally.
Acknowledgments
The authors wish to acknowledge financial support for these studies from NSF (BES 0547292) and NIH (Tissue Engineering Resource Center P41 EB002520). We would also like to thank H. J. Kim and Christopher Bayan for assistance with silk film preparation.
Footnotes
Publisher's Disclaimer: This is a PDF file of an unedited manuscript that has been accepted for publication. As a service to our customers we are providing this early version of the manuscript. The manuscript will undergo copyediting, typesetting, and review of the resulting proof before it is published in its final citable form. Please note that during the production process errors may be discovered which could affect the content, and all legal disclaimers that apply to the journal pertain.
References
- 1.Lowenstam HA. Minerals formed by organisms. Science. 1981;211:1126–1131. doi: 10.1126/science.7008198. [DOI] [PubMed] [Google Scholar]
- 2.Mann S. Mineralization in biological systems. Structure and Bonding. 1983;54:125–174. [Google Scholar]
- 3.Mann S. Biomineralization Principles and Concepts in Biogenic Materials. New York: Chemistry Oxford University Press; 2001. [Google Scholar]
- 4.Frankel RB, Bazylinski DA. Biologically induced mineralization by bacteria. Reviews in Mineralogy and Geochemistry. 2003;54:95–114. [Google Scholar]
- 5.Weiner S, Dove PM. An overview of biomineralization processes and the problem of the vital effect. Reviews in Mineralogy and Geochemistry. 2003;54:1–29. [Google Scholar]
- 6.Li Chunmei, Jin HJ, Botsaris GD, Kaplan DL. Silk apatite composites from electrospun fibers. J Mater Res. 2005;20:3374–3384. [Google Scholar]
- 7.Backman V, Gurjar R, Badizadegan K, Itzkan I, Dasari R, Perelman LT, et al. Polarized light scattering spectroscopy for quantitative measurement of epithelial cellular structures. IEEE J Selected Topics Quantum Electron. 1999;5:1019–1026. [Google Scholar]
- 8.Backman V, Wallace MB, Perelman LT, Arendt JT, Gurjar R, Muller MG, et al. Detection of preinvasive cancer cells in situ. Nature. 2000;406:35–36. doi: 10.1038/35017638. [DOI] [PubMed] [Google Scholar]
- 9.Wallace MB, Perelman LT, Backman V, Crawford JM, Fitzmaurice M, Seiler M, et al. Endoscopic detection of dysplasia in patients with Barrett’s esophagus using light-scattering spectroscopy. Gastroenterology. 2000;119:677–682. doi: 10.1053/gast.2000.16511. [DOI] [PubMed] [Google Scholar]
- 10.Gurjar R, Backman V, Badizadegan K, Dasari R, Itzkan I, Perelman LT, et al. Imaging human epithelial properties with polarized light scattering spectroscopy. Nature Medicine. 2001;7:1245–1248. doi: 10.1038/nm1101-1245. [DOI] [PubMed] [Google Scholar]
- 11.Altman GH, Diaz F, Jakuba C, Calabro T, Horan RL, Chen JS, et al. Silk based biomaterials. Biomaterials. 2003;24:401–416. doi: 10.1016/s0142-9612(02)00353-8. [DOI] [PubMed] [Google Scholar]
- 12.Foo CWP, Kaplan DL. Genetic engineering of fibrous proteins: spider dragline silk and collagen. Adv Drug Delivery Rev. 2002;54:1131–1143. doi: 10.1016/s0169-409x(02)00061-3. [DOI] [PubMed] [Google Scholar]
- 13.Nazarov R, Jin HJ, Kaplan DL. Porous 3-D scaffolds from regenerated silk fibroin. Biomacromolecules. 2004;5(3):718–726. doi: 10.1021/bm034327e. [DOI] [PubMed] [Google Scholar]
- 14.Valluzzi R, Gido SP, Zhang WP, Muller WS, Kaplan DL. Trigonal crystal structure of bombyx mori silk incorporating a threefold helical chain conformation found at the air-water interface. Macromolecules. 1996;29:8606–8614. [Google Scholar]
- 15.Valluzzi R, Gido SP. Crystal structure of Bombyx mori silk at the air-water iInterface. Biopolymers. 1997;42:705–717. [Google Scholar]
- 16.Ishida M, Asakura T, Yokoi M, Saito H. Solvent and mechanical treatment induced conformational transition of silk fibroins studies by high-resolution solid-state C NMR spectroscopy. Macromolecules. 1990;23:88–94. [Google Scholar]
- 17.Chen X, Knight DP, Shao ZZ, Vollrath F. Regenerated Bombyx silk solutions studied with rheometry and FTIR. Polymer. 2001;42:9969–9974. [Google Scholar]
- 18.Chen X, Shao ZZ, Marinkovic NS, Miller LM, Zhou P, Chance MR. Conformation transition kinetics of regenerated Bombyx mori silk fibroin membrane monitored by time-resolved FTIR spectroscopy. Biophys Chem. 2001;89:25–34. doi: 10.1016/s0301-4622(00)00213-1. [DOI] [PubMed] [Google Scholar]
- 19.Motta A, Fambri L, Migliaresi C. Regenerated silk fibroin films: Thermal and dynamic mechanical analysis. Macromol Chem Phys. 2002;203:1658–1665. [Google Scholar]
- 20.Agarwal N, Hoagland DA, Farris RJ. Effect of moisture absorption on he thermal properties of Bombyx mori silk fibroin films. J Appl Polym Sci. 1997;63:401–410. [Google Scholar]
- 21.Tretinnikov ON, Tamada Y. Influence of casting temperature on the near-surface structure and wettability of cast silk fibroin films. Langmuir. 2001;17:7406–7413. [Google Scholar]
- 22.Kong XD, Cui FZ, Wang XM, Zhang M, Zhang W. Silk fibroin regulated mineralization of hydroxyapatite nanocrystals. J Crystal Growth. 2004;270:197–202. [Google Scholar]
- 23.Kim Y, Liu Y, Wali R, Roy H, Goldberg M, Kromin A, et al. Simultaneous measurement of angular and spectral properties of light scattering for characterization of tissue microarchitecture and its alteration in early precancer. IEEE J Selected Topics Quantum Electron. 2003;9:243–256. [Google Scholar]
- 24.Hunter M, Backman V, Popescu G, Kalashnikov M, Boone CW, Wax A, et al. Tissue self-affinity and polarized light scattering in the born approximation: A new model for precancer detection. Phys Rev Lett. 2006;97:138102–138105. doi: 10.1103/PhysRevLett.97.138102. [DOI] [PubMed] [Google Scholar]
- 25.Voss RF. Characterization and measurement of random fractals. Physica Scripta. 1986;T13:27–32. [Google Scholar]
- 26.Mandelbrot BB. The Fractal Geometry of Nature. 19. W.H. Freeman & Co; New York: 2000. [Google Scholar]
- 27.Dougherty G, Henebry GM. Fractal signature and lacunarity in the measurement of the texture of trabecular bone in clinical CT images. Med Eng Phys. 2001;23:369–380. doi: 10.1016/s1350-4533(01)00057-1. [DOI] [PubMed] [Google Scholar]
- 28.Simukanga S, Lombe WC. Electrochemical properties of apatite and other minerals of Zambian phosphate ores in aqueous solution. Fertilizer Res. 1995;41:159–166. [Google Scholar]
- 29.Xiao Hu, Kaplan DL, Cebe P. Determining beta-sheet crystallinity in fibrous protein by thermal analysis and infrared spectroscopy. Macromolecules. 2006;39:6161–6170. [Google Scholar]
- 30.Gil ES, Frankowski DJ, Bowman MK, Gozen AO, Hudson SM, Spontak RJ. Mixed protein blends composed of gelatin and Bombyx mori silk fibroin: Effects of solvent-induced crystallization and composition. Biomacromolecules. 2006;7:728–735. doi: 10.1021/bm050622i. [DOI] [PubMed] [Google Scholar]
- 31.Youngjuan R, Xiaodan Sun, Fuzhai Cui, Xiangdong Kong. Effects of pH and initial Ca2+-H2PO4− concentration on fibroin mineralization. Front Mat Sci China. 2007;1:258–262. [Google Scholar]
- 32.Schmitt JM, Kumar G. Turbulent nature of refractive-index variations in biological tissue. Opt Lett. 1996;21:1310–1312. doi: 10.1364/ol.21.001310. [DOI] [PubMed] [Google Scholar]
- 33.Drezek R, Brookner C, Pavlova1 Ina, Boiko I, Malpica A, Lotan R, et al. Autofluorescence microscopy of fresh cervical-tissue sections reveals alterations in tissue biochemistry with dysplasia. Photochem Photobiol 7. 2001;3:636–641. doi: 10.1562/0031-8655(2001)073<0636:AMOFCT>2.0.CO;2. [DOI] [PubMed] [Google Scholar]
- 34.Perelman LT, Backman V, Wallace M, Zonios G, Manoharan R, Nusrat A, et al. Observation of periodic fine structure in reflectance from biological tissue: A new technique for measuring nuclear size distribution. Phys Rev Lett. 1998;80:627–630. [Google Scholar]
- 35.Power WL, Tullis TE. Euclidean and fractal models for the description of rock surface roughness. J Geophys Res. 1991;96:415–424. [Google Scholar]