Abstract
The goal of the present study was to evaluate the temporal response of particulate-based EPR oximetry probes to changes in partial pressure of oxygen (pO2). In order to accurately evaluate the oxygen-response time, we developed a method for rapid modulation of pO2 in a chamber containing the probe using an oscillator-driven speaker–diaphragm setup. The apparatus was capable of producing sinusoidal changes in pO2 at frequencies up to 300 Hz or more. The pressure-modulation setup was used to evaluate the temporal response of some of the most commonly used phthalocyanine-based particulate probes. For validation, the time-response of the probes was compared to that of a high sensitivity pressure sensor. The results revealed that some particulate probes could respond to changes in pO2 with a temporal response of 3.3 ms (300 Hz). The observations were interpreted in the light of their crystalline packing in favor of oxygen diffusion. The results of the present study should enable the selection of probes for oximetry applications requiring high temporal resolution.
Keywords: Response time, LiPc, LiNc-BuO, Particulate probes, EPR oximetry
1. Introduction
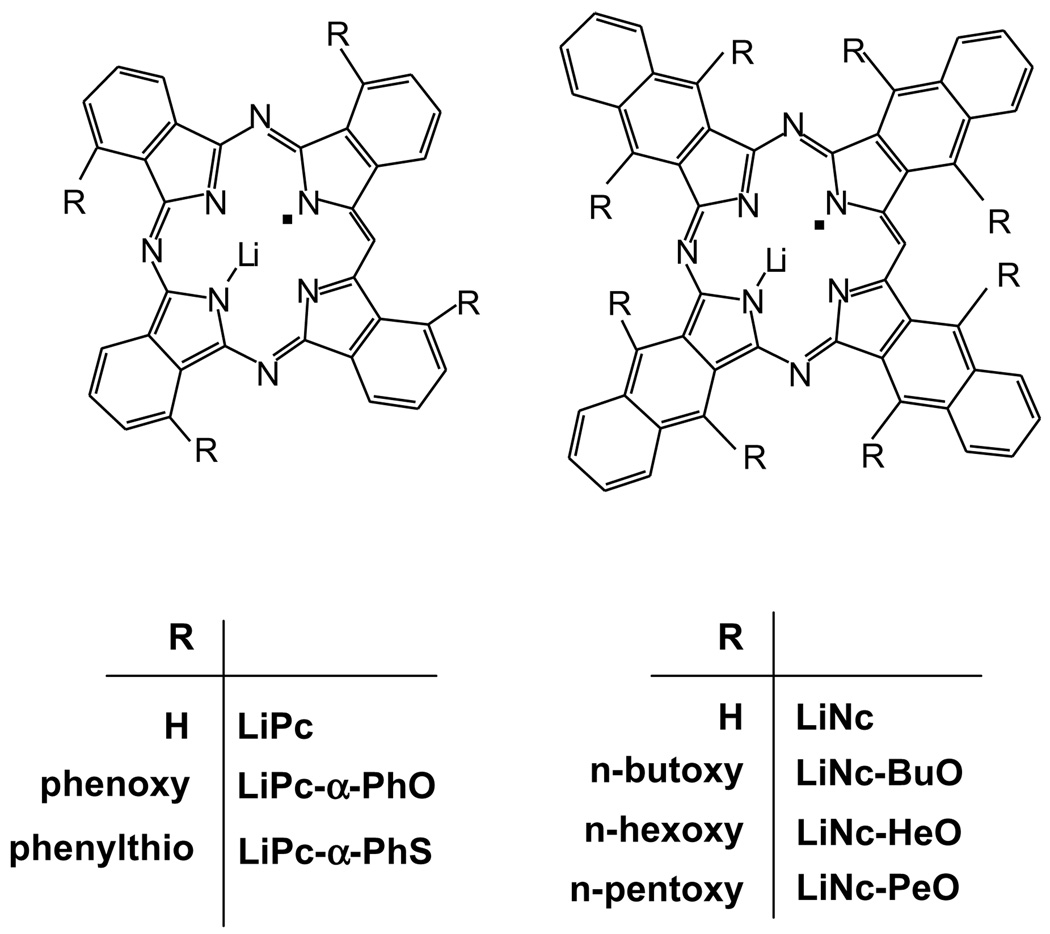
Electron paramagnetic resonance (EPR) spectroscopy is a widely used technique to measure the concentration of oxygen (oximetry) in biological systems. The measurement of oxygen concentration or partial pressure of oxygen (pO2) by EPR involves the use of an external probe consisting of either soluble or implantable (particulate) paramagnetic probes that physically interact with oxygen without consuming it [1,2]. The principle of EPR oximetry is based upon oxygen-induced broadening of the EPR peak. The broadening, typically measured as peak-to-peak linewidth, is caused by the interaction of the probe with molecular oxygen. Therefore, by observing the changes in the linewidth, one can determine the concentration of oxygen. The EPR oximetry provides absolute values of oxygen concentration or pO2 and is performed in real time. The probes also exhibit reasonable half-life and adequate distribution in tissue, thus enabling mapping (imaging) of oxygen concentration [3–5]. Particulate probes such as lithium phthalocyanine (LiPc) and lithium octa-n-butoxynaphthalocyanine (LiNc-BuO) have been extensively used for EPR oximetry [6,7]. In addition, our laboratory has developed several new derivatives of these probes (Fig. 1) for a broad range of applications. Particulate probes are generally characterized with high paramagnetic content with a single EPR peak. Since a good signal-to-noise ratio (SNR) is essential to keep the acquisition time reasonable, particulate probes that have high densities of unpaired spins and a single narrow peak are generally preferred over soluble probes for EPR spectroscopy. The particulate probes are particularly suited for in vivo applications because of their ease of implantation and capability of local, reproducible, and repetitive measurements [7–10]. However, the response time (temporal response) of the particulate probes to oxygen is limited due to the need for the oxygen molecules to diffuse into the solid. This is particularly important where the measurements need to be performed in a rapidly changing oxygen environment such as that in a contractile cell or beating heart. The solid probes have been previously shown to have a time response of a second or less [6,7,11,12]. The method for evaluating the response time involved manual switching between room air and 100% nitrogen. This method, however, cannot be used to induce changes in oxygen content on the order of milliseconds due to the physical limitations imposed by gas regulators and switches. The goal of the present work was to design a setup to accurately evaluate the temporal response time of a few selected particulate probes under different experimental conditions. In order to do this, an experimental arrangement consisting of a speaker and diaphragm was used to induce rapid pO2 changes up to 300 Hz. The effect of rapidly changing the oxygen pressure on the EPR spectrum was measured using a second harmonic detection at fixed magnetic field and Fourier transform (FT) post-processing. The following probes were chosen for this study: lithium phthalocyanine (LiPc) [2,10,11], lithium α-tetraphenoxyphthalocyanine (LiPc-α-PhO) [13], lithium naphthalocyanine (LiNc) [6], lithium octa-n-butoxynaphthalocyanine (LiNc-BuO) [7,14], and charcoal [15,16]. In addition, three newly synthesized probes, lithium octa-n-hexoxynaphthalocyanine (LiNc-HeO), lithium octa-n-pentoxynaphthalocyanine (LiNc-PeO), and lithium α-tetraphenylthiophthalocyanine (LiPc-α-PhS) have also been included in the study. The relevant features of the probes are summarized in Table 1. The results showed that many of the particulate probes, including LiPc and LiNc-BuO, responded to changes in pO2 for up to 300 Hz, suggesting that these probes can be used for measurements of pO2 with high temporal resolution.
Fig. 1.
Chemical structures of particulate EPR oximetry probes used in this study. The EPR and crystal structural features of the probes are given in Table 1.
Table 1.
List of relevant features of LiPc, LiPc-α-PhO, LiPc-α-PhS, LiNc, LiNc-BuO, LiNc-PeO, LiNc-HeO, and charcoal
| Probe | Anoxic linewidth (G) |
Oxygen sensitivity (mG/mmHg) |
Pore size (Å × Å) |
Reference |
|---|---|---|---|---|
| LiPc | 0.02 | 5–9 | 5.9 × 5.9 | [8,11,23,24] |
| LiPc-α-PhO | 0.53 | 13.7 | 4.6 × 8.7 | [13] |
| LiPc-α-PhS | 0.91 | 11.5 | NA | NA |
| LiNc | 0.51 | 34 | 5.0 × 5.4 | [6] |
| LiNc-BuO | 0.21 | 8.5 | 10 × 6.0 | [3,7,14] |
| LiNc-PeO | 0.33 | 8.3 | NA | NA |
| LiNc-HeO | 0.38 | 6.5 | NA | NA |
| Charcoal | 0.45 | 3–6 | NA | [15,16] |
Here, NA stands for “not available”.
2. Materials and methods
2.1. Materials
The response times of the following particulate probes were studied: lithium phthalocyanine (LiPc), lithium α-tetraphenoxyphthalocyanine (LiPc-α-PhO), lithium naphthalocyanine (LiNc), lithium octa-n-butoxynaphthalocyanine (LiNc-BuO), lithium octa-n-hexoxynaphthalocyanine (LiNc-HeO), lithium octa-n-pentoxynaphthalocyanine (LiNc-PeO), and lithium α-tetraphenylthiophthalocyanine (LiPc-α-PhS). All the probes were synthesized in our laboratory [6,7,11]. The details of the synthesis and characterization of LiNc-PeO, LiPc-α-PhS, and LiNc-HeO will be published separately [17]. DPPH and charcoal (activated carbon) were purchased from Sigma–Aldrich (St. Louis, MO). The oxygen response of the probes were calibrated as reported [7].
2.2. Preparation of aqueous suspensions of the probes
The microcrystalline particulates were sonicated for suspension aqueous solutions. Prior to sonication the crystals were ground into a fine powder. About 15 mg was suspended in 3 ml of PBS. All samples were then sonicated at 22.5 kHz using a horn with a tip diameter of 3 mm (Sonic Dismembrator, model 100, supplied by Fisher Scientific). The ultrasound power was set to a value of 5 (out of a possible value of 9) on the generator. In the absence of temperature control, sonolysis of water (3 ml) for 30 s under these conditions resulted in a temperature rise of 6.5 °C. Therefore, the calorimetrically determined ultrasonic intensity using this power setting was calculated [18] to be 4Wcm−2. Sonolysis was conducted for a total of 5 min (10 times 30 s with a 60-s cooling in between) creating a “homogeneous” dispersion of particles in water. The temperature rise in the sample during sonolysis in a surrounding ice bath was negligible. At the end of the final sonication period, the suspension was placed on ice for exactly 2 min to allow the heavier particulates to settle down at the bottom of the tube. The liquid containing fine particulates of the probe was decanted and transferred to a separate tube. The size of the particulates was <2 µm as determined by using a particle-size analyzer (Malvern Instruments, model; Zetasizer, nano-s). The probes LiPc-α-PhO, LiNc-PeO, LiPc-α-PhS, LiNc-HeO were not used for this procedure as their sonication procedures as well as characterization are still in progress for publication [17].
2.3. Experimental design
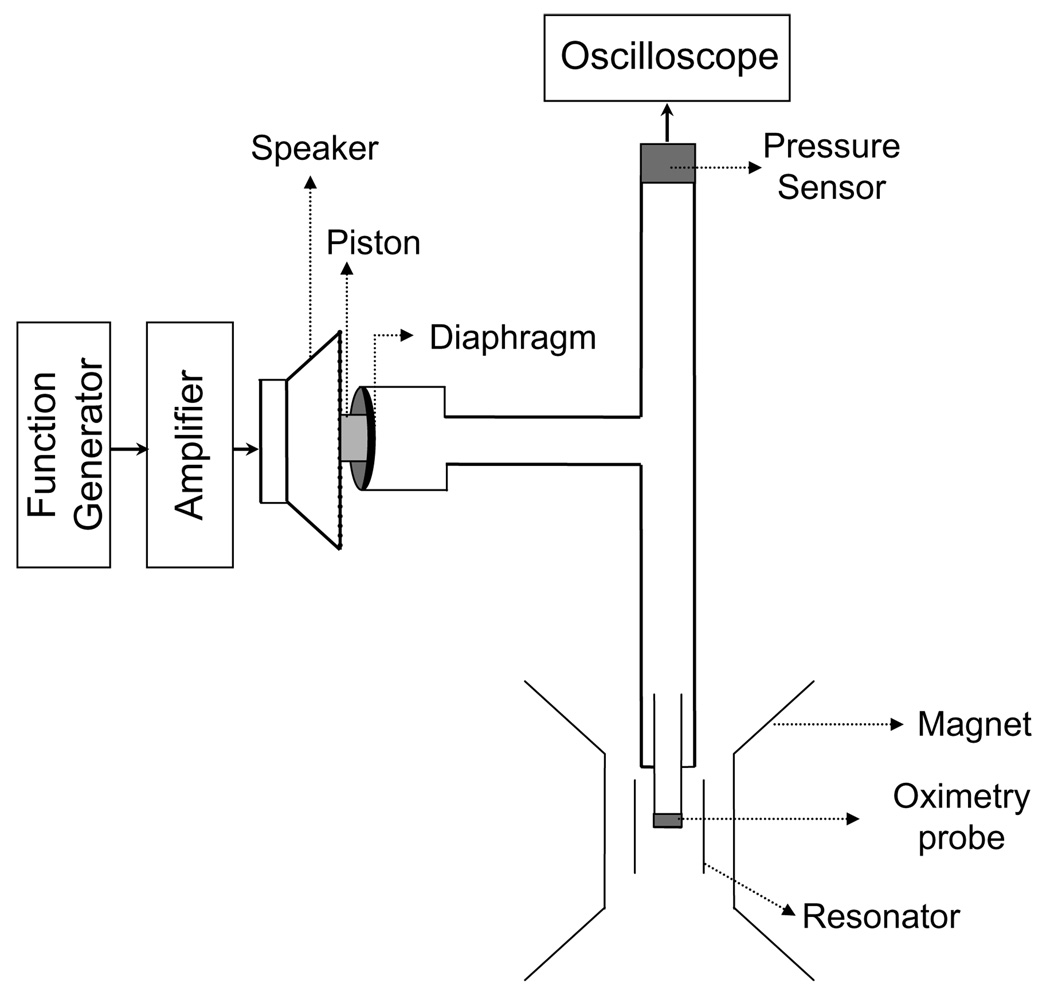
The experimental arrangement, shown in Fig. 2, was developed to induce rapid periodic fluctuations (in the order of ms) in pO2, and to measure its effect on the EPR lineshape. The pressure modulation was achieved using a speaker–diaphragm arrangement driven by an oscillator. A function generator (DS345, Stanford Research Systems, Sunnyvale, CA) was used to drive a 10-in. speaker (TSW251R, Pioneer Electronics). The speaker had a frequency response of 20–4500 Hz. A short plastic piston was glued to the center cone of the speaker. The piston was brought in contact with a diaphragm, which was made of a laboratory-grade glove stretched over one end of a cylindrical plastic tube. As the speaker cone vibrated, the spatial displacement of the diaphragm at one end of the sealed tube changed the chamber volume and hence the pressure. Thus, it was possible to achieve rapid oscillations in pO2 by using the function generator.
Fig. 2.
Schematic diagram of the experimental arrangement used for evaluating the response time of particulate EPR oximetry probes. A function generator was used to drive a speaker to which a short plastic piston was attached. A diaphragm at one end of a T-tube was in contact with the piston. One arm of the T-tube contained the EPR probe while the other end was connected to a pressure sensor. A digital oscilloscope was used to acquire and display data collected by the pressure sensor. The vibration of the speaker cone resulted in a periodic spatial displacement of the diaphragm, changing the chamber volume and hence the pressure. The setup was capable of generating rapid oscillations (up to 300 Hz) in pO2.
The other end of the plastic tube was connected to bifurcated rubber tubing. At the terminal end of one branch, a pressure sensor (ASCX01DN, Digi-Key, Thief River Falls, MN) was attached. The remaining branch was connected to a quartz EPR tube containing the probe to be tested. Effort was taken to seal all connections, thereby creating an air-tight, closed system. The pressure sensor had an output of 4.5 V/psi and a response time of 100 µs. This unit was connected to a digital oscilloscope, enabling display and recording of the pressure waveform produced by the apparatus. The data collected by the sensor and oscilloscope was used to validate and characterize the frequency response of the particulate EPR probes to the pressure modulation.
2.4. EPR data acquisition
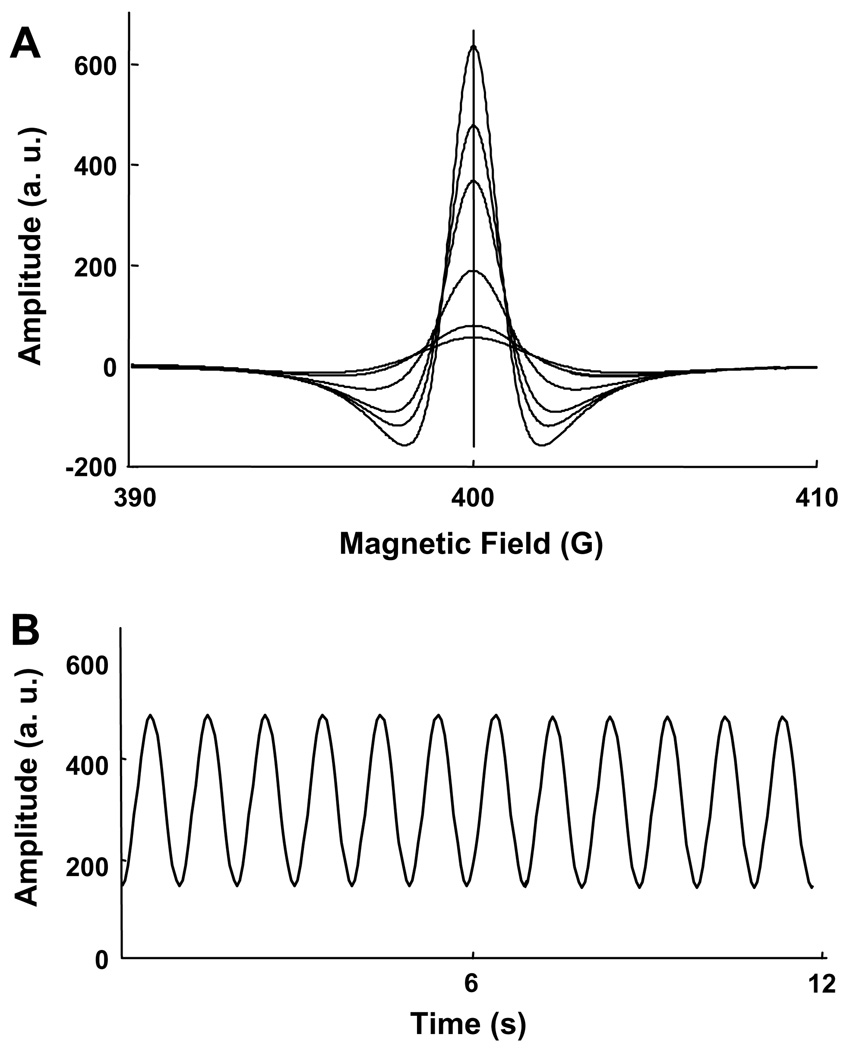
The EPR measurements were performed using a Bruker X-Band spectrometer (ER-300E, 9.7 GHz). For rapid acquisition, the magnetic field was set to the resonance value of the probe being tested, and the peak of the second derivative profile was observed, as illustrated in Fig. 3. The Bruker data acquisition system module (ER023) would allow acquisition of 4096 data points per scan, with a minimum scan time of 2.62 s. As a result, the maximum achievable sampling frequency was 1583 Hz which implies that the Nyquist criterion was fulfilled for all frequencies below 791 Hz. As the linewidth changes, the amplitude (at the peak position) also changes. Under the assumption that the area under the curve is conserved, the relationship between the linewidth and peak amplitude for the second derivative is given as
| (1) |
where k > 0 is a constant and a1 and a2 are the signal amplitudes corresponding to the linewidths of γ1 and γ2. Therefore, the relative changes in amplitude can be readily converted to relative changes in linewidth. Although the experiment can be performed in the first derivative mode, the shift in the peak location as a function of changes in pO2 makes the conversion from signal amplitude to pO2 difficult to scale. The second derivative Lorentzian has a fixed peak, and the dependence of the observed signal upon linewidth change is cubic, as opposed to square for the first derivative.
Fig. 3.
Simulation EPR lineshape as a function of periodic changes in linewidth of a Lorentzian function. (A) Second derivative spectra corresponding to changes in linewidth. The vertical line corresponds to the resonance field. (B) Temporal changes in spectral amplitude at the resonance field as a function of periodic linewidth modulation. As shown, the response to pressure modulations at 1 Hz is measured in EPR as amplitude changes at 1 Hz.
The experimental procedure involved generation of sinusoidal waveforms with 0–300 Hz frequency, and evaluating the EPR response of the probes. Noise considerations restricted the use of frequencies greater than 300 Hz (3.3 ms). Each probe was evaluated from 0 to 300 Hz in increments of 10 Hz. The spectrometer settings were: sweep width, 0 G; time constant, 10 µs; scan time, 2.62 s. The time constant was kept at the lowest value allowable by the signal channel so as to fulfill the Nyquist criteria. The receiver gain and offset settings were adjusted to maximize the signal-to-noise ratio (SNR). The acquired data were then subjected to Fourier analysis to determine the frequencies of oscillations in pO2. The response time was determined as the inverse of the maximum frequency detected above the noise level (at least 4 dB greater than noise) in the collected data.
3. Results
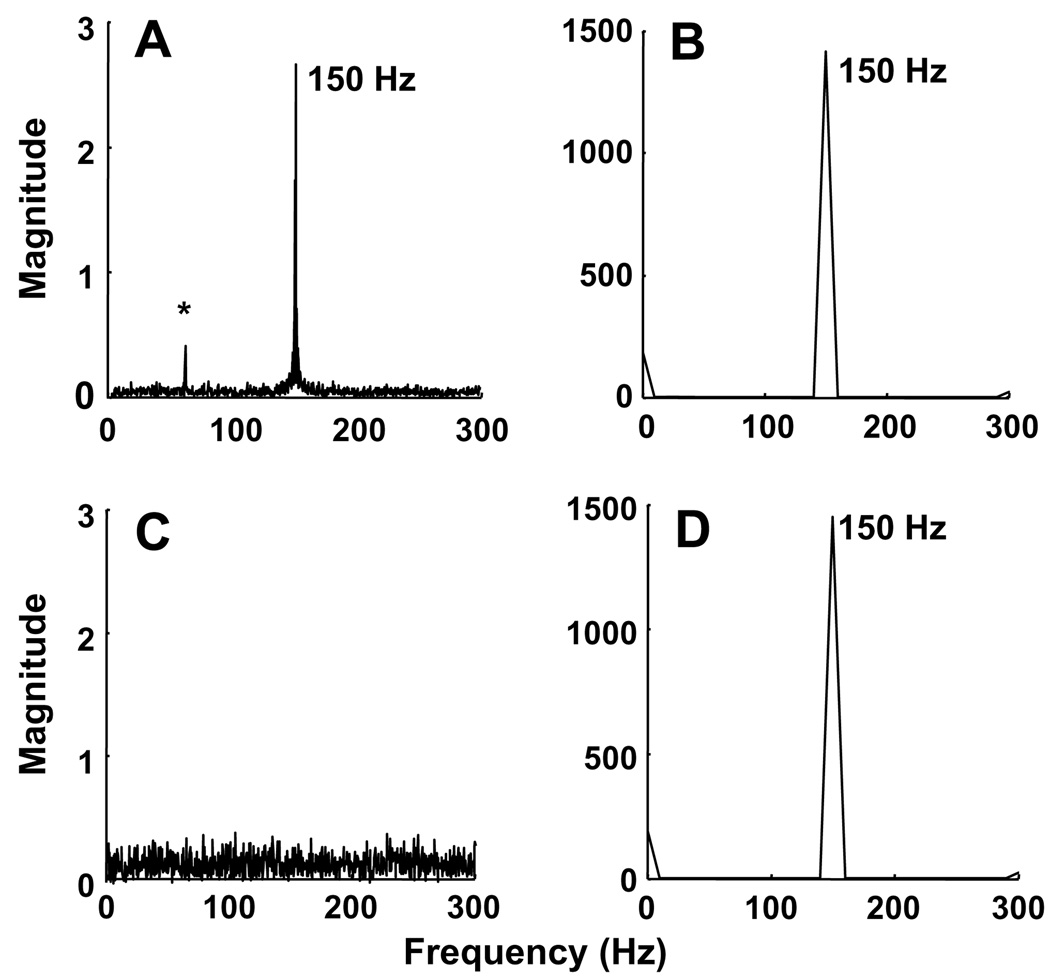
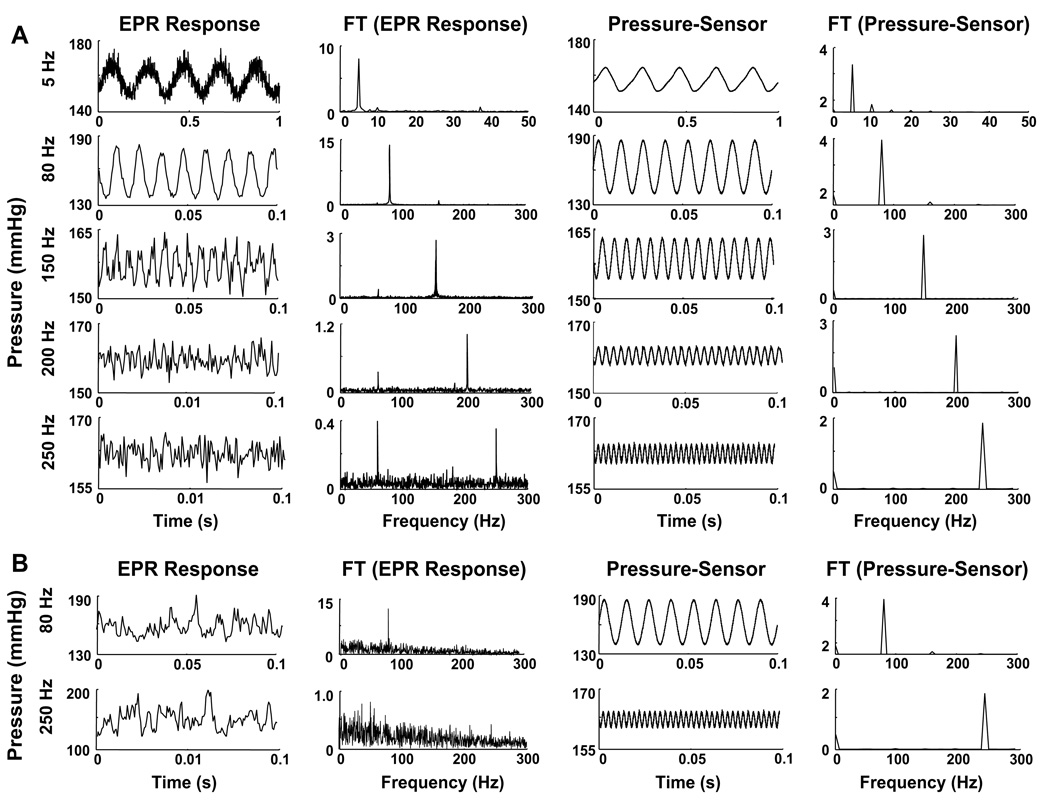
The experimental setup shown in Fig. 2 was evaluated using LiNc and DPPH, which are known to be oxygen-sensitive and oxygen-insensitive, respectively, for changes in pO2 from 0 to 300 Hz. Fig. 4A and B shows the Fourier transform (FT) of EPR and pressure-sensor data, respectively, of LiNc probe subjected to 150-Hz pressure modulation. Fig. 4C and D shows the Fourier transform (FT) of the corresponding data of DPPH at 150 Hz. While the EPR data of LiNc showed a distinct peak at 150 Hz, DPPH did not show any due its oxygen-insensitivity. The pressure sensor data validates these findings. Fig. 5A shows the variations in pO2 and FT data of LiNc measured using EPR and the pressure sensor at frequencies of 5, 80, 150, 200, and 250 Hz. The response for LiPc-α-PhO at 80 and 250 Hz is also shown in Fig. 5B.
Fig. 4.
Fourier transform (FT) analysis of EPR and pressure-sensor data. The data were obtained from crystals of LiNc (A and B) or DPPH (C and D) subjected to 150-Hz pressure modulation. The EPR data of LiNc (A) show a peak at 150 Hz while that of DPPH does not show any peak (C) due its oxygen-insensitivity. The pressure-sensor data, however, show distinct peaks at 150 Hz. The ‘‘*” in (A) indicates a 60-Hz frequency originating from the signal channel at high receiver gains.
Fig. 5.
Response of pO2 and its FT measured using EPR and pressure sensor at different frequencies. (A) The data show that the pressure modulations in the chamber containing the probe (LiNc) are faithfully tracked by both EPR and pressure sensor at the frequencies tested. (B) Response of pO2 and its FT for LiPc-α-PhO. Unlike LiNc, the probe responds up to 150 Hz (6.7 ms). Thus, the absence of a peak in the FT of EPR data at 250 Hz can be seen.
Table 2 summarizes the results from all probes included in the study. LiPc, LiPc-α-PhS, LiNc, LiNc-BuO, and LiNc-PeO showed a response time of 3.3 ms (300 Hz) or better in air. On the other hand, LiNc-HeO, LiPc-α-PhO, and charcoal showed a response time of 3.4 ± 0.2, 6.7 ± 0.5, and 4.8 ± 0.3 ms, respectively, in air. Since biological oximetry applications require the use of the probe under aqueous conditions, the response times of the probes suspended in PBS were evaluated. As summarized in Table 2, there was no change in the response times of LiNc and LiNc-BuO in PBS when compared to that in air. LiPc, LiPc-α-PhS, and LiNc-HeO exhibited a response time of 5.0 ± 0.3 ms in PBS, which was significantly lower when compared to their response in air. LiPc-α-PhO and charcoal did not respond above 20 ± 0.4 ms (50 ± 10 Hz) when suspended in PBS.
Table 2.
Response time of the particulate oximetry probes: raw particles in air, PBS suspension, and sonicated PBS suspension
| Probe | Response time (ms) | ||
|---|---|---|---|
| In air | In PBS | Sonicated/PBS | |
| LiPc | <3.3 | 5.0 ± 0.3 | >1000 |
| LiPc-α-PhO | 6.7 ± 0.5 | 20 ± 0.4 | NA |
| LiPc-α-PhS | <3.3 | 5.0 ± 0.3 | NA |
| LiNc | <3.3 | <3.3 | 20 ± 0.4 |
| LiNc-BuO | <3.3 | <3.3 | <3.3 |
| LiNc-PeO | <3.3 | <3.3 | NA |
| LiNc-HeO | <3.4 ± 0.2 | 5.0 ± 0.3 | NA |
| Charcoal | <4.8 ± 0.3 | 20 ± 0.4 | >1000 |
A unique application of the particulate probes is their use for measuring intracellular pO2 in cell suspensions and tissues [19–21]. Intracellular measurement requires cellular internalization of the probes by co-incubation of cells with particulates on the order of 1.0 µm or smaller in size, which facilitates uptake by the cells [7]. The size reduction of the probe is achieved by sonication of the raw particulates. The effect of breaking up the crystals on the response time was evaluated for LiPc, LiNc, LiNc-BuO, and charcoal. Sonication was performed on probes suspended in PBS as described in the Methods section. As shown in Table 2, LiNc-BuO showed a response time of 3.3 ms (300 Hz) or better. Sonicated LiNc showed a significantly reduced response time (20 ± 0.4 ms) when compared to raw probe in air or in PBS. Interestingly, sonicated LiPc and charcoal in suspension did not respond to changes in pO2 at any of the frequencies tested [22].
4. Discussion
A novel procedure based on an oscillator-driven speaker–diaphragm was developed for accurate determination of response time of some commonly used particulate probes for EPR oximetry. The procedure was validated using an in-line pressure-sensor and control samples. In general, all the probes tested in this study demonstrated a rapid response (~3 ms) to changes in oxygen partial pressure. The response time was dependent on size and nature of suspension of the probe. The response time of LiNc and it’s derivative LiNc-BuO was largely unaffected after sonication or after suspension in aqueous solution. On the other hand, significant reduction in oxygen response was observed in the case of sonicated LiPc and charcoal, apparently due to loss of structural integrity upon sonication [22].
The particulate probes were found to have a rapid response to fluctuations in pO2, with some responding faster than 300 Hz. DPPH, whose lineshape is oxygen-insensitive, showed no EPR response to oxygen modulation. The FT analysis of EPR and pressure-sensor data clearly demonstrated that the pressure-modulation frequency was faithfully reproduced by the oxygen-sensitive LiNc probe at up to 300 Hz. Thus, pressure modulations at a particular frequency in the closed chamber are reproduced as changes in the EPR linewidth of the oxygen-sensitive probe, but not in a non-oximetry probe.
It was observed, however, that the pressure-sensor data were less noisy than the EPR data. The noise in EPR data can be attributed to instrumentation, rather than the probe. The strong and precise FT EPR peaks at the pressure-modulation frequencies support this claim. Since the speaker and piston assembly has its own frequency response, the change in pO2 achieved using the speaker was higher at lower frequencies which may be a contributing factor for poor SNR at higher frequencies. Some other issues and concerns are discussed in Section 5.
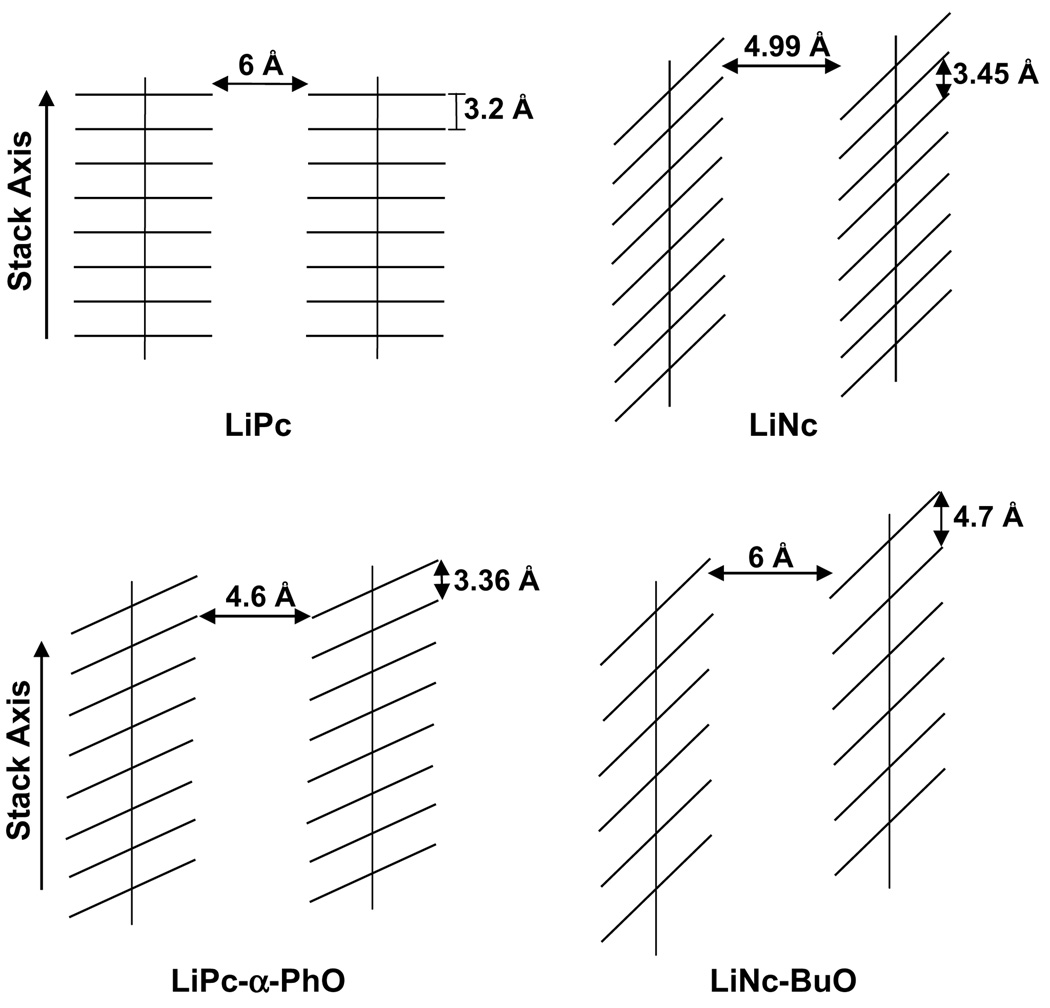
The crystalline probes used in this study are characterized with columnar packing of phthalocyanine or naphthalocyanine molecules resulting in void channel (bores) running parallel to the stack axis (Fig. 6). The cross-sectional dimension of the channels is large enough to enable oxygen molecules (size 2.8 Å × 3.9 Å) to diffuse freely in and out of the crystal lattice. LiPc has a tetragonal columnar packing with a channel size of 6 Å and an interplanar distance of 3.2 Å [11]. Since, the oxygen molecule has a size of 2.8 Å × 3.9 Å, the packing structure is no hindrance to rapid movement of oxygen molecules across the channel. LiNc, has a triclinic structure, with a channel opening of 4.99 Å × 5.5 Å [6]. The molecules are also aligned at an angle of 24.35° with the vertical axis (see Fig. 1). LiNc-BuO has the largest channel opening of 10 Å × 6 Å, arranged in triclinic format with an interplanar distance of 4.7 Å [12].
Fig. 6.
Representation of columnar stacking arrangements in particulate probes. The smallest cross-sectional channel dimensions for LiPc, LiPc-α-PhO, LiNc, and LiNc-BuO are shown. In general the channels are wide enough for the diffusion of free oxygen molecules (size: 2.8 Å × 3.9 Å) into the lattice. Of the probes shown, LiPc-α-PhO has the smallest bore size (4.6 Å), which may hinder fast movement of oxygen molecule.
LiPc-α-PhO, with a channel size 4.6 Å × 8.7 Å, is smaller than LiPc or even LiNc in terms of bore size [13]. In addition, the molecules are aligned at a angle of 55.9° and the stacking in LiPc-α-PhO is such that there is an increase in the stacking distance (3.36 Å) as compared to LiPc [13]. The angle of stacking, along with a smaller channel size and lining with phenoxy groups may result in the lower response time (6.7 ms) for LiPc-α-PhO when compared to LiPc. With respect to the other three crystalline probes (LiNc-PeO, LiNc-HeO, and LiPc-α-PhS), no information on the channel size or stacking is available as of now. The sonication data reveal that the oxygen response of LiNc-BuO is not affected upon size-reduction by sonication. We have previously shown that the oxygen sensitivity of LiNc-BuO was not affected upon size reduction (270 ± 50 µm) by sonication [7]. It is interesting to note that the sonicated LiPc did not respond to oxygen modulation. We have recently reported that LiPc looses its oxygen sensitivity after sonication [22]. This was attributed to longitudinal slicing of channels (thus, loss of channel structure) and consequently, loss of oxygen sensitivity [22]. Also, the loss of response to oxygen in the case of sonicated charcoal could be due to destruction of pore structures. We also observed a significant decrease in the oxygen sensitivity of sonicated charcoal (data not shown).
5. Limitations
With the current hardware/software set, it is possible to use pressure-modulation frequencies up to 791 Hz without violating the Nyquist criteria. However, noise considerations did not allow the use of frequencies greater than 300 Hz. The nonlinear frequency response of the speaker and difficult-to-quantify noise sources in the spectrometer made it challenging to characterize the complete frequency response of the probes, in the form of Bode plots. However, from the application point of view, the mere determination of whether the probe responds to changes of 300 Hz may be considered adequate. Another limitation is that the experimental setup, based on change of volume resulting in change of pO2, limits the change in magnitude of pO2. For example, due to the restricted mechanical movement of the speaker and piston assembly, it was not possible to generate pressure changes larger than 30–40 mmHg. In fact, it is difficult to control the magnitude change of pO2 frequencies due to a lack of control over the mechanical movement of the speaker cone. Nevertheless, the properties evaluated in this study should be adequate for use in experiments in biological systems for which dynamic pO2 measurements are necessary.
6. Conclusions
The data obtained in this study shows that the commonly used particulate oximetry probes LiPc, LiNc, as well as LiNc-BuO can re-spond to changes in pO2 as fast as 3.3 ms (300 Hz). Other crystalline probes (LiPc-α-PhO) exhibited slower response, which can be attributed to a smaller channel size and a stacking that hinders fast movement of oxygen through the channels. The response time established here will widen the use of these probes, especially LiNc-BuO, for applications where monitoring of rapid fluctuations in pO2 is desired. In addition, the information from the experimental data will help in understanding the structure and behavior of particulate oximetry probes that may be useful in their future design, modification, and synthesis.
Acknowledgments
This work was supported by NIH Grants EB004031. We thank Brian Rivera for technical assistance and critical reading of the manuscript.
References
- 1.Swartz HM, Dunn JF. Measurements of oxygen in tissues: overview and perspectives on methods. Adv. Exp. Med. Biol. 2003;530:1–12. doi: 10.1007/978-1-4615-0075-9_1. [DOI] [PubMed] [Google Scholar]
- 2.Vikram DS, Bratasz A, Ahmad R, Kuppusamy P. A comparative evaluation of EPR and OxyLite oximetry using a random sampling of pO2 in a murine tumor. Radiat. Res. 2007;168:308–315. doi: 10.1667/RR0854.1. [DOI] [PMC free article] [PubMed] [Google Scholar]
- 3.Bratasz A, Pandian RP, Ilangovan G, Kuppusamy P. Monitoring oxygenation during the growth of a transplanted tumor. Adv. Exp. Med. Biol. 2006;578:375–380. doi: 10.1007/0-387-29540-2_58. [DOI] [PubMed] [Google Scholar]
- 4.Ilangovan G, Bratasz A, Kuppusamy P. Non-invasive measurement of tumor oxygenation using embedded microparticulate EPR spin probe. Adv. Exp. Med. Biol. 2005;566:67–73. doi: 10.1007/0-387-26206-7_10. [DOI] [PubMed] [Google Scholar]
- 5.Vikram DS, Zweier JL, Kuppusamy P. Methods for noninvasive imaging of tissue hypoxia. Antioxid. Redox Signal. 2007;9:1745–1756. doi: 10.1089/ars.2007.1717. [DOI] [PubMed] [Google Scholar]
- 6.Ilangovan G, Manivannan A, Li H, Yanagi H, Zweier JL, Kuppusamy P. A naphthalocyanine-based EPR probe for localized measurements of tissue oxygenation. Free Radic. Biol. Med. 2002;32:139–147. doi: 10.1016/s0891-5849(01)00784-5. [DOI] [PubMed] [Google Scholar]
- 7.Pandian RP, Parinandi NL, Ilangovan G, Zweier JL, Kuppusamy P. Novel particulate spin probe for targeted determination of oxygen in cells and tissues. Free Radic. Biol. Med. 2003;35:1138–1148. doi: 10.1016/s0891-5849(03)00496-9. [DOI] [PubMed] [Google Scholar]
- 8.Ilangovan G, Liebgott T, Kutala VK, Petryakov S, Zweier JL, Kuppusamy P. EPR oximetry in the beating heart: myocardial oxygen consumption rate as an index of postischemic recovery. Magn. Reson. Med. 2004;51:835–842. doi: 10.1002/mrm.20000. [DOI] [PubMed] [Google Scholar]
- 9.Khan N, Williams BB, Hou H, Li H, Swartz HM. Repetitive tissue pO2 measurements by electron paramagnetic resonance oximetry: current status and future potential for experimental and clinical studies. Antioxid. Redox Signal. 2007;9:1169–1182. doi: 10.1089/ars.2007.1635. [DOI] [PMC free article] [PubMed] [Google Scholar]
- 10.Swartz HM, Dunn J, Grinberg O, O’Hara J, Walczak T. What does EPR oximetry with solid particles measure—and how does this relate to other measures of pO2? Adv Exp. Med. Biol. 1997;428:663–670. doi: 10.1007/978-1-4615-5399-1_93. [DOI] [PubMed] [Google Scholar]
- 11.Ilangovan G, Zweier JL, Kuppusamy P. Mechanism of oxygen-induced EPR line broadening in lithium phthalocyanine microcrystals. J. Magn. Reson. 2004;170:42–48. doi: 10.1016/j.jmr.2004.05.018. [DOI] [PubMed] [Google Scholar]
- 12.Pandian RP, Youngil K, Woodward P, Zweier JL, Manoharan PT, Kuppusamy P. The open molecular framework of paramagnetic lithium octabutoxy-naphthalocyanine: implications for the detection of oxygen and nitric oxide using EPR spectroscopy. J. Mater. Chem. 2006;16:3609–3618. [Google Scholar]
- 13.Pandian RP, Dolgos M, Dang V, Sostaric JZ, Woodward PM, Kuppusamy P. Structure and oxygen-sensing paramagnetic properties of a new lithium 1,8,15,22-tetraphenoxyphthalocyanine radical probe for biological oximetry. Chem. Mater. 2007;19:3545–3552. [Google Scholar]
- 14.Pandian RP, Dang V, Manoharan PT, Zweier JL, Kuppusamy P. Effect of nitrogen dioxide on the EPR property of lithium octa-n-butoxy 2,3-naphthalocyanine (LiNc-BuO) microcrystals. J. Magn. Reson. 2006;181:154–161. doi: 10.1016/j.jmr.2006.04.004. [DOI] [PubMed] [Google Scholar]
- 15.Grinberg OY, Williams BB, Ruuge AE, Grinberg SA, Wilcox DE, Swartz HM, Freed JH. Oxygen effects on the EPR signals from wood charcoals: experimental results and the development of a model. J. Phys. Chem. B. 2007;111:13316–13324. doi: 10.1021/jp072656l. [DOI] [PubMed] [Google Scholar]
- 16.Jordan BF, Baudelet C, Gallez B. Carbon-centered radicals as oxygen sensors for in vivo electron paramagnetic resonance: screening for an optimal probe among commercially available charcoals. Magma. 1998;7:121–129. doi: 10.1007/BF02592236. [DOI] [PubMed] [Google Scholar]
- 17.Pandian RP, Kuppusamy P. Synthesis, characterization and oxygen sensing properties of lithium octa-n-hexoxy-naphthalocyanine (LiNc-HexO), lithium octa-n-pentoxy-naphthalocyanine (LiNc-PeO), and lithium 1,8,15,22-tetraphenylthiophthalocyanine (LiPc-α-SPh) 2008 unpublished results. [Google Scholar]
- 18.Sostaric JZ, Mulvaney P, Grieser F. Sonochemical dissolution of MnO2 colloids. J. Chem. Soc. Faraday Trans. 1995;91:2843–2846. [Google Scholar]
- 19.Kutala VK, Khan M, Angelos MG, Kuppusamy P. Role of oxygen in postischemic myocardial injury. Antioxid. Redox Signal. 2007;9:1193–1206. doi: 10.1089/ars.2007.1636. [DOI] [PubMed] [Google Scholar]
- 20.Pandian RP, Kutala VK, Parinandi NL, Zweier JL, Kuppusamy P. Measurement of oxygen consumption in mouse aortic endothelial cells using a microparticulate oximetry probe. Arch. Biochem. Biophys. 2003;420:169–175. doi: 10.1016/j.abb.2003.09.008. [DOI] [PubMed] [Google Scholar]
- 21.Springett R, Swartz HM. Measurements of oxygen in vivo: overview and perspectives on methods to measure oxygen within cells and tissues. Antioxid. Redox Signal. 2007;9:1295–1301. doi: 10.1089/ars.2007.1620. [DOI] [PubMed] [Google Scholar]
- 22.Sostaric JZ, Pandian RP, Weavers LK, Kuppusamy P. Formation of lithium phthalocyanine nanotubes by size reduction using low- and high-frequency ultrasound. Phys. Chem. Mater. 2006;18:4183–4189. [Google Scholar]
- 23.Gallez B, Swartz HM. In vivo EPR: when, how and why? NMR Biomed. 2004;17:223–225. doi: 10.1002/nbm.913. [DOI] [PubMed] [Google Scholar]
- 24.Swartz HM. Measuring real levels of oxygen in vivo: opportunities and challenges. Biochem. Soc. Trans. 2002;30:248–252. doi: 10.1042/. [DOI] [PubMed] [Google Scholar]


