Abstract
Amine modification of filamentous virions (phage particles) is widely used in phage display technology to couple small groups such as biotin or fluorescent dyes to the major coat protein pVIII. We have developed a generalized kinetic model for protein amine modification and applied it to the modification of pVIII with biotin and the near-infrared fluorophor Alexa Fluor 680. Empirically optimized kinetic parameters for the two modification reactions allow the modification level to be predicted for a wide range of virions and modifying reagent concentrations. Virions with 0.03 biotins per pVIII subunit have 50% of the maximal binding capacity for a streptavidin conjugate.
Keywords: phage display, biotin, fluorescence, N-hydroxysuccinimide ester, reaction kinetics
Introduction
Filamentous phages of the Ff class (derivatives of natural strains fd, f1 and M13) are the most common vectors in phage display technology (1). A foreign peptide or protein domain is fused genetically to one of the phage coat proteins: in most cases, either to 1 to 5 copies of the minor coat protein pIII, or to 1 to ~150 copies of the major coat protein pVIII. The foreign protein or domain is thereby displayed on the outer surface of the virion, where it is accessible to antibodies, receptors, or other solutes in the medium. Random peptide libraries (RPLs)—large populations of virions collectively displaying millions or billions of random peptides—are a rich source of high-affinity peptide ligands for a great diversity of target biomolecules. Such ligands can be specifically affinity-selected from the RPL by using the target biomolecule as an immobilized selector. Analogously, specific peptide ligands—for target cells such as cancer cells, or for defined tissues in vivo such as tumors—can be affinity-selected using intact cells (2) or tissues in living animals (3) as selectors.
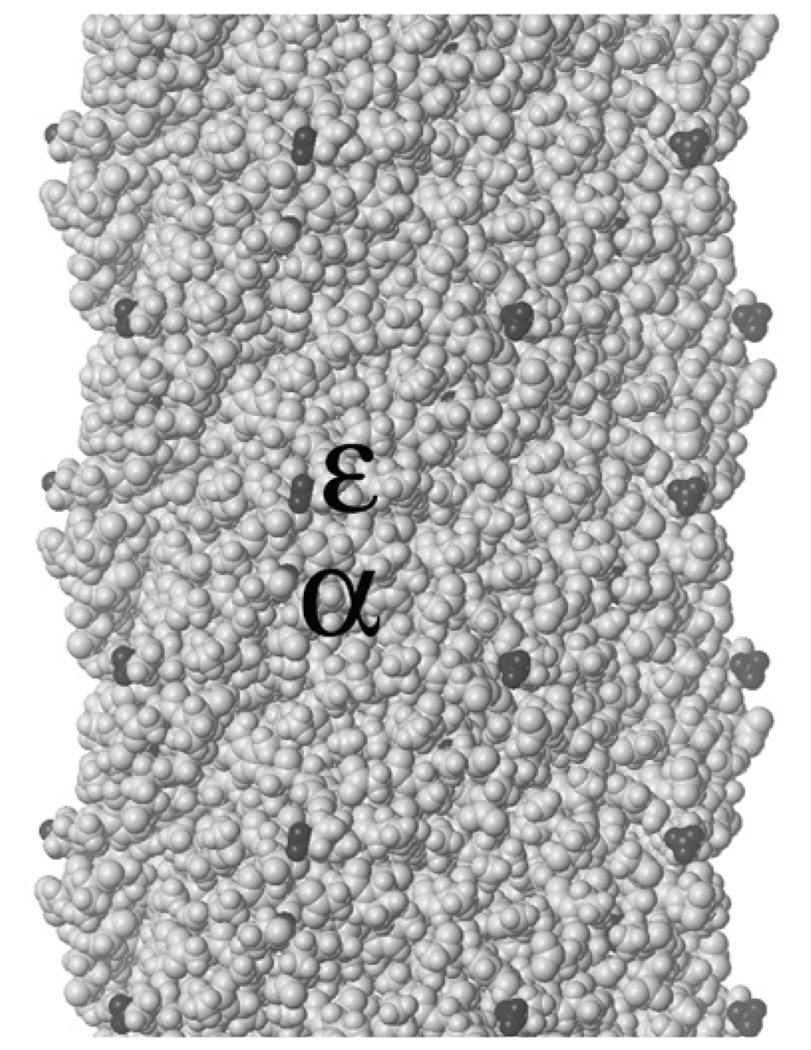
As shown in Figure 1, the filamentous virion has thousands of surface-exposed ε-amino groups—one on each subunit of the major coat protein pVIII (4,5)—to which small chemical groups may be coupled without impairing structural integrity or infectivity (6). The α-amino groups on the pVIII subunits, though mostly buried in the structural model in Figure 1 and unreactive with acetimidate at pH 10.0 (6), may be reactive with amine-reactive reagents other than acetimidate. The ability to modify surface amines can be exploited in many research contexts. For instance, virions bearing tumor-avid peptides can be lightly modified with biotin and used to image tumors in vivo by a two-step “pretargeting” regimen (7). In the first step, tumor-bearing mice are injected with the biotinylated virions. In the second step—initiated only after non-tumor-bound virions have been allowed to clear—the mice are injected with 111In-labeled streptavidin. The labeled streptavidin binds tightly to the tumor-targeted biotinylated virions, allowing the tumor to be imaged by single-photon emission computed tomography. Similarly, virions bearing tumor-avid peptides and lightly modified with near-infrared (NIR) fluorophors can be used to image tumors optically in vivo (8).
Figure 1.
Space-filling model (including hydrogens) of a short section of the tubular sheath of filamentous bacteriophage fd (Protein Data Bank accession no. 2C0X, pdb.org; see References 4 and 5), with amino groups highlighted in black. The section depicted includes all or parts of 30 pVIII subunits (out of 2700 for wild-type virions, 4000 or more for some phage-display constructs), each with a highly exposed ε-amino group on the lysine at position 8 and a mostly buried α-amino group on the N-terminal alanine; only some of the α-amino groups are partly visible in the image. The overall diameter of the sheath is ~6 nm.
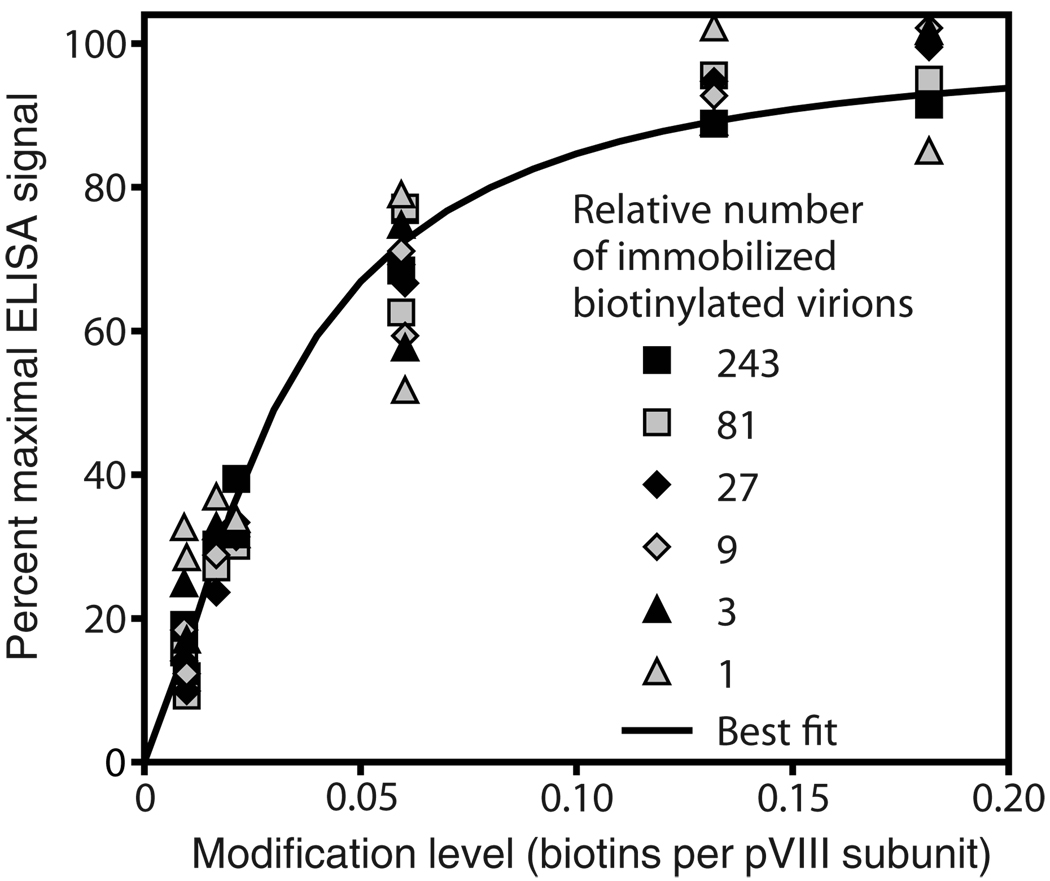
Success in such experiments requires that the exposed amines be modified to a sufficient level for the purpose at hand while avoiding the ill effects of over-modification, including detrimentally changing the virion’s physical properties or sterically hindering specific biding by its displayed peptides. The effect of modification level is well illustrated with biotinylated virions. Figure 2 shows a saturation curve for a streptavidin conjugate binding to virions biotinylated to various levels. According to that curve, virions reach half their maximum binding capacity at a modification level of about 0.03 biotins per pVIII subunit. That number would be an appropriate target modification level for almost all applications.
Figure 2. Saturation curve for the binding of a streptavidin conjugate to biotinylated virions.
Virions biotinylated to various levels were mixed with non-biotinylated virions at ratios ranging from 1:242 to 1:59048 in TBS, and 100-µL volumes containing a total of 2 × 10¹¹ virions were adsorbed overnight at 4°C to wells of a polystyrene 96-well ELISA dish. In these circumstances, the relative number of biotiny-lated virions immobilized per well is proportional to the ratio of biotinylated to total virions, regardless of biotinylation level; those relative numbers are given in the figure. Wells were washed, reacted for 30 min at room temperature with 100 µL of an alkaline phosphatase-streptavidin conjugate (Catalog no. 016–050–084, Jackson ImmunoResearch, West Grove, PA, USA) at 200 ng/mL in TBS/Tween (TBS supplemented with 0.5% Tween 20), washed, and developed and analyzed on a plate reader as described (12). Data were fitted to theoretical saturation curves of the form Signal = Smax /[1 + (m1/2 / m)n], where the independent variable is m (modification level, in biotins per pVIII subunit); the adjustable curve shape parameters are m1/2 (modification level resulting in half-maximal ELISA signal), n (arbitrary positive exponent determining steepness of the curve), and Smax (estimated maximal ELISA signal). The parameters m1/2 and n were constrained to be identical for all six data series (corresponding to the six relative numbers of immobilized biotinylated virions). Each data series was then normalized relative to a maximal theoretical ELISA signal Smax = 100, all six best-fit theoretical saturation curves thereby becoming identical. This normalized best-fit theoretical saturation curve is the solid line in the graph. All the normalized data fit fairly well to this theoretical saturation curve, implying that the curve mainly reflects the binding capacity of individual virions, not the binding capacity of entire ELISA wells.
It is desirable to be able to achieve a specific target modification level without a laborious series of pilot modifications. In this article, building on previous work (9), we develop a generalized kinetic model for protein amine modification that uses the results of test reactions at a few protein and reagent concentrations to calculate the expected results of similar modification reactions over a vast continuum of other protein and reagent concentrations. Modifications of filamentous phage pVIII with biotin and the NIR fluorophor Alexa Fluor 680 (AF680) serve as examples, but the model is applicable to any protein and amine-modifying reagent.
Materials and methods
Two N-hydroxysuccinimide (NHS) esters were chosen as amine-reactive reagents: the biotinylating reagent NHS-PEO4-biotin (Catalog no. 21329; Pierce Chemical Co., Rockford, IL, USA), and the NIR fluorophor labeling reagent sulfo-NHS-AF680 (Catalog no. A20008; Invitrogen, Carlsbad, CA, USA). The pre-weighed reagents were dissolved just before use in dimethyl sulfoxide (DMSO) to a range of concentrations (up to 17.4 mM sulfo-NHS-AF680; up to 34 mM NHS-PEO4-biotin).
1.33 × 10¹³ fd virions (equivalent to 59.7 nmol pVIII subunits) in calcium- and magnesium-free buffer (CMF; 136.9 mM NaCl, 2.68 mM KCl, 8.1 mM Na2HPO4, 1.47 mM KH2PO4, pH adjusted to 7.2 with HCl or NaOH) were diluted with additional CMF to total volumes ranging 108–639 µL. Then 1/9 volume of 1 M NaH2PO4 (pH adjusted to 7.00 with NaOH) and up to 1/50 volume of reagent (either NHS-PEO4-biotin or sulfo-NHS-AF680) in DMSO were added. The vessels were vortexed immediately. Reactions were allowed to continue overnight (~12–18 h) at room temperature in the dark; in view of the high reactivity of NHS esters, this was deemed sufficient time for the reactions to go to completion. Meanwhile, in order to determine the actual concentration of sulfo-NHS-AF680 reagent, 2 µL of the same fresh reagent stock solution used for the phage reactions (nominally 17.4 mM reagent in DMSO) were mixed with 120 µL of 10.67 mM lysine in 0.1 M NaH2PO4, pH adjusted to 7.0 with NaOH. After overnight reaction in the dark, the reaction mixture was diluted 160-fold in CMF and its dye content measured spectrophoto-metrically, assuming a molar extinction coefficient of 184,000 at 678 nm (as reported by the supplier); reactive dye was assumed to constitute 95% of total dye, in accordance with the reagent’s certificate of analysis. The sulfo-NHS-AF680 concentrations reported here were based on this determination.
The biotinylation reactions were diluted to 3 mL with Tris-buffered saline (TBS; 150 mM NaCl, 50 mM Tris, pH adjusted to 7.5 with HCl), dialyzed ~12 h each against 3 changes of TBS in Slide-A-Lyzer cassettes with a nominal molecular weight cutoff of 10 kDa (Catalog no. 66380, Pierce Chemical Co.), concentrated to ~50 µL by centrifugation through Centricon ultrafiltration devices with a nominal molecular weight cutoff of 100 kDa [Catalog no. 4212; Millipore Corporation, Billerica, MA, USA (no longer available, but an essentially equivalent substitute is the Vivaspin 2 centrifugal concentrator, Catalog no. VS0241 or VS0242; Sartorius Stedim Biotech, Goettingen, Germany)], and diluted with 100 µL TBS. Dialysis was found to remove only ~94% of the uncoupled biotin, but ultrafiltration essentially removed the remaining uncoupled biotin. Portions of the biotinylated virions were diluted 1/20 with TBS and scanned spectrophotometrically from 220 nm to 320 nm; the concentration in virions/mL was calculated as A269 × 6 × 1016/6408 (where 6408 is the number of nucleotides in the fd viral DNA molecule) (10,11). The content of coupled biotin was quantified as described (9) by proteinase K digestion (to cleave coupled biotin from the virions), centrifugation through Centricon ultrafiltration devices with a nominal molecular weight cutoff of 10 kDa (Catalog no. 4206; Millipore; equivalent to Catalog nos. V50101 or V50102; Sartorius Stedim Biotech), to separate free biotin in the filtrate from virions and proteinase K in the retentate, and duplicate competition ELISA with the filtrates.
Reactions with sulfo-NHS-AF680 were diluted to 1 mL with CMF and the virions freed of uncoupled AF680 by three successive precipitations with polyethylene glycol (12) and two cycles of concentration from 1.8 mL to ~50 µL by centrifugation through Centricon ultrafiltration devices with a nominal molecular weight cutoff of 100 kDa as described in the previous paragraph. (Dialysis was ineffective for this purpose, only removing ~60% of the uncoupled dye.) No AF680 was detectable spectrophotometrically in the final Centricon filtrate, indicating that uncoupled fluorophor had been completely removed. Portions of the AF680-labeled virions were diluted 1/25 with CMF and scanned spectro-photometrically at 220–320 nm; and undiluted or 1/10 dilutions were scaned at 630–730 nm. AF680 content was calculated assuming a molar extinction coefficient of 184,000 at 679 nm; virion content was calculated from absorbance at 269 nm as in the previous paragraph (10,11) after subtracting 2.5% of the absorbance at 679 nm to correct for UV absorbance by AF680 (based on supplier’s data).
Results and discussion
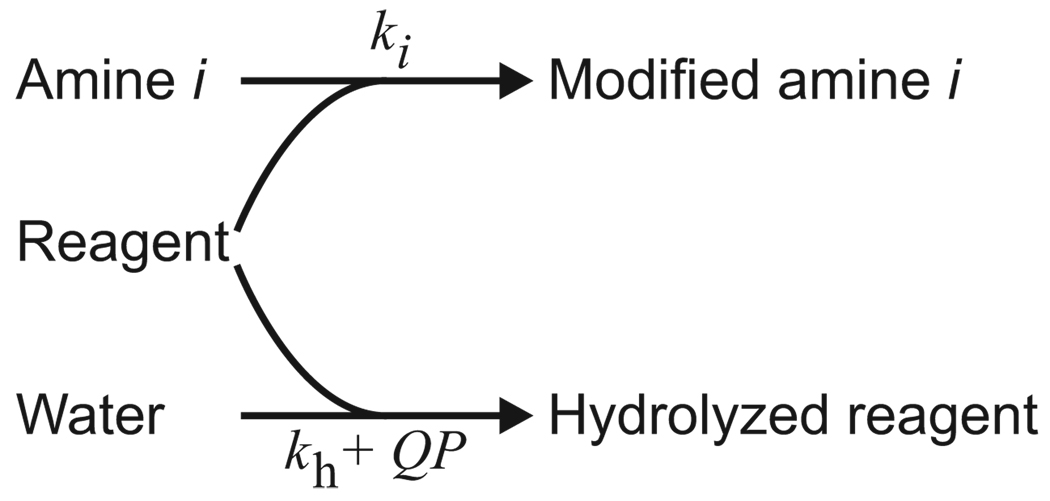
The assumed pathways for irreversible modification of amines and consumption of amine-reactive reagent by hydrolysis are diagrammed in Figure 3. The protein molecule is treated as a collection of independently reacting amines, each corresponding to a particular amino group (α or ε) at a particular site in the protein structure. The top arrow represents the desired reaction, in which protein amines are modified by reaction with the reagent. Unlike the single-amine kinetic model published earlier (9), the generalized model presented here accommodates multiple amino groups reacting with the reagent with different second-order rate constants ki (µM−1 sec−1). It will be convenient in what follows to index those amines in order of reactivity (ki+1 ≤ ki); this indexing convention ensures that k1, the largest rate constant, is greater than zero (assuming modification is possible at all). If there is a set of amino groups in the protein molecule that can be assumed to be kinetically equivalent (i.e., that react with the same second-order rate constant), they can be bundled together and treated as a single amine j with a copy number Mj equal to the number of individual amines in the bundle (the copy number for an individual unbundled amine is 1). Competing with amine modification, and represented by the bottom arrow in Figure 3, is the hydrolysis of reagent to its unreactive hydrolyzed form. As before (9), hydrolysis is assumed to proceed in two independent, additive ways: by a protein-independent pathway with a first-order rate constant kh (sec−1), and by a protein-mediated pathway at a rate that is proportional to the protein concentration P (µM) with a second-order rate constant 𝒬(µM−1 sec−1). As a catalyst of hydrolysis, the protein is presumed to remain at the same effective concentration P throughout the reaction despite its growing amine modification level. The state of the system at completion of the reaction, when all reagent is consumed, can depend only on the timeless ratios of the rate constants, reducing the number of independent kinetic parameters to N + 1, where N is the number of amines or amine bundles. We have chosen the ratios kh/k1 (µM), 𝒬/k1 (dimensionless) and ki/k1 (dimensionless; i = 2, 3,…, N). Since k1>0 according to the indexing convention, all these ratios exist, though some may be 0. Under the foregoing assumptions, the modification level m (number of modified amines per protein molecule) at completion of the reaction of protein at concentration P with reagent at initial concentration R (µM) is given by
where λ is the root of the function
| [Eq.1] |
The derivation of Equation 1 and guidance for computing the root λ by the Newton-Raphson method are given in the Supplementary Materials.
Figure 3. Reaction scheme for modification of amines and consumption of reagent by hydrolysis.
The symbols above and below the arrows are the rate constants for the pathways (see text “Results and discussion”).
The foregoing generalized kinetic model does not specify the values of the kinetic parameters in Equation 1. Those parameter values must instead be determined empirically for each protein reacting with each reagent under given reaction conditions (buffer and temperature). To that end, a series of test reactions is carried out in which the protein at a range of concentrations P is reacted with reagent at a range of initial concentrations R under the given reaction conditions, the resulting final modification level m being measured in each case. The values of the kinetic parameters are then adjusted so as to optimize the overall agreement between the theoretical modification levels calculated from Equation 1 and the modification levels actually observed in the test series. Once optimal parameter values have been determined, the results of the test series reactions can be extrapolated to reactions at quite different protein and initial reagent concentrations. Most frequently, the user will want to know the initial reagent concentration R required to achieve a given target modification level m when the protein concentration is P. Rearranging Equation 1, the required initial reagent concentration R can be calculated as
where λ is the root of the function
| [Eq.2] |
In the case of filamentous virions, the effective protein concentration P is the total concentration of pVIII subunits—bearers of more than 98% of the virion’s accessible amines. There are two amines per subunit, each with a copy number of 1. No assumption is (or need be) made about which amine is more reactive; thus whether amine 1 is the α or ε amino group remains unspecified.
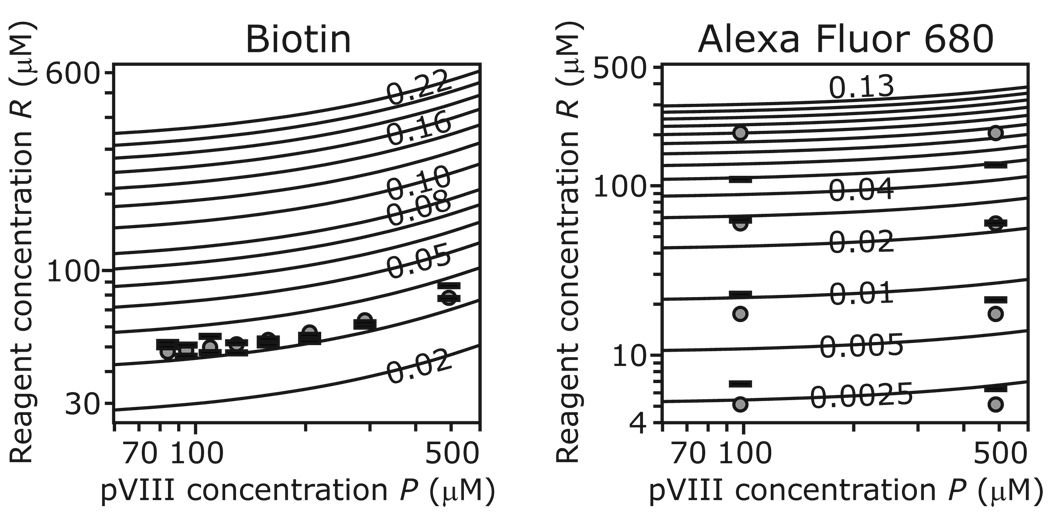
Results of test modification reactions with NHS-PEO4-biotin and sulfo-NHS-AF680 are shown in panels A and B of Figure 4, respectively. The solid lines are isomodification contours predicted by Equation 2 for the optimized values of the adjustable parameters given in Table 1. Each contour corresponds to a particular modification level m; each point on the contour gives a combination of pVIII and initial reagent concentrations predicted to yield that modification level. Superimposed on the contours are the test reaction data, on which the optimized parameter values are based. For each test reaction, the gray circle marks the actual concentrations of pVIII and reagent, while the horizontal bars plot the initial reagent concentration R that, according to Equation 2 with the optimized parameter values, would theoretically be required achieve the modification level actually measured for that reaction (one bar for each of the duplicate determinations of biotinylation level in panel A).
Figure 4. Modification of fd virions with NHS–PEO4-biotin (A) and sulfo-NHS-AF680 (B).
The solid lines are isomodification contours (for biotin: modification m = 0.02 to 0.08 in steps of 0.01 and 0.10 to 0.22 in steps of 0.02; for Alexa Fluor 680: m = 0.0025, 0.005 and 0.01 to 0.13 in steps of 0.01) as predicted by Equation 2 for the optimized values of the adjustable parameters given in Table 1. The open circles and horizontal bars represent the test reaction data used to optimize those parameter values, as explained in “Results and discussion”).
Table 1.
Optimized Parameter Values for Phage pVIII Modification Reactions
| Reagent | Q/k1 | kh/k1 (µM) | k2/k1 |
|---|---|---|---|
| NHS-PEO4-biotin | 1.080 | 1274.1 | 0 |
| sulfo-NHS-AF680 | 0.2243 | 2054.5 | 0 |
The kinetic parameters in the last three columns were adjusted so as to minimize the overall deviation of the observed modification levels for the test reactions at various protein and initial reagent concentrations from the corresponding theoretical modification levels calculated with Equation 1 for those same protein and initial reagent concentrations. The metric for overall deviation was the sum of the squares of the logarithms of the ratios of observed to theoretical modification levels.
The closeness of the horizontal bars to each other in panel A testifies to the excellent reproducibility of the duplicate biotin determinations; the closeness of those bars to their corresponding gray circles testifies to the excellent fit of the observed data to the theoretical calculations over a wide range of pVIII concentrations. Independent IgG test reactions with different tubes of pre-weighed biotinylating reagent from the same batch gave entirely consistent results (9), and batch-to-batch consistency was also good (data not shown). Therefore, by using the optimized parameter values in Table 1, Equation 2 provides a reliable way to calculate the concentration of NHS-PEO4-biotin required to biotinylate virions to any chosen target level under the conditions of our test reactions.
The agreement between theory and data is reasonably high in panel B, though not as high as in panel A. The reliability of theoretical predictions for modification with the sulfo-NHS-AF680 reagent is not as well established as for biotinylation with NHS-PEO4-biotin, since batch-to-batch consistency has not yet been assessed. When using Equation 1 or 2 in conjunction with the optimized sulfo-NHS-AF680 parameter values in Table 1, the possibility of some deviation from expectation should be anticipated.
According to Equation 1 with the optimized phage biotinylation parameters in Table 1, the molar ratio of reagent to pVIII subunits required to biotinylate 60 µM pVIII to a level of 0.03 biotins per pVIII subunits is 0.71. If that same molar ratio is used to biotinylate 600 µM pVIII, the expected level is 0.158, which is more than 5 times higher. In general, the molar ratio of modifying reagent to target protein is a wholly inadequate description of reaction conditions for amine modifications; both protein and reagent concentrations must be specified individually (9). On the other hand, the concentration of reagent required to achieve a biotinylation level of 0.03 rises only 6.3% (from 39.4 µM to 42.0 µM) as the pVIII subunit concentration increases 5-fold from 10 µM to 50 µM. In general, the isomodification contours flatten out at the lowest target protein concentrations, as is evident in Figure 4. That flattening implies that a given reagent concentration will result in the same modification level for a wide range of target protein concentrations, as long as those concentrations are sufficiently low (9).
For both phage modifications reported in Table 1, the optimized value of k2/k1 was calculated as 0, implying that the original single-amine kinetic model (9) fits the data just as well as the generalized multi-amine model presented here. This is not significant evidence that there is only one reactive amine per pVIII subunit, however. Indeed, even if k2/k1 is constrained to have a value of 1 (i.e., if both α and ε amino groups are assumed to be equally reactive), adjustment of the other two parameters allows the predictions of Equation 1 to fit the observed modification levels nearly exactly as well as for the optimized parameter values, and makes discernible changes only in the highest isomodification contours. The advantage of the generalized multi-amine kinetic model over the original single-amine model, therefore, is only fully realized for test reactions covering a much broader range of reagent concentrations than were interrogated in the examples reported here.
Supplementary Material
Supplementary material for this article is available at www.BioTechniques.com/article/113074.
Acknowledgements
This work was supported by a National Cancer Institute (NCI) Center Grant (no. P50-CA-10313) to Wynn A. Volkert, a U.S. National Institutes of Health (NIH) research grant (no. R21CA127339) to G.P.S., and an NIH Clinical Biodetective training grant (no. R90DK071510). We thank Professor Thomas P. Quinn and the University of Missouri Structural Biology Core Facility for creating Figure 1 from the published atomic coordinates. This paper is subject to the NIH Public Access Policy.
Footnotes
The authors declare no competing interests.
References
- 1.Smith GP, Petrenko VA. Phage display. Chem. Rev. 1997;97:391–410. doi: 10.1021/cr960065d. [DOI] [PubMed] [Google Scholar]
- 2.Goodson RJ, Doyle MV, Kaufman SE, Rosenberg S. High-affinity urokinase receptor antagonists identified with bacteriophage peptide display. Proc. Natl. Acad. Sci. USA. 1994;91:7129–7133. doi: 10.1073/pnas.91.15.7129. [DOI] [PMC free article] [PubMed] [Google Scholar]
- 3.Pasqualini R, Ruoslahti E. Organ targeting in vivo using phage display peptide libraries. Nature. 1996;380:364–366. doi: 10.1038/380364a0. [DOI] [PubMed] [Google Scholar]
- 4.Marvin DA, Welsh LC, Symmons MF, Scott WR, Straus SK. Molecular structure of fd (f1, M13) filamentous bacteriophage refined with respect to X-ray fibre diffraction and solid-state NMR data supports specific models of phage assembly at the bacterial membrane. J. Mol. Biol. 2006;355:294–309. doi: 10.1016/j.jmb.2005.10.048. [DOI] [PubMed] [Google Scholar]
- 5.Straus SK, Scott WR, Symmons MF, Marvin DA. On the structures of filamentous bacteriophage Ff (fd, f1, M13) Eur. Biophys. J. 2008;37:521–527. doi: 10.1007/s00249-007-0222-7. [DOI] [PubMed] [Google Scholar]
- 6.Armstrong J, Hewitt JA, Perham RN. Chemical modification of the coat protein in bacteriophage fd and orientation of the virion during assembly and disassembly. EMBO J. 1983;2:1641–1646. doi: 10.1002/j.1460-2075.1983.tb01638.x. [DOI] [PMC free article] [PubMed] [Google Scholar]
- 7.Newton JR, Miao Y, Deutscher SL, Quinn TP. Melanoma imaging with pretargeted bivalent bacteriophages. J. Nucl. Med. 2007;48:429–436. [PubMed] [Google Scholar]
- 8.Newton JR, Kelly KA, Mahmood U, Weissleder R, Deutscher SL. In vivo selection of phage for the optical imaging of PC-3 human prostate carcinoma in mice. Neoplasia. 2006;8:772–780. doi: 10.1593/neo.06331. [DOI] [PMC free article] [PubMed] [Google Scholar]
- 9.Smith GP. Kinetics of amine modification of proteins. Bioconjug. Chem. 2006;17:501–506. doi: 10.1021/bc0503061. [DOI] [PubMed] [Google Scholar]
- 10.Day LA. Conformations of single-stranded DNA and coat protein in fd bacteriophage as revealed by ultraviolet absorption spectroscopy. J. Mol. Biol. 1969;39:265–277. doi: 10.1016/0022-2836(69)90316-7. [DOI] [PubMed] [Google Scholar]
- 11.Smith GP, Scott JK. Libraries of peptides and proteins displayed on filamentous phage. Methods Enzymol. 1993;217:228–257. doi: 10.1016/0076-6879(93)17065-d. [DOI] [PubMed] [Google Scholar]
- 12.Yu J, Smith G. Affinity maturation of phage-displayed peptide ligands. Methods Enzymol. 1996;267:3–27. doi: 10.1016/s0076-6879(96)67003-7. [DOI] [PubMed] [Google Scholar]
Associated Data
This section collects any data citations, data availability statements, or supplementary materials included in this article.
Supplementary Materials
Supplementary material for this article is available at www.BioTechniques.com/article/113074.


