Abstract
Electrical impedance tomography is being explored as a technique to detect breast cancer, exploiting the differences in admittivity between normal tissue and tumors. In this paper, the geometry is modeled as an infinite half space under a hand-held probe. A forward solution and a reconstruction algorithm for this geometry were developed previously by Mueller et al (1999 IEEE Trans. Biomed. Eng. 46 1379). In this paper, we present a different approach which uses the decomposition of the forward solution into its Fourier components to obtain the forward solution and the reconstructions. The two approaches are compared in terms of the forward solutions and the reconstructions of experimental tank data. We also introduce a two-layered model to incorporate the presence of the skin that surrounds the body area being imaged. We demonstrate an improvement in the reconstruction of a target in a layered medium using this layered model with finite difference simulated data. We then extend the application of our layered model to human subject data and estimate the skin and the tissue admittivities for data collected on the human abdomen using an ultrasound-like hand-held EIT probe. Lastly, we show that for this set of human subject data, the layered model yields an improvement in predicting the measured voltages of around 81% for the lowest temporal frequency (3 kHz) and around 61% for the highest temporal frequency (1 MHz) applied when compared to the homogeneous model.
Keywords: electrical impedance tomography, image reconstruction, forward modeling
1. Introduction
The rationale for exploring electrical impedance tomography (EIT) for breast cancer detection (Halter et al 2008, Cherepenin et al 2001, Kao et al 2008) is to exploit the differences between the admittivity spectra of normal tissue and those of tumors (Surowiec et al 1988, Jossinet 1998). The problem in EIT is to determine the distribution of tissue admittivity within the breast from measurements made on its surface. The forward problem in EIT is to determine the voltages or currents on the surface of the body, given the admittivity distribution inside the body and currents or voltages applied to the surface. The inverse problem is to reconstruct the admittivity distribution inside the body given the voltages and currents applied and measured on the surface of the body (Isaacson and Edic 1992). At Rensselaer we have developed the fourth generation adaptive current tomograph (ACT4), a high precision system for breast cancer imaging (Saulnier et al 2007). We have also developed a thorough calibration procedure for the system which includes compensation for the characteristics of the electrodes and cables. The system is very stable with SNR as high as 98–100 dB (Kao et al 2007). This system presently uses the Newton’s one-step error reconstructor (NOSER) algorithm for image reconstruction (Isaacson et al 1990). The reconstructor uses one step of Newton’s method with an initial guess of a constant admittivity, i.e., a homogeneous model (Choi et al 2004). ACT4 is used in the applied voltage mode where it applies voltages and measures both the voltages and currents. It has the ability to apply temporal frequencies at discrete steps between 3.3 kHz and 1 MHz. Before the reconstruction is performed, the measured voltage and current values are used to synthesize the voltages that would have resulted if a specified set of canonical current patterns (Gisser et al 1990) had been applied. These synthesized voltage data are used in the reconstruction algorithm. This approach is used because the nonzero output impedance of the voltage sources makes the actual applied voltages differ slightly from the desired values. Using this ‘pattern conversion’ process we are able to avoid having to solve the forward model for each set of applied voltages but, instead, are able to use results obtained for a single set of canonical current patterns.
EIT can be used in combination with other imaging modalities (Zou and Guo 2003) such as x-ray mammography (Assenheimer et al 2001, Cherepenin et al 2001) and ultrasound to improve tumor detection. We develop a dual system with EIT and ultrasound using a hand-held probe with a geometry similar to that of an ultrasound probe. An EIT reconstruction algorithm for this hand-held probe geometry was developed by Mueller who used the approximate Green’s theorem method to obtain the forward solution and reconstructions (Mueller et al 1999). In this paper, we use a different approach to solve the forward problem in which we express the forward solution as a decomposition of its Fourier components. We demonstrate the improvement that this Fourier approach produces over the Green’s theorem method, as measured by the agreement between the calculated and measured forward voltages. An improvement is also seen in the reconstruction of data collected from an experimental tank.
Our previous clinical studies have shown that the voltages measured from patients vary significantly from those predicted by a homogeneous forward model, especially at low temporal frequencies, i.e., ≤10 kHz. We have analyzed this issue previously for the mammography geometry which uses a pair of parallel planar electrode arrays and addressed it by introducing a layered forward model (Kulkarni et al 2008). In this paper, we introduce a two-layered forward model for the hand-held probe geometry to account for the different admittivity of the skin covering the portion of the body being imaged. The forward solution for the layered model is better than the homogeneous model at detecting a target embedded in a two-layered medium. We also collected data using an EIT hand-held probe on a human subject’s abdomen. We used these data to estimate the unknown skin and underlying tissue admittivities and to determine the parameters for the layered forward solution. We then compared the layered and homogeneous forward voltages for these human abdomen data and demonstrate the improvement that the two-layered forward model produces over the homogeneous forward model at all temporal frequencies with a pronounced improvement at low temporal frequencies.
2. Forward model
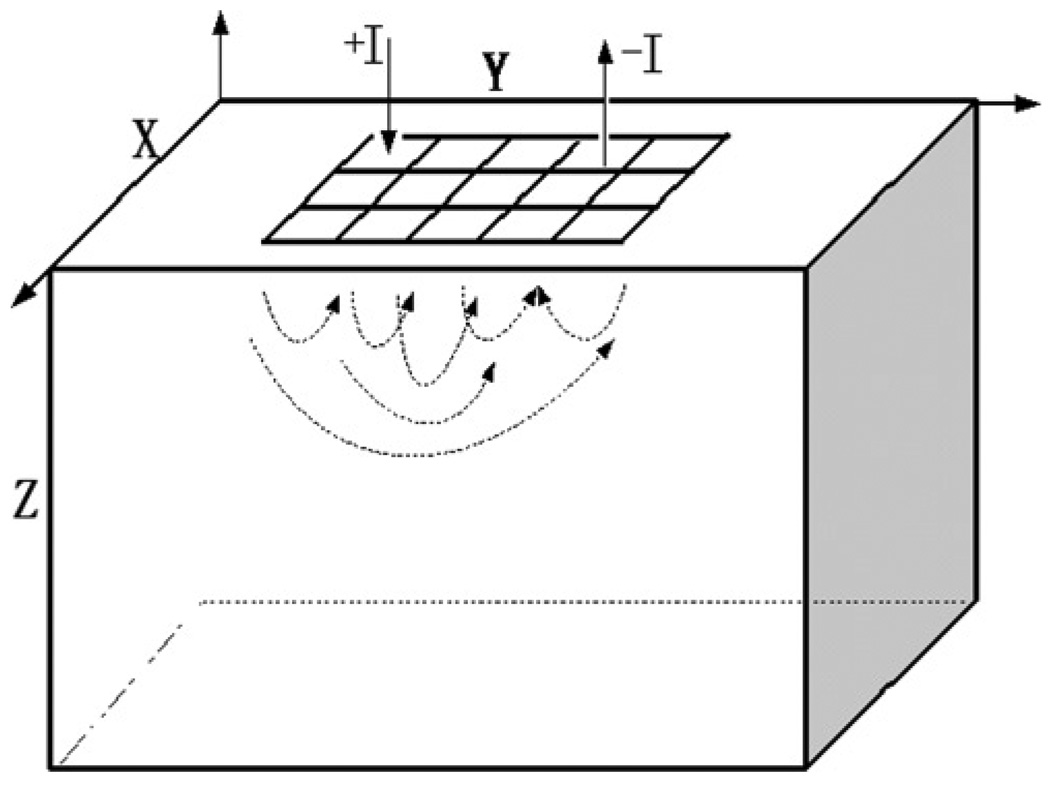
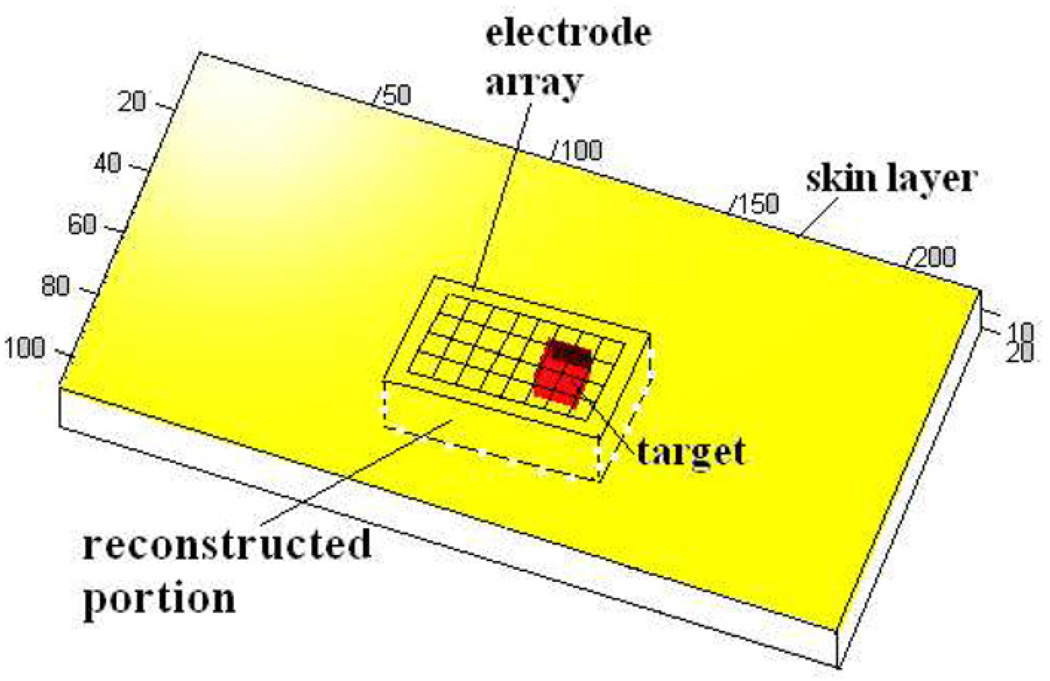
The hand-held probe allows the flexibility to move the probe along the surface of the region to be examined. In Mueller et al (1999), the EIT hand-held probe geometry is modeled as an infinite half space; the x and y coordinates range from −∞ to +∞ and the z coordinates range from 0 to +∞. The simplified geometry, adapted to perform a tank study to evaluate the performance of the EIT reconstruction algorithm, is finite in the x-, y- and z-directions, but with model and tank dimensions large enough in comparison to the electrode array dimensions to approximate an infinite half space. The model geometry has an electrode array placed on one surface of the body as shown in figure 1. The algorithm originally developed by Mueller has also been described in detail by (Kao 2005). This algorithm makes a few approximations, including approximating the rectangular electrodes by circular electrodes of the same area to reduce the equation complexity. If Al is the area of the rectangular electrodes, the circular electrodes are assumed to have a radius . Also, the forward voltage on an electrode is not calculated by taking the integral of the voltages at all points on the electrode and dividing by the electrode area as in the ave-gap model (Cheng et al 1989) but, instead, is taken as the voltage at the center of the electrode. We call the center of the lth electrode Ql. For current Il applied to the lth electrode, with a homogeneous admittivity distribution of γ0 within the body, the forward voltage on the lth electrode is given by
| (1) |
where l′ is any electrode other than l and is the center of the l′th electrode. These approximations contribute to increasing the error between the calculated forward voltages and the experimental voltages measured in a test tank.
Figure 1.
Approximation of the hand-held probe geometry.
3. Fourier forward solution
An improved forward model can be made by expressing the forward solution as a decomposition of its Fourier components as was done previously for the mammography geometry (Choi et al 2004). In this model, we also have the ability to better model the geometry by including rectangular electrodes instead of the circular ones assumed in the model proposed by Mueller. We assume that the half space is a bounded box with hx, hy and hz as the length along the x-, y- and z-axes respectively, with hx, hy and hz large enough to accurately model the infinite half space. We then express the solution as a decomposition of its Fourier series. The forward problem is formulated as before in the homogeneous mammography case. We decompose the applied current on the surface into its Fourier series as follows:
| (2) |
where F is the number of Fourier terms used in the approximation and jn,m is the (n,m)th Fourier coefficient of current J. The forward voltages satisfy the boundary conditions specified by Maxwell’s equations
| (3) |
and
| (4) |
where ν is the outward normal at point p, U(p) is the electric potential, J(p) is the current density on the surface and γ(p) = γ is the internal admittivity distribution in the body Ω. We solve the problem using the method of separation of variables. The forward voltage obtained by decomposition using the eigenfunctions of the ave-gap model (Mueller et al 1999) can be expressed as
| (5) |
where
| (6) |
The linearized reconstruction assumes a constant admittivity γ0 from which the varying admittivity γ (p) is perturbed only slightly. The boundary condition to be satisfied is
| (7) |
We solve for un,m to satisfy the boundary condition:
| (8) |
This result gives the forward solution in a homogeneous medium with constant admittivity γ0. As we are using the ave-gap model, we get the voltages on the electrodes by integrating U(x, y, 0) over the surface of each electrode and dividing by the area of the electrode.
4. Comparison of the two forward solutions
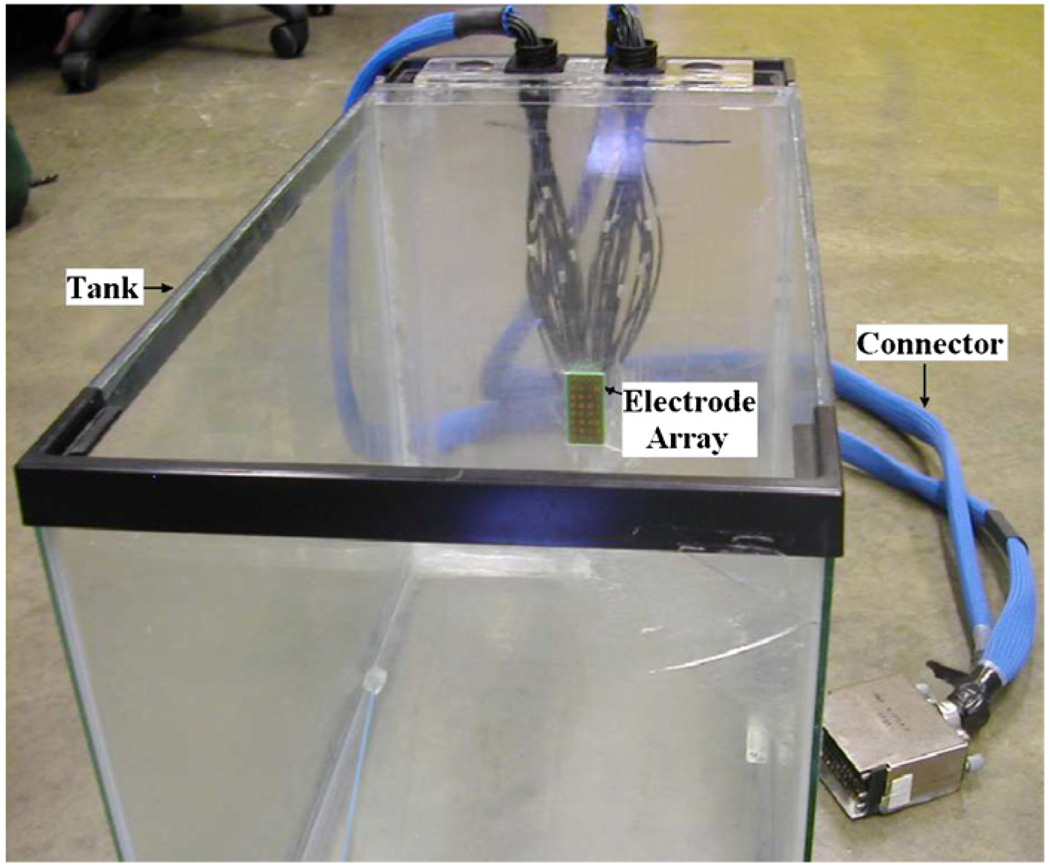
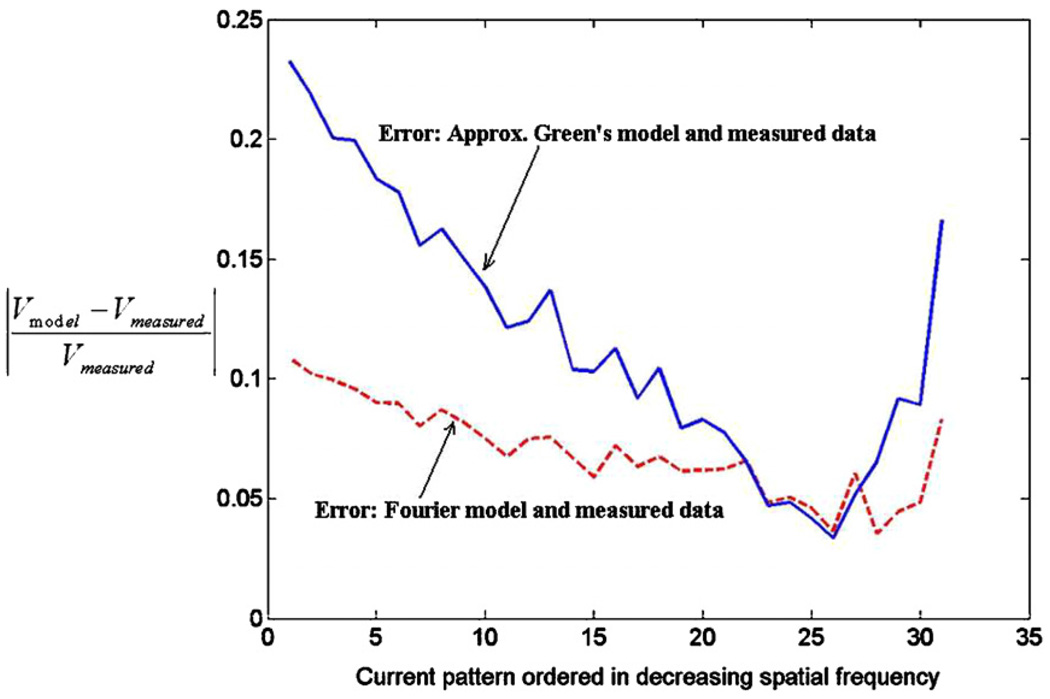
Having solved for the forward solution using the Fourier decomposition method, we compare the two forward models using experimental tank data. Figure 2 shows the tank with the electrode array built into the center of the wall at the far end. The tank dimensions are 25 cm, 27 cm and 42 cm, in the x-, y- and z-directions, respectively. The electrode array has 32 electrodes arranged in an 8 × 4 grid. Each electrode is 4.5 × 4.5 mm with a gap of 1 mm between electrodes. The overall array dimensions are 4.4 × 2.2 cm. The dimensions of the tank are much larger than those of the array, thus approximating an infinite half space. The tank was filled with saline solution with an admittivity of 190 mS m−1. We obtained voltage data from this homogeneous saline tank for a complete set of optimal current patterns (Gisser et al 1990) and compared the measured voltages to those from the two homogeneous forward models. These optimal current patterns are the eigenvectors of the Neumann to Dirichlet map for the geometry and they consist of current patterns with different spatial frequencies. The temporal frequency of the applied voltages was 33 kHz. The absolute error between the measured data and the calculated forward voltages, normalized by the measured data for the optimal set of current patterns, is shown in figure 3 for each current pattern, arranged by decreasing spatial frequency. The solid line is the error for the approximate Green’s method and the dashed line is the error for the Fourier method. We observe that for most of the current patterns the error for the Fourier model is smaller than that for the approximate Green’s model. Note that the improved modeling of the electrodes in the Fourier solution contributes to the smaller error observed.
Figure 2.
The experimental set-up simulating infinite half space hand-held geometry.
Figure 3.
Error in Green’s model and Fourier model for experimental measured data.
5. Reconstruction
Having solved the forward problem, we implement the reconstruction algorithm for the hand-held probe geometry. The linearized reconstruction assumes that the admittivity distribution γ (x, y, z) differs only slightly from a constant value γ0 for the homogeneous model. This variation is represented by the perturbation η(x, y, z) (Mueller et al 1999). With the ave-gap model, the linearized EIT problem is to solve for η(x, y, z) in
| (9) |
for i, k = 1, 2,…, L − 1, where L is the number of electrodes and N is the number of voxels in the reconstruction mesh. The nth voxel is denoted by Ωn. V is the voltage measured at the electrodes while U(γ0) is the forward voltage for homogeneous admittivity γ0 computed on the electrodes by integration of the forward solution. Since the left side of this equation consists of measured and computed quantities , it is known and is denoted as the data matrix DU(γ0)(i, k). Thus the problem of reconstructing the unknown admittivity is equivalent to inverting the integral operator on the right side and solving for the perturbation η(x, y, z) which we assume to be piecewise constant in Ωn and to be denoted by ηn. We define
| (10) |
as the A matrix and η as a vector of the perturbation admittivity values for the N voxels. The problem is thus reduced to solving for η in the linearized system
| (11) |
The reconstruction problem is very ill-posed, and we therefore use regularization (Kao 2005) to improve the reconstructions. The linear problem with regularization becomes
| (12) |
where ε1 is a regularization parameter for NOSER-type regularization (Isaacson et al 1990) and ε2 is for Tikhonov regularization (Tikhonov 1943). We calculate the A matrix for the Fourier approach using (10) and the forward solution using the Fourier method on the mesh defined for the reconstruction. Calculation of the A matrix using the Green’s method approach is explained by Mueller et al (1999).
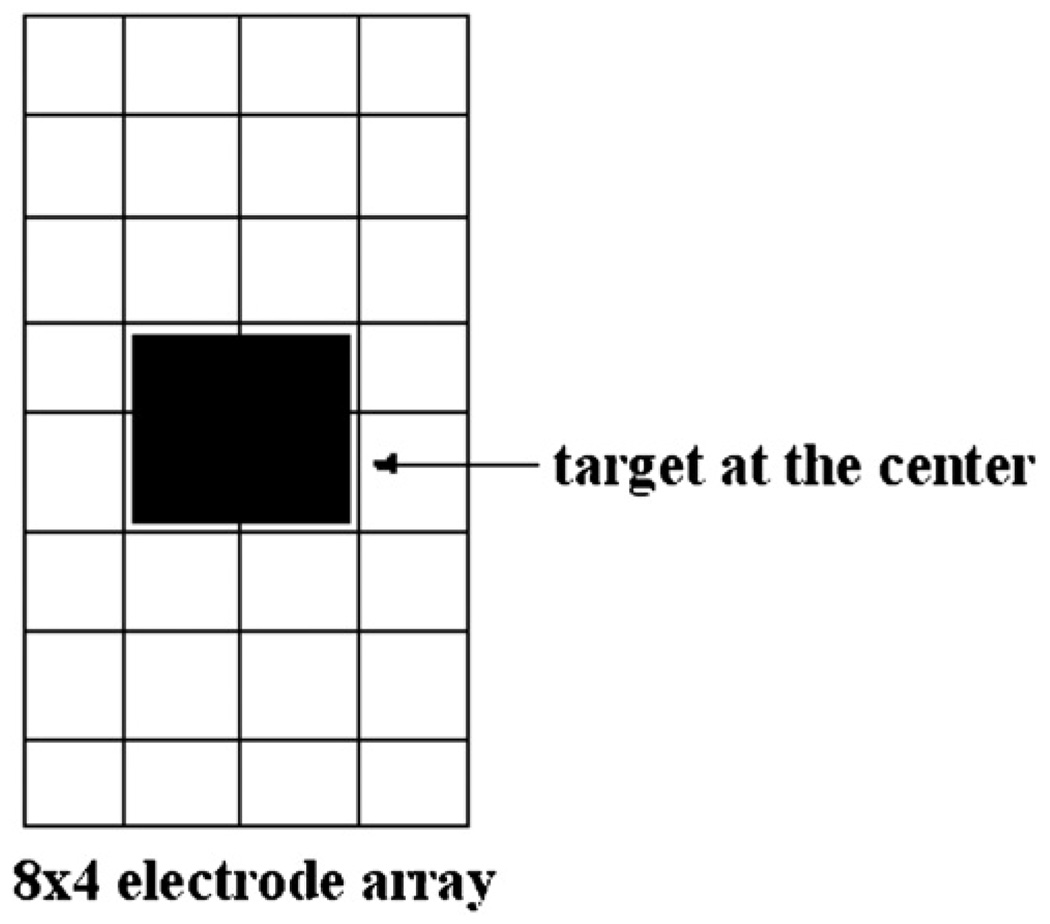
We tested the performance of our algorithmwith data from the experimental tank described earlier. A 1 cm3 copper target was placed in the tank centered in front of the electrode array at varying distances from the array. The voltages applied had a temporal frequency of 33 kHz. Figure 4 shows the location of the target in the x–y plane with respect to the electrode array.
Figure 4.
Placement of the target with respect to the electrode array.
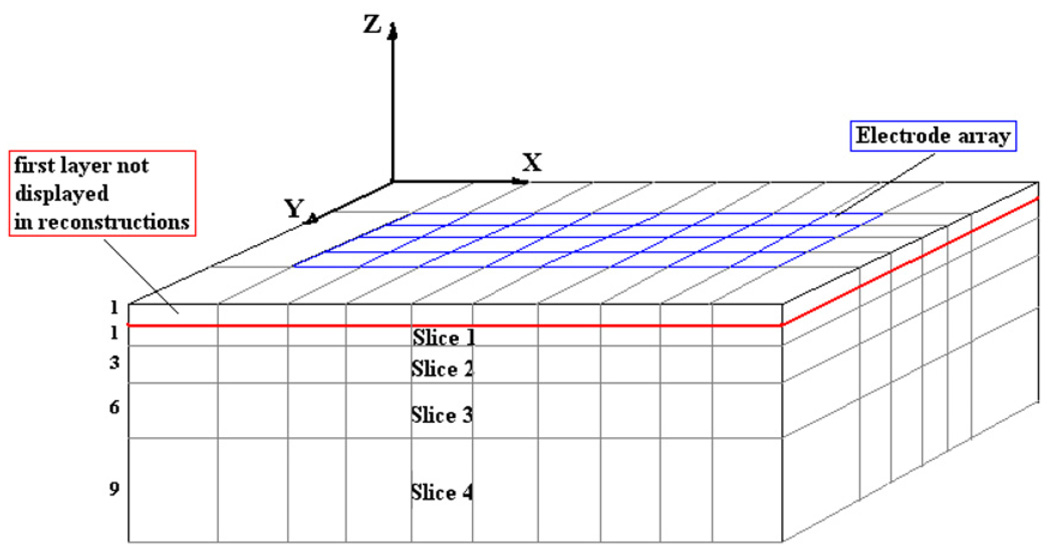
We reconstruct difference images to evaluate the depth resolution of the algorithm. A difference image is constructed by measuring the voltages both with and without the target in the medium and using these two data sets in the reconstruction algorithm. The A matrix uses the forward solution calculated from the forward model. The mesh we use in the reconstructions divides the body into five cross-sectional slices of unequal thickness and solves for 10 × 6 × 5 voxels. The thickness of the slices increases with the distance from the electrode array to account for the fact that the distinguishability, i.e. our ability to detect changes in the admittivity, drops with the distance away from the electrodes. The thickness ratio of the slices we use is 1:1:3:6:9. The total depth below the electrode array that we reconstruct is 20 mm. Figure 5 shows the reconstruction mesh. We solve for the perturbation η(x, y, z) using reconstruction algorithms based on the approximate Green’s and Fourier forward models and plot the reconstructed admittivity γ (x, y, z) in each of the five slices. Since the top-most slice is adjacent to the highly conductive electrodes, the voxels in this slice have reconstructed admittivity values that are dominated by the high current density in the electrodes themselves rather than the admittivity of the medium in front of the electrodes. The high reconstructed admittivity for the voxels in this slice results in a large dynamic range for the reconstruction as a whole, obscuring the admittivity changes in the other slices. Hence we do not include the topmost slice in the display of the reconstructions. The four slices shown in the reconstruction are labeled 1 for the top-most slice and 4 for the bottom-most slice. The Tikhonov regularization factor used is 0.01 and the NOSER regularization factor is 0.1.
Figure 5.
The mesh used in the reconstructions.
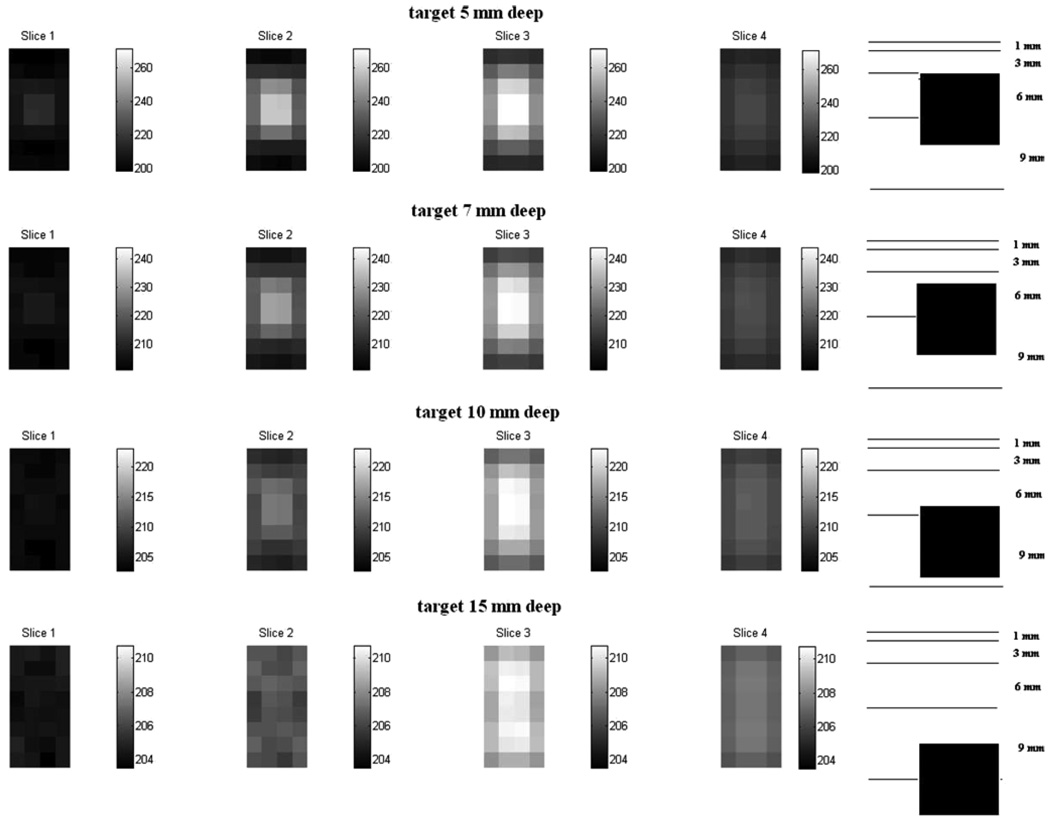
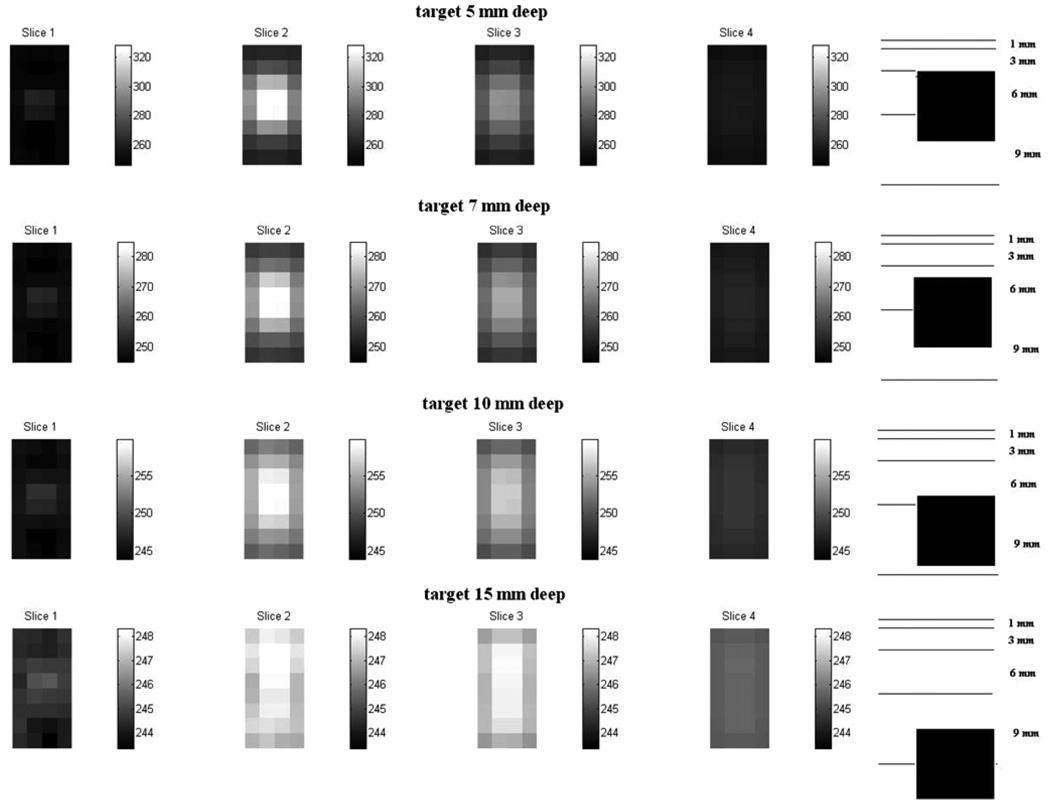
Figure 6 and Figure 7 show the difference images for a target at various distances from the electrode array obtained using the Fourier model and the approximate Green’s model, respectively. The sketch at the right of each figure shows the depthwise location of the target with reference to the reconstruction slices. Note that the contrast of the reconstructions decreases with increasing distance of the target away from the electrode array. The palette used for each row in the figure is different. We see from the comparison of the two figures that the depth resolution for the Fourier method is better than that for the Green’s method. Comparing the reconstructions for the target at distances of 7 mm and 10 mm from the array, we see the reconstructed target properly moving further out of the second slice and into the third slice in the Fourier method reconstructions of figure 6. In the approximate Green’s method reconstructions of figure 7, the target is detected but its appearance in the reconstruction does not correspond with its actual location with respect to the slices.
Figure 6.
Difference image reconstructions using the Fourier forward model.
Figure 7.
Difference image reconstructions using the approximate Green’s forward model.
6. Layered forward model
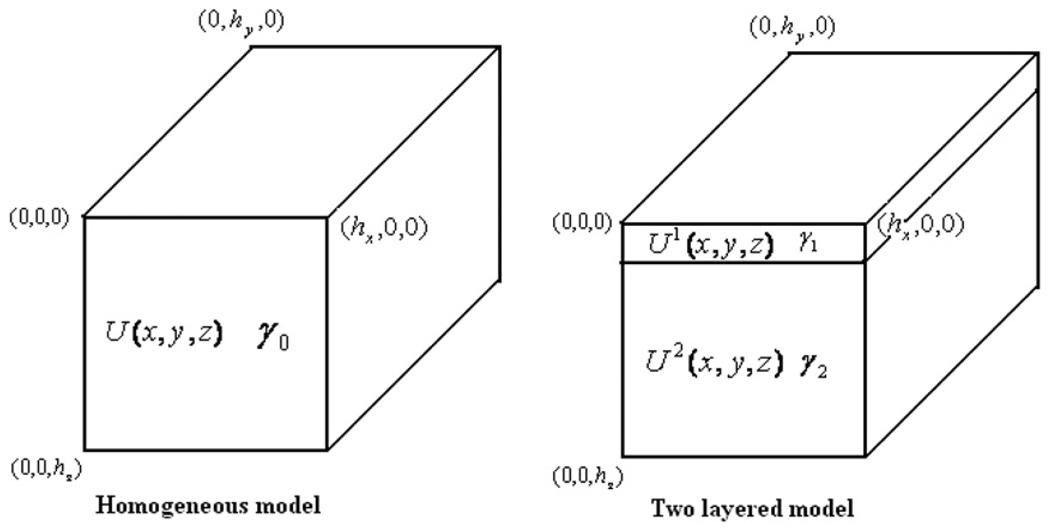
We introduce a two-layered model to account for a thin skin layer adjacent to the electrode array in the hand-held probe geometry. The forward model geometry is the same as in the Fourier method case for the homogeneous model except for the additional thin skin layer of thickness hskin separating the electrode array and the tissue layer. Figure 8 shows the sketch of the homogeneous and the two-layered hand-held probe geometries. In the layered model, the admittivity of the skin is denoted as γ1 and the admittivity of the interior tissue is denoted as γ2. The voltage in the skin layer is denoted by U1 and that in the tissue layer by U2. As in our earlier work in the mammography case, we solve the problem using the method of separation of variables. The layered forward voltages are obtained through a decomposition using the eigenfunctions of the Laplace’s equation with the ave-gap model (Cheng et al 1989) boundary conditions. The forward solutions in the two layers are expressed as
| (13) |
| (14) |
where λn,m is defined as
| (15) |
Figure 8.
A sketch showing the homogeneous and the two-layered hand-held probe geometries.
The forward solution in the skin layer contains both the decreasing and increasing exponential terms since it is bounded in the z-direction. The hand-held geometry is an infinite half space, however, so the solution in the tissue layer has only the decreasing exponential. The increasing exponential has to be zero since, otherwise, the solution would go to infinity at infinite depth. The inter-facial conditions for the layered case indicate that U(x, y, z) has to be continuous across layers and . We get three simultaneous equations from these interfacial and boundary conditions which we solve simultaneously assuming a stepwise constant admittivity in the layers to get the three coefficients that define the forward voltages in the two layers:
| (16) |
| (17) |
| (18) |
Solving these three equations simultaneously we get the expressions for the three coefficients:
| (19a) |
| (19b) |
| (19c) |
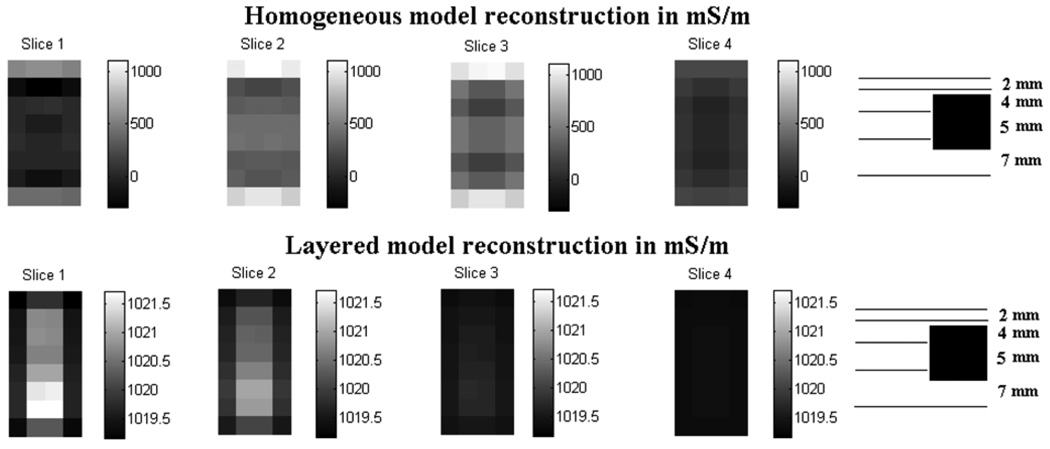
We now want to compare the reconstructions from the layered and homogeneous models. To this end, we generate simulated data using finite difference simulations. The finite difference code uses a grid size of 0.1 cm along the x-, y- and z-directions. Our aim is to improve the reconstruction of the tissue layer where the tumors and other features of interest are generally located. We generate finite difference simulation data for a layered structure with an embedded high admittivity target. The geometry used is the same as described in the forward model with a skin thickness of 2 mm and a target placed at a depth of 5 mm below the electrode array. In practice, skin thickness varies among subjects and with different parts of the body, ranging from a fraction of a millimeter to a few millimeters. In our simulations, we use a skin thickness of 2 mm as a reasonable estimate. The tissue and skin admittivities used in the simulation are 1 + 0i S m−1 and 0.1 + 0i S m−1 for γ2 (tissue) and γ1 (skin), respectively, and 100 S m−1 for the target. Figure 9 is a sketch of the finite difference geometry showing the location of the target with respect to the electrode array and specifying the volume reconstructed.
Figure 9.
Finite difference target geometry to be reconstructed. Dimensions in millimeters.
The mesh used in the reconstructions has dimensions of 10 × 6 × 5 as before and the relative slice thicknesses are 2:2:4:5:7. The AUγ1,γ2 (i, k, n) matrix in the layered model uses the forward voltages U1 and U2 in the skin and tissue layers, respectively. The regularization parameters are 0.01 for Tikhonov and 0.1 for NOSER. As described earlier, the slice closest to the electrodes is not displayed because it is strongly affected by the proximity of the electrodes.
Figure 10 shows that the layered model reconstruction detects the target while the homogeneous model reconstruction does not. The dynamic range of the homogeneous model reconstruction is large, varying from 0 to 1000 mS m−1, due to the presence of 100 mS m−1 skin which is unaccounted for in the homogeneous model. The layered model however has a range of 1019 to 1021 mS m−1 which is close to the actual tissue layer admittivity of 1000 mS m−1 and is higher due to the presence of the highly conductive target. These results show that the use of the layered model reduces the effect of skin that would otherwise dominate the outer layers in the tissue region. The sketch at the right side of the figure shows the relative location of the target with respect to the reconstructed slices. We see that the target located at a depth of 5 mm is detected in the reconstructions in slice 1 and slice 2, instead of slice 2 and slice 3 where it is expected. Although we do not know the cause of this shift of the detected target toward the electrode array in the z-direction, we have observed that it is sensitive to the regularization parameters used in the reconstruction.
Figure 10.
Comparison of the homogeneous and layered model reconstructions for simulated data.
7. Human subject data
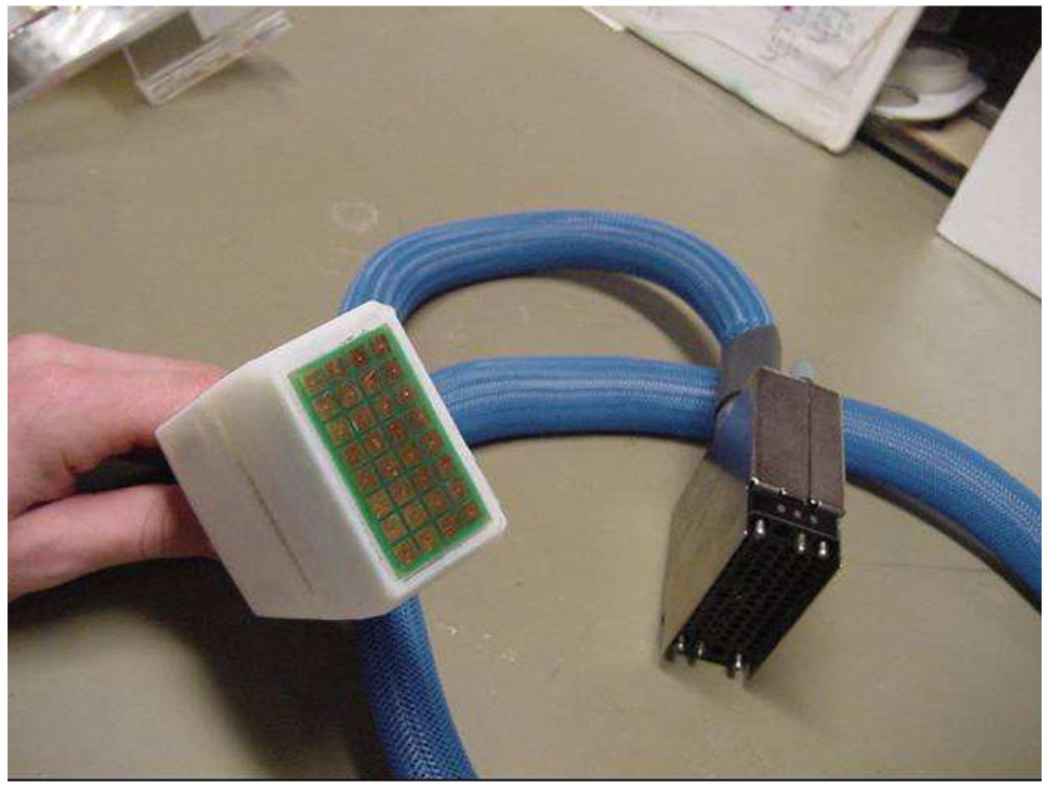
We have developed a hand-held EIT probe which can be placed on the body surface and can be moved over the surface to collect data from regions of interest. Figure 11 is a photograph of the 8 × 4 EIT hand-held probe. We collected data from the abdomen of a human subject and compared it to the homogeneous and layered forward voltages from the two models. The subject’s abdomen was treated with a conductive gel, and the probe was applied to the abdomen after allowing time for the gel to be absorbed into the skin. This preparation was done to ensure proper electrical contact between the electrode array and the abdomen while reducing the possibility of a short between electrodes. In the homogeneous model, the forward voltages are calculated using a uniform admittivity of 1 and then scaled by the admittivity γ0 that best fits the measured data. The layered forward voltage however needs the values for both the skin and tissue admittivities. These were obtained by an estimation procedure which iteratively estimates the skin (γ1) and tissue (γ2) admittivities and successively reduces the error between the measured data and the calculated layered voltages in each iteration (Kulkarni et al 2008). We also calculate the absolute error between the layered forward voltages and the measured data using different values of skin thickness in the layered forward model and choose the skin thickness that minimizes this error. By this method a skin thickness of 1 mm provided the best overall fit between the layered forward model and the measured abdomen data. We define the error vector E⃗, which is a function of γ1 and γ2,
| (20) |
for i = 1, 2,…, K, where K is the number of linearly independent current patterns. The MATLAB optimization routine ‘lsqnonlin’ is used, which solves nonlinear least-squares problems. This routine varies γ1 and γ2 and calculates the corresponding Uγ1, γ2 and Eγ1, γ2 to iteratively minimize the L2-norm of E⃗. The values of γ1 and γ2 obtained from this optimization procedure are used to calculate the layered forward voltages.
Figure 11.
Hand-held 8 × 4 EIT probe.
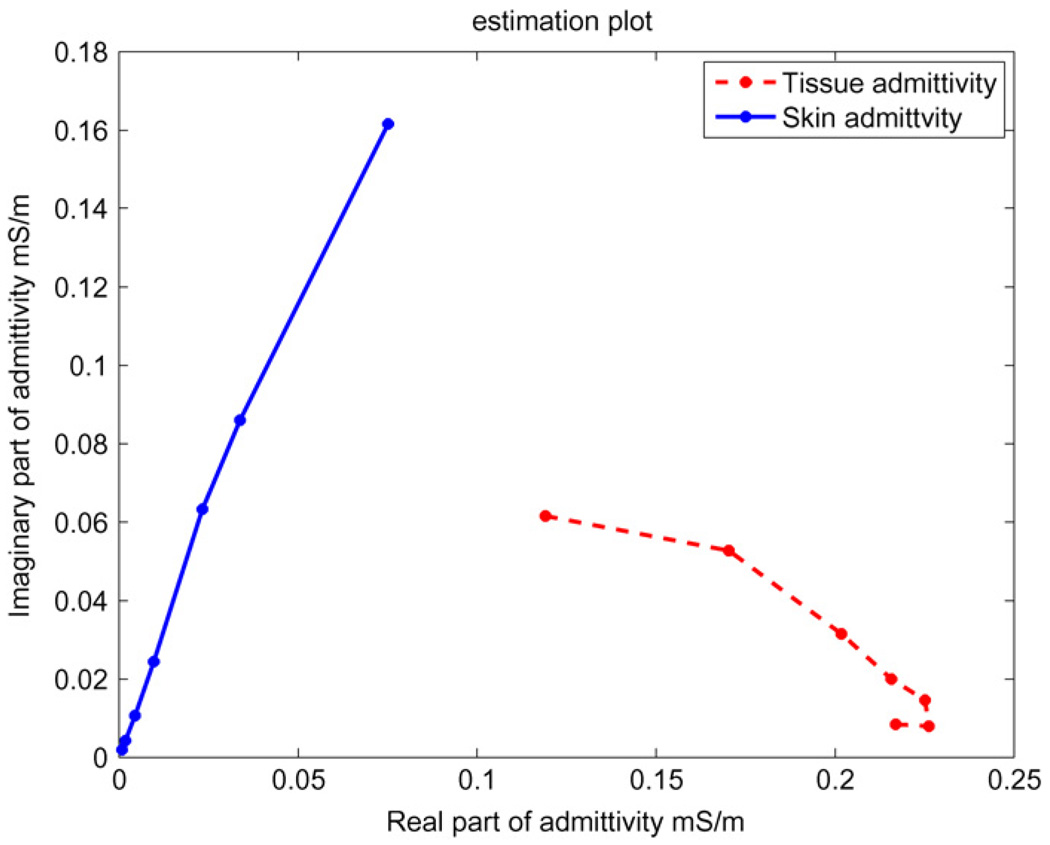
We ran the abdomen data through our estimation procedure and analyzed the estimated skin and tissue admittivity values. Figure 12 shows the skin and tissue admittivity values for the seven temporal frequencies at which the data were measured. The figure shows the real part of admittivity on the x-axis and the imaginary part of admittivity on the y-axis of skin and tissue at temporal frequencies of 3.3 kHz, 10 kHz, 33 kHz, 100 kHz, 333 kHz, 500 kHz and 1 MHz. We see from the plot that skin shown with a solid line has very low admittivity at low temporal frequencies and its admittivity increases considerably with increasing temporal frequency, particularly in its imaginary component. The tissue admittivity shown with a dashed line varies a relatively smaller amount in its imaginary component with temporal frequency as compared to the skin. These results are similar to those obtained in the mammography geometry described in (Kulkarni et al 2008).
Figure 12.
Estimated skin and tissue admittivity values over a range of frequencies from 3.3 kHz to 1 MHz. The 3 kHz data occur at the left end of both curves.
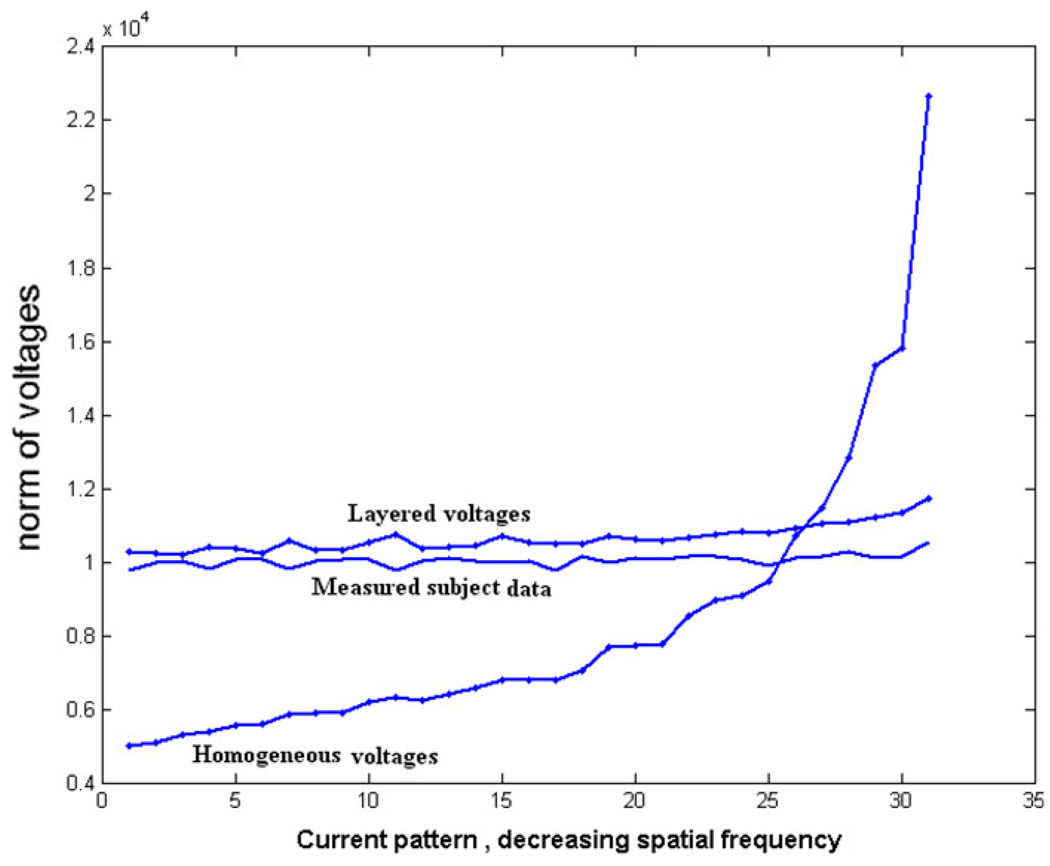
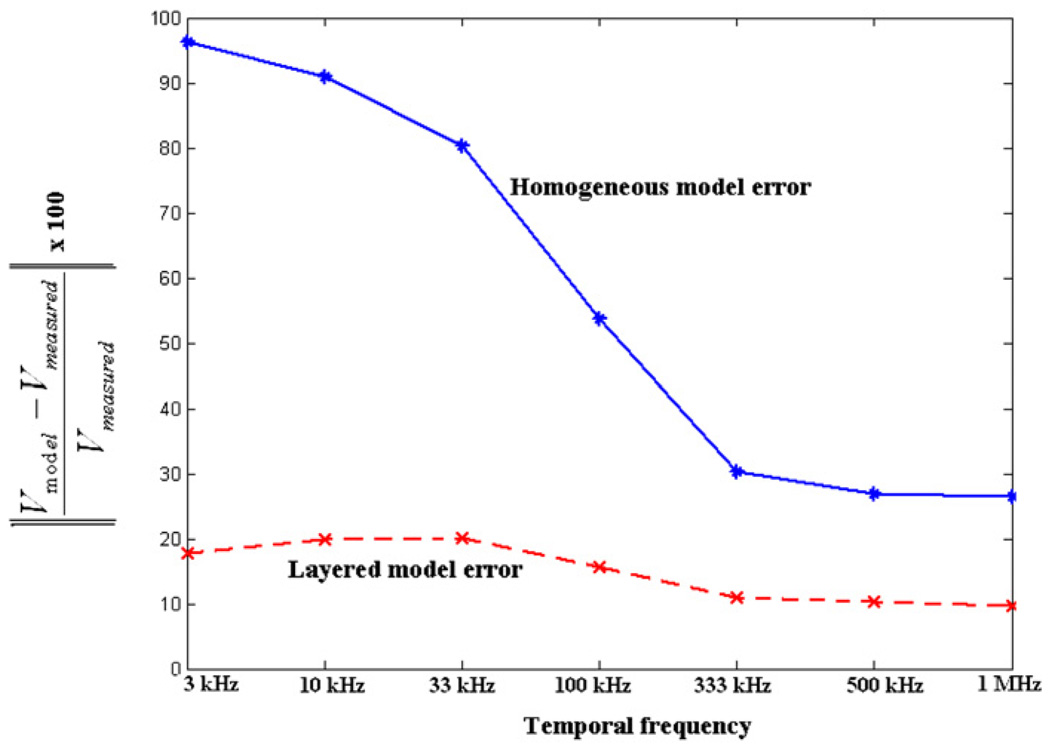
We calculate the layered forward voltages using the estimated skin and tissue admittivity values obtained from the procedure described above and compare the measured data with the homogeneous forward voltages and layered forward voltages. We first look at the abdomen data collected at the 3.3 kHz temporal frequency and study the fit of the layered and homogeneous forward solution to these data for all applied spatial frequency current patterns. Figure 13 shows the norm of the voltages for each applied current pattern for the measured human subject data along with the homogeneous forward voltages and layered forward voltages for a temporal frequency of 3.3 kHz. The patterns along the x-axis are ordered according to decreasing spatial frequency from left to right. We see from the figure that at this low temporal frequency, the layered forward model fits the measured subject data much better as compared to the homogeneous model. We then look at the fit of the two forward models for all temporal frequencies. Figure 14 shows the norm error for all current patterns between the measured data and the forward voltages for all seven temporal frequencies studied. The x-axis shows the seven different temporal frequencies we apply. The y-axis shows the percentage relative L2 norm error between the measured data and the forward voltages summed over all applied spatial frequency current patterns. The error between the measured data and the homogeneous forward voltages is shown with a solid line while that between the measured data and the layered forward voltages is shown with a dashed line. We see from the figure that the layered model fits the measured data better as compared to the homogeneous model at all temporal frequencies but especially so at low temporal frequencies. The layered model gave an improvement of around 81% for the lowest temporal frequency (3 kHz) and around 61% for the highest temporal frequency (1 MHz). We attribute this to the fact that skin admittivity is very low at lower temporal frequencies and dominates the forward voltages (Raicu et al 2000).
Figure 13.
Norm of voltages of the measured data and the forward model voltages plotted against each spatial frequency current pattern for a temporal frequency of 3.3 kHz.
Figure 14.
Percentage relative norm error between the measured data and the forward model voltages versus temporal frequency.
8. Conclusion and future work
We have developed a new approach to derive the forward solution for the hand-held probe geometry which uses the Fourier decomposition method. We have shown that the Fourier method reconstructions have a better depth resolution compared to the approximate Green’s theorem method used previously. We also developed a two-layered forward solution for the hand-held probe geometry that accounts for the presence of skin surrounding the body. This layered model fit the measured subject data better than the homogeneous model. In the future, we plan to analyze a larger set of subject data, to generate estimated skin and tissue admittivity values. We expect to gain a better understanding of how the skin behaves at various temporal frequencies by applying this model to a larger clinical data set.
Acknowledgments
This work was supported in part by CenSSIS, the Center for Subsurface Sensing and Imaging Systems, under the Engineering Research Centers Program of the National Science Foundation (award number EEC-9986821) and NIBIB, the National Institute of Biomedical Imaging and Bioengineering under (grant number R01-EB000456-03) and the National Cancer Institute under grant R21 CA 109962-01.
References
- Assenheimer M, Laver-Moskovitz O, Manor D, Nahaliel U, Nitzan R, Saad A. The T-SCAN technology: electrical impedance as a diagnostic tool for breast cancer detection. Physiol. Meas. 2001;22:1–8. doi: 10.1088/0967-3334/22/1/301. [DOI] [PubMed] [Google Scholar]
- Cheng K-S, Isaacson D, Newell J, Gisser DG. Electrode models for electric current computed tomography. IEEE Trans. Biomed. Eng. 1989;36:918–924. doi: 10.1109/10.35300. [DOI] [PMC free article] [PubMed] [Google Scholar]
- Cherepenin V, Karpov A, Korjenovsky A, Kornienko V, Mazaletskaya A, Mazourov D, Meister DA. 3D electrical impedance tomography (EIT) system for breast cancer detection. Physiol. Meas. 2001;22:9–18. doi: 10.1088/0967-3334/22/1/302. [DOI] [PubMed] [Google Scholar]
- Choi M, Kao T-J, Isaacson D, Saulnier G, Newell J. A simplified model of mammography geometry for breast cancer imaging with electrical impedance tomography. Eng. Med. Biol. Soc. 2004;2:1310–1313. doi: 10.1109/IEMBS.2004.1403412. [DOI] [PubMed] [Google Scholar]
- Gisser DG, Isaacson D, Newell J. Electric current computed tomography and eigenvalues. SIAM J. Appl. Math. 1990;50:1623–1634. [Google Scholar]
- Halter RJ, Hartov A, Paulsen KD. A broadband high-frequency electrical impedance tomography system for breast imaging. IEEE Trans. Med. Imaging. 2008;27:1439–1448. doi: 10.1109/TBME.2007.903516. [DOI] [PubMed] [Google Scholar]
- Isaacson D, Cheney M, Newell J, Simske S, Goble J. NOSER: an algorithm for solving the inverse conductivity problem. Imaging Syst. Technol. 1990;2:66–75. doi: 10.1002/ima.1850020203. [DOI] [PMC free article] [PubMed] [Google Scholar]
- Isaacson D, Edic P. An algorithm on impedance imaging. IEEE EMBC. 1992;14:1693. [Google Scholar]
- Jossinet J. The impedivity of freshly excised human breast tissue. Physiol. Meas. 1998;19:61–75. doi: 10.1088/0967-3334/19/1/006. [DOI] [PubMed] [Google Scholar]
- Kao T, Boverman B, Kim B, Isaacson D, Saulnier GJ, Newell JC, Choi MH, Moore RH, Kopans DB. Regional admittivity spectra with tomosynthesis images for breast cancer detection: preliminary patient study. IEEE Trans. Med. Imaging. 2008;27:1762–1768. doi: 10.1109/TMI.2008.926049. [DOI] [PMC free article] [PubMed] [Google Scholar]
- Kao T-J. PhD Thesis. Troy, NY: 2005. A 3D reconstruction algorithm for electrical impedance tomography using planar electrode arrays. [Google Scholar]
- Kao T, Saulnier G, Xia H, Tamma C, Newell J, Isaacson D. A compensated radiolucent electrode array for combined EIT and mammography. Phys. Meas. 2007;29:S291–S299. doi: 10.1088/0967-3334/28/7/S22. [DOI] [PMC free article] [PubMed] [Google Scholar]
- Kulkarni R, Boverman G, Isaacson D, Saulnier GJ, Kao T-J, Newell JC. An analytical layered forward model for breasts in electrical impedance tomography. Physiol. Meas. 2008;29:S27–S40. doi: 10.1088/0967-3334/29/6/S03. [DOI] [PMC free article] [PubMed] [Google Scholar]
- Mueller J, Isaacson D, Newell J. A reconstruction algorithm for electrical impedance tomography data collected on rectangular electrode arrays. IEEE Trans. Biomed. Eng. 1999;46:1379–1386. doi: 10.1109/10.797998. [DOI] [PubMed] [Google Scholar]
- Raicu V, Kitagawa N, Irimajiri A. A quantitative approach to the dielectric properties of the skin. Phys. Med. Biol. 2000;45:L1–L4. doi: 10.1088/0031-9155/45/2/101. [DOI] [PubMed] [Google Scholar]
- Saulnier GJ, Ning L, Tamma C, Xia H, Kao T, Newell J, Isaacson D. An electrical impedance spectroscopy system for breast cancer detection; 29th IEEE EMBS Ann. Int. Conf.; Lyon, France. 2007. [DOI] [PubMed] [Google Scholar]
- Surowiec AJ, Stuchly S, Barr JR, Swarup A. Dielectric properties of breast carcinoma and the surrounding tissues. IEEE Trans. Biomed. Eng. 1988;35:257–263. doi: 10.1109/10.1374. [DOI] [PubMed] [Google Scholar]
- Tikhonov AN. On the stability of inverse problems. Dokl. Akad. Nauk SSSR. 1943;39:195–198. [Google Scholar]
- Zou Y, Guo Z. A review of electrical impedance techniques for breast cancer detection. Med. Eng. Phys. 2003;25:79–90. doi: 10.1016/s1350-4533(02)00194-7. [DOI] [PubMed] [Google Scholar]


