Abstract
The ability to separate isotopes by high-resolution ion mobility spectrometry techniques is considered as a direct means for determining mass at ambient pressures. Calculations of peak shapes from the transport equation show that it should be possible to separate isotopes for low mass ions (<200) by utilizing heavy collision gasses and high resolution ion mobility analyzers. The mass accuracy associated with this isotopic separation approach based on ion mobility separation is considered. Finally, we predict several isotopes that should be separable.
Introduction
Despite interest in ion populations under ambient conditions over the last century,1-5 no direct measurements of masses have been made at high pressures. This is because mass spectrometry measurements are based on determination of the motion of ions in a vacuum (usually < 10−4 Torr). As ions are extracted from a high-pressure environment into the low pressure regions of mass analyzers the population evolves due to shifts in equilibrium as pressures, temperatures, and species concentrations change. A direct method for measuring the fundamental property of mass at high pressures would find applications in a range of problems, from understanding and monitoring ions in the environment6-8 to delineating details of ion formation in a range of new sources that operate in ambient conditions.9-13
Although direct measurements of mass at high pressure are not feasible with conventional mass analyzers, it is possible to record ion mobilities at high pressure. The mobility of an ion through a gas (K = v/E) is a measure of the ion's velocity (v) under the influence of an applied electric field (E). Thus, K is a fundamental property of the ion in a defined buffer gas. It is generally understood that an ion's mobility is inversely related to its collision cross section (Ω) with the gas as shown in equation 1,14
| (1) |
Here, the parameters of temperature (T), pressure (P), and average buffer gas mass (mB) define properties of the buffer gas; the variables z and mI, define the ion's charge state and mass, respectively. The terms N, kb, and e are constants corresponding to the neutral number density (at STP), Boltzmann's constant, and electron charge, respectively.
Equation 1 shows that for the ion, there are two fundamental properties that are not known in the measurement of mobility, Ω and mI. Ω depends on the ion's shape, the nature of the ion-buffer gas interaction and to a lesser extent, the masses of the colliding pair. If Ω were defined (e.g., from theoretical calculations),15-18 then, mI could be determined directly from a measurement of mobility, because equation 1 can be rewritten as:
| (2) |
An interesting case arises when we consider isotopes. Neglecting small variations in scattering that arise from the differences in mass, different isotopes of the same ion will have identical collision cross sections with the buffer gas; however, the mobilities of isotopes must differ because of differences in mI (equation 1). Thus, if the resolving power of ion mobility measurements was sufficient to distinguish these isotopes, then one need not know the cross section a priori to determine mI. Rather, mI could be directly determined from the separation of the isotopes.
In the present paper, we consider a simple theoretical treatment for the separation of isotopes and propose that this could be used to rigorously determine ion masses under ambient conditions. The result of these considerations is an estimate of the ion mobility resolving power required to accurately measure the masses of different ions. The present work is closely related to efforts to describe the theory of ion mobility separations14-19 and is inspired by recent attempts to substantially improve mobility resolving power.20-26 This is the first derivation of a mass scale from mobility measurements at high pressure. The results of these considerations suggest that it may already be possible to resolve some isotopes for light ions at high pressures; moreover, as significant improvements in mobility resolving power are made, the present considerations indicate that isotopic structure could become a routine feature of ion mobility data sets, analogous to the patterns observed from mass spectrometry measurements.
Theoretical considerations
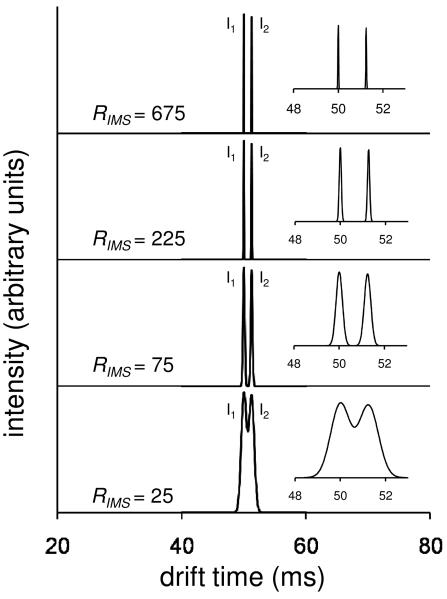
Hypothetical data forseparations of ion distributions for two isomers having m/z = 100
The theory of ion motion through gasses has an extensive history,1-5,27 dating to the early work of Langevin.4 Most of the insight derived here is found from simple manipulations of the ion transport equation.14 Discussions of this equation are presented elsewhere.14,19,28-30 The derivations described below are based on IMS theory. Therefore, the methodology applies for different types of mobility-based separation devices, provided that the separation is carried out in the low-field limit where ion drift velocities are defined as the product KE. Additionally, it should be appropriate for any type of ion source. Figure 1 shows distributions of drift times (tD) that are calculated for drifting ions through a buffer gas. Here, we consider two hypothetical ions at ion mobility resolving powers of 25, 75, 225 and 675 [RIMS = t/Δt, where Δt is the full width at half maximum (FWHM) of the peak]. In this hypothetical distribution we arbitrarily assume two isomers that differ in collision cross section by 2.5%; the ions and conditions are defined such that peaks in the distribution will be centered at 50 and 51.25 ms. As expected, the two species are unresolved at RIMS = 25 and almost fully resolved at RIMS = 75. At higher resolving powers the two isomers are baseline resolved.
Figure 1.
Ion mobility distributions for two isomers (I1 and I2) of a hypothetical ion having a mass of 100 Da. Shown are traces for conditions exhibiting different resolving powers. The insets show a blow up of the drift time region containing the two features in order to emphasize the changes in distributions as resolving power increases. The hypothetical ion mobility distributions are obtained from calculated normal distributions, , consisting of 100 time points across the peak (∼6σ). A histogram is generated assuming a population of 1000 simulant ions across the 100 time points.
It is worthwhile to comment about these assumed resolving powers. At this point in the development of instrumentation, a value of RIMS = 25 is attainable by almost any reasonable ion mobility instrument and would be considered a relatively low resolving power. A value of RIMS = 75 is attainable in many laboratories for many types of ions and would be considered typical. A value of RIMS = 225 is currently attainable in several laboratories20-26 and would be considered a high resolving power. Having noted this, high-resolution measurements are quickly becoming routine. Although RIMS = 675 has not been reported one would anticipate that this resolving power will be realized in the next several years. While we also expect that recent developments of high-pressure trapping and focusing techniques,23,31,32 circular instruments,25 and new approaches, such as the use of overtone mobility techniques33,34 should facilitate even higher resolving power measurements, we note that currently all of the higher resolution distributions that we show are purely speculative.
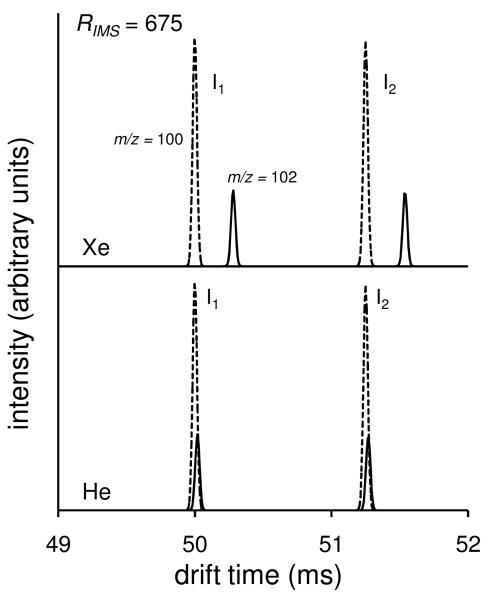
Hypothetical separations of ion distributions for two isotopes (M and M+2) at RIMS = 675
Figure 2 shows calculated ion distributions for two isotopes of the isomers that were considered above. To illustrate the separation of different masses having the same cross section, consider M and M+2 isotopes, such that the ion mass is 100 or 102, respectively. A 2.0 Da shift would be typical of a chlorinated molecule and in this example we use the relative isotopic composition for that of 35Cl:37Cl (i.e., 3:1). We have deliberatively chosen an isotopic shift of 2.0 Da, and a light ion to consider first, because the experimental realization of the separation of isotopes should be most easily obtained for this type of ion. Still, as shown in Figure 2, when He is used as the buffer gas we calculate only slight shifts in the positions of peak centers: 50.00 and 50.02 ms for the M and M+2 isotopes, respectively (for isomer 1); and, 51.25 and 51.27 ms for the M and M+2 peaks, respectively (for isomer 2). While the centers of the M and M+2 pairs of peaks shift slightly for each isomer in He, the resolving power of 675 is insufficient to resolve these isotopes. Instead, peaks in the measured drift time distributions in He will appear broadened, compared with what is expected for a single isotope (or, a single peak that is calculated using an isotopically averaged mass).
Figure 2.
Ion mobility distributions for the two isomers shown in Figure 1. Included are drift time distributions for two different isotopic peaks representing populations of ions with 35Cl and 37Cl. Dashed lines correspond to the distributions for ions with a molecular weight of 100 Da and solid lines correspond to the distributions for ions with a molecular weight of 102 Da. The bottom and top spectra represent IMS conditions employing He and Xe buffer gases, respectively. For simplification purposes the drift time distributions have been normalized to the same value for the isotope of mass 100 Da.
A more deliberate evaluation of equation 1 indicates that He is a poor choice for the buffer gas because mHe = 4.0 Da is a value that dominates the reduced mass term. One can see, however, that isotope separation can be favored by use of a heavy collision gas (e.g., Xe with m = 131.29 Da). As shown in Figure 2, when Xe is used as the collision gas, the transport equation predicts that the M and M+2 isotopic peaks are not only apparent but are well resolved at RIMS = 675 for each of the isomers.
Discussion
Determination of mass from IMS isotopic distributions
The calculated distributions presented above suggest that in theory it should be possible to develop a mass scale based on ion mobility separations. To illustrate the separation of different masses because of differences in mobilities, we considered the M and M+2 isotope pair, such as would be found in ions containing a chlorine atom. In order to develop the idea that it may be possible to develop a general scale, we proceed by considering pairs of M and M+1 isotopes, i.e., ions that are separated by 1.0 Da as in the case of the 12C:13C isotopic pairs. Because the collision cross sections of the isotopic peaks are equal and because the relationship of the masses is known, by rearranging equation 1 and substituting the drift times (tD1 for the M ion and tD2 for the M+1 ion), as well as E and the drift tube length (L) for K1 and K2 (the mobilities of the two respective ions) we obtain the following relationship:
| (3) |
Here, the left and right side of the equation corresponds to Ω1 and Ω2, respectively. Simplification of equation 3 gives the ratio of the drift times for the isotopes (tD1 and tD2):
| (4) |
Solving equation 4 for mI yields:
| (5) |
Thus, the difference in the drift times of the ion pairs are all that is required to determine mI. This quadratic form of this equation yields two solutions. However, because the denominator is negative, the only meaningful solution is the one for which the numerator is negative as well. For example, if values of tD1 = 75.00 ms and tD2 =75.15 ms were obtained for mI and mI + 1, then mI = 146.4 Da. In another part of the same spectrum, a pair of peaks might have tD1 = 50.00 ms and tD2 =50.20 ms such that mI = 77.7 Da. In this manner, the drift times become a mass spectrum.
Understanding uncertainties in drift times and mass determination
Equation 2 can be rewritten such that K is expressed in terms of E, the drift tube length (L), and tD. This provides the means to obtain an expression that relates the mass resolving power (Rmass = m/ Δm, where Δ>m is the peak FWHM) to RIMS. To obtain this expression, we first find the rate of change of the mass with respect to the rate of change of the drift time, i.e., as:
| (6) |
Equation 6 can be rewritten in terms of ∂mI by multiplying both sides by ∂tD (modified equation 6). It is then possible to express both ∂mI and ∂tD as ΔmI and ΔtD for the respective peak widths at FWHM. We now have equations in terms of mI (equation 2) and ΔmI (modified equation 6) and it is therefore possible to obtain an expression for Rmass (equation 2 / modified equation 6 -see above). In order to perform the operation it is necessary to revise the expression for equation 2 by substituting the variables E, L, and tD for K. Because the resulting equation contains the term tD/ tD on the right, it is possible to generate a relationship between Rmass and RIMS as given by:
| (7) |
From this it can be seen that the ability to resolve different masses is directly proportional to RIMS.
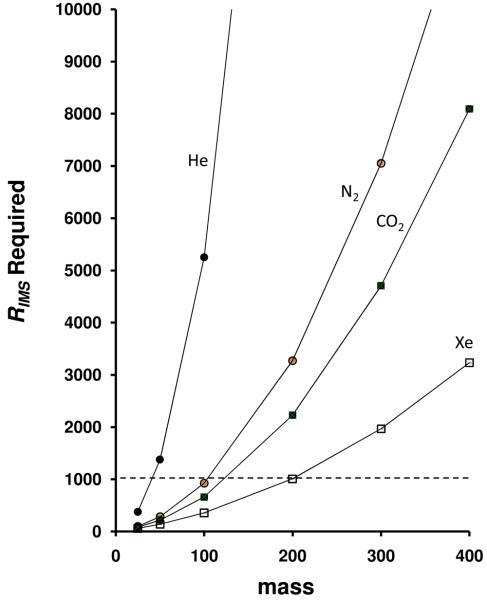
Additionally, equation 7 makes it possible to estimate values of RIMS that would be required to determine the masses of different ions. For example, if it is desirable to resolve isotopic peaks differing by 1.0 Da, then Rmass must be equivalent to the numerical value of the mass of the ion. To illustrate this, Figure 3 shows the minimum required RIMS as a function of the mI results in resolving the M and M+1 isotope pairs, based on differences in mobilities. These minimum criteria are shown for different buffer gasses: He, N2, CO2 and Xe. A value of RIMS = 1000 would limit the maximum mass that could be resolved with its M+1 isotope to ∼40, ∼100, ∼110, and ∼200 Da, for separations in He, N2, CO2, and Xe, respectively. While these values show that analyses are limited to relatively low molecular weights (compared with mass analyzers), they also suggest that many new experiments for directly assessing masses of ions at high pressues may be feasible. The mass range is extended for M and M + 2 isotopic pairs.
Figure 3.
Required RIMS values as a function of molecular mass. Shown are the dependencies for He (solid circles), N2 (open circles), CO2 (solid squares), and Xe (open squares). A dashed line at RIMS = 1000 is shown such that differences in mass determination capabilities for the different gases can be observed (see text for details).
Considering the mass accuracy of high-pressure IMS measurements
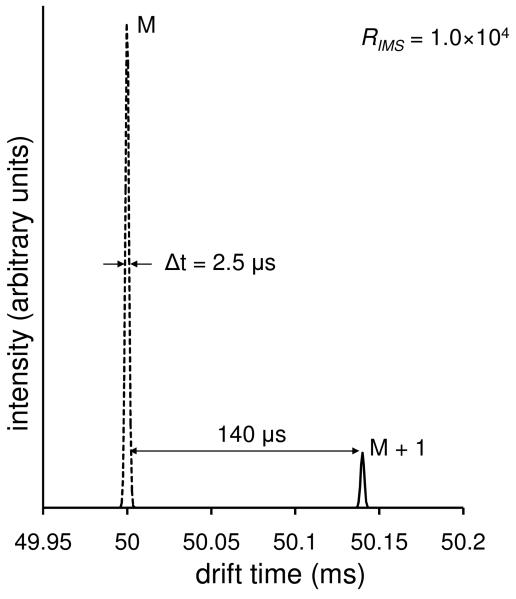
Finally, it is important to consider the mass accuracy associated with the measurements that are described above. In order to illustrate how we arrive at the mass accuracy of this measurement, we consider an extremely high value for the resolving power, RIMS = 104. Figure 4 shows a drift time distribution for two hypothetical isotopic peaks at 100 and 101 Da, having drift times of 50.00 and 50.14 ms, respectively. A measurement in which RIMS = 104 would result in a peak capacity of 56 for the range between the two features. If we assume that each peak is defined by ∼10 points and that the center can be measured to ± 0.5 increments then the difference in drift bins would be ± 1 increment of 1120 (or ± 1.25×10⁻⁴ ms). To determine the error associated with the mI, it is necessary to propagate this error in drift times (tD1 and tD2) from equation 5 via
| (8) |
where ε(mI), ε(tD1), and ε(tD2) correspond to the errors in the mass of the ion and the measured drift times of the isotopic peaks, respectively. Using equation 8 and the uncertainty in the drift times, the mass accuracy associated with the calculated error in mI was determined to be ∼0.9 parts per thousand (ppt).
Figure 4.
Ion mobility distributions for isotopic peaks (M and M+1) for a hypothetical molecule. The dashed line corresponds to the isotopic peak of mass 100 Da and the solid line corresponds to the isotopic peak of mass 101 Da. The peak width (FWHM) of the first isotope is shown and the drift time range between isotopic peaks is given. A resolving power of 104 was used for these plots.
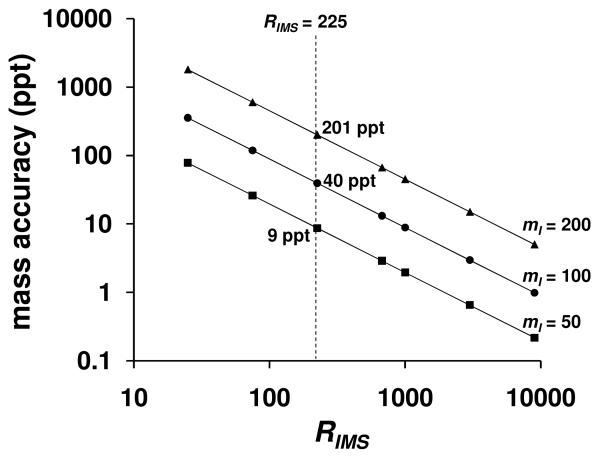
This approach can also be used to determine the dependence of mass accuracy on RIMS and mI for mI 50, 100, and 200 Da as shown in Figure 5. Using RIMS = 225 results in mass accuracy uncertainties of 9, 40, and 201 ppt for ions of mass 50, 100, and 200 Da, respectively. By increasing the mass from 50 to 100 Da, the mass accuracy decreases by a factor of ∼4.5 for all values of RIMS. Increasing the mass from 100 to 200 Da results in a similar decrease in the mass accuracy by a factor of ∼5.0 for all values of RIMS. Overall we see that for a defined value of RIMS, the accuracy of mass determinations with this approach will be mass dependent.
Figure 5.
A plot of the mass accuracy of IMS mass determinations as a function of RIMS values. Traces are shown for mI values of 200 (solid triangles), 100 (solid circles), and 50 (solid squares) Da. The dashed line shows the mass accuracy determined for RIMS = 225.
The above treatment is only applicable to isotopically related ions. The approach becomes more complicated for large mixtures of ions where drift times for different species may overlap. However, we note that the same problem is encountered in MS analysis. Finally this treatment does not consider any technical boundaries associated with the IMS measurement35,36 and assumes that high-resolution measurements will be possible.
Summary and conclusions
A simple theory for directly determining the masses of ions from ion mobility measurements is described. This theory predicts the resolution of isotopes at high pressures. The first set of isotopes that should be measurable are light ions with large isotopic spacings. For example, the M and M+2 ions of Cl+ and other small molecules containing Cl should be resolvable based on mobility differences that are associated only with mass differences. The theory predicts that many peaks associated with isomer separation may appear to be broader than expected at relatively high IMS resolutions because isotopes are not quite separated fully. This is not completely unlike what has been observed in the development of mass spectrometers when the resolving power was on the cusp of distinguishing isotopes. It is important to know of this phenomenon as the presence of broader peaks than would be expected at the operating resolving power may be a signature of a transition to much higher resolving power instruments. We also note that tremendous advances have been made in the resolving power of these technologies, with a number of groups now recording high-resolution spectra.20-25 Additionally, recent developments of circular drift tubes,25 and a technique called overtone mobility spectrometry33,34 open new avenues for high-resolution measurements. The ability to directly measure mass at high pressures should make it possible to directly assess ions under ambient pressure conditions, something that is currently impossible with all existing mass analyzers that utilize low pressures.
Finally, we have not discussed any specific application for this technology in part because no mass measurments have actually been carried out at high pressures. Thus from a fundamental point of view a first question would be what are the masses of ions under ambient conditions? It is interesting, for example, to note that ions are relatively abundant in air and estimated concentrations for negative ions range from 2,000 to as high as 100,000 ions per cubic centimeter depending on environmental conditions.37
Acknowledgments
We gratefully acknowledge partial support of this work from grants that support instrumentation development. These include grants from the NIH (P41-RR018942 and AG-024547-04) and funds from the Indiana University METAcyte initiative that is funded by a grant from the Lilly Endowment.
References
- 1.Elster J, Geitel J. Terr. Magn. Atmos. Electr. 1894;4:213. [Google Scholar]
- 2.Thomson JJ. Phil. Mag. 1897;44:293. [Google Scholar]
- 3.Zeleny J. Phil. Mag. 1898;46:120–154. [Google Scholar]
- 4.Langevin P. ACP. 1903;21:483–530. [Google Scholar]
- 5.Eiceman GA, Karpas Z. Ion Mobility Spectrometry. Taylor and Francis Group LLC; Boca Raton, FL; 2005. [Google Scholar]
- 6.Krueger AP, Reed EJ. Science. 1976;193:2309–1213. doi: 10.1126/science.959834. [DOI] [PubMed] [Google Scholar]
- 7.Robinson N, Dirnfeld FS. Int. J. Biometeor. 1963;4:101–110. [Google Scholar]
- 8.Ferguson EE. In: Kinetics of Ion-Molecule Reactions. Ausloos P, editor. Plenum; New York: 1979. [Google Scholar]
- 9.Fenn JB, Mann M, Meng CK, Wong SF, Whitehouse CM. Science. 1989;246:64. doi: 10.1126/science.2675315. [DOI] [PubMed] [Google Scholar]
- 10.Karas M, Hillenkamp F. Anal. Chem. 1988;60:2299. doi: 10.1021/ac00171a028. [DOI] [PubMed] [Google Scholar]
- 11.Takats Z, Wiseman JM, Gologan B, Cooks RG. Science. 2004;306:471. doi: 10.1126/science.1104404. Details of the methods and additional experimental results are available as supporting online material at http://www.sciencemag.org. [DOI] [PubMed]
- 12.Laiko VV, Baldwin MA, Burlingame AL. Anal. Chem. 2000;72(4):652–647. doi: 10.1021/ac990998k. [DOI] [PubMed] [Google Scholar]
- 13.Carroll DI, Dzidic I, Stillwell RN, Haegele KD, Horning EC. Anal. Chem. 1975;47:2369–2973. doi: 10.1021/ac60358a077. [DOI] [PubMed] [Google Scholar]
- 14.Mason EA, McDaniel EW. Transport Properties of Ions in Gases. Wiley; New York: 1988. [Google Scholar]
- 15.Mesleh MF, Hunter JM, Shvartsburg AA, Schatz GC, Jarrold MF. J. Phys. Chem. 1996;100(40):16082–16086. [Google Scholar]
- 16.Shvartsburg AA, Jarrold MF. Chem. Phys. Lett. 1996;261(12):86–91. [Google Scholar]
- 17.Wyttenbach T, von Helden G, Batka JJ, Carlat D, Bowers MT. J. Am. Soc. Mass Spectrom. 1997;8(3):275–282. [Google Scholar]
- 18.Shvartsburg AA, Schatz GC, Jarrold MF. J. Chem. Phys. 1998;108(6):2416–2423. [Google Scholar]
- 19.Revercomb HE, Mason EA. Anal. Chem. 1975;47:970–983. [Google Scholar]
- 20.Dougard P, Hudgins RR, Clemmer DE, Jarrold MF. Rev. Sci. Instrum. 1997;119:2240. [Google Scholar]
- 21.Wu C, Siems WF, Asbury GR, Hill HH. Anal. Chem. 1998;70:4929–4938. doi: 10.1021/ac980414z. [DOI] [PubMed] [Google Scholar]
- 22.Srebalus CA, Li J, Marshall WS, Clemmer DE. Anal. Chem. 1999;71:3918–3927. doi: 10.1021/ac9903757. [DOI] [PubMed] [Google Scholar]
- 23.Tang K, Shvartsburg AA, Lee HN, Prior DC, Buschbach MA, Li F, Tolmachev A, Anderson GA, Smith RD. Anal. Chem. 2005;77:3330–3339. doi: 10.1021/ac048315a. [DOI] [PMC free article] [PubMed] [Google Scholar]
- 24.Koeniger SL, Merenbloom SI, Clemmer DE. J. Phys. Chem B. 2006;110:7017–7021. doi: 10.1021/jp056165h. [DOI] [PubMed] [Google Scholar]
- 25.Kemper PR, Dupuis NF, Bowers MT. Int. J. Mass Spectrom. in press. [Google Scholar]
- 26.Merenbloom SI, Glaskin RS, Clemmer DE. Anal. Chem. doi: 10.1021/ac801880a. in press. [DOI] [PMC free article] [PubMed] [Google Scholar]
- 27.Lin SN, Griffin GW, Horning EC, Wentworth WE. J. Chem. Phys. 1974;60:4994. [Google Scholar]
- 28.Kemper PR, Bowers MT. J. Phys. Chem. 1991;95:5134–5146. [Google Scholar]
- 29.Siems WF, Wu C, Tarver EE, Hill HH, Larsen PR, McMinn DG. Anal. Chem. 1994;66:4195. [Google Scholar]
- 30.Clemmer DE, Jarrold MF. J. Mass Spectrom. 1997;32:577–592. [Google Scholar]
- 31.Valentine SJ, Plasencia MD, Liu X, Krishnan M, Naylor S, Udseth HR, Smith RD, Clemmer DE. J. Proteome Research. 2006;5:2977–2984. doi: 10.1021/pr060232i. [DOI] [PubMed] [Google Scholar]
- 32.Clowers BH, Ibrahim YM, Prior DC, Danielson WF, Belov ME, Smith RD. Anal. Chem. 2008;80(3):612–623. doi: 10.1021/ac701648p. [DOI] [PMC free article] [PubMed] [Google Scholar]
- 33.Kurulugama R, Nachtigall FM, Lee S, Valentine SJ, Clemmer DE. J. Am. Soc. Mass Spectrom. doi: 10.1016/j.jasms.2008.11.022. in press. [DOI] [PMC free article] [PubMed] [Google Scholar]
- 34.Valentine SJ, Stokes ST, Kurulugama R, Nachtigall FM, Clemmer DE. J. Am. Soc. Mass Spectrom. doi: 10.1016/j.jasms.2009.01.001. in press. [DOI] [PMC free article] [PubMed] [Google Scholar]
- 35.Siems WF, Wu C, Tarver EE, Hill HH, Jr., Larsen PR, McMinn DG. Anal. Chem. 1994;66:4195. [Google Scholar]
- 36.Kanu AB, Gribb MM, Hill HH. Anal. Chem. 2008;80(17):6610–6619. doi: 10.1021/ac8008143. [DOI] [PMC free article] [PubMed] [Google Scholar]
- 37. http://www.negativeiongenerators.com/negativeions.html.


