Abstract
This work presents a method to separately analyze the conservative electric fields (Ec, primarily originating with the scalar electric potential in the coil winding), and the magnetically-induced electric fields (Ei, caused by the time-varying magnetic field B1) within samples that are much smaller than one wavelength at the frequency of interest. The method consists of first using a numerical simulation method to calculate the total electric field (Et) and conduction currents (J) in the problem region, then calculating Ei based on J, and finally calculating Ec by subtracting Ei from Et. The method was applied to calculate electric fields for a small cylindrical sample in a solenoid at 600 MHz. When a non-conductive sample was modeled, calculated values of Ei and Ec were at least in rough agreement with very simple analytical approximations. When the sample was given dielectric and/or conductive properties, Ec was seen to decrease, but still remained much larger than Ei. When a recently-published approach to reduce heating by placing a passive conductor in the shape of a slotted cylinder between the coil and sample was modeled, reduced Ec and improved B1 homogeneity within the sample resulted, in agreement with the published results. (196 words)
Keywords: conservative electric field, magnetically induced electric field, solenoidal coil
1. INTRODUCTION
In high field MR imaging and spectroscopy of small samples, RF energy adsorption in the sample can result in significant sample heating. This has led to a number of designs to produce coils with relatively low electric fields in the sample region [1, 2] and/or to shield the sample from the electric fields produced from the coil [2, 3].
The electric field produced by radiofrequency (RF) coils is often discussed in terms of two components: the conservative electric field (E⃗c), mainly caused by the scalar electric potential in the coil winding, and the magnetically-induced component of the E-field (E⃗i), produced by a changing magnetic flux. In some cases, E⃗c can be a significant component of the total electric field (E⃗T) [4] and can be responsible for the majority of heating in the sample. Some works also indicates that E⃗c within the sample can have significant effects on signal-to-noise ratio (SNR) [4, 5].
To be able to reduce heating, it is necessary to understand its sources. The magnetically-induced component of the E-field (E⃗i) cannot be changed without changing the RF magnetic fields while the other (E⃗c) potentially can. A method to separately calculate these two components could be used to gain insight and evaluate designs related to reducing electric fields with minimal effect on magnetic fields. Here we demonstrate a method for separating the electric fields calculated with a numerical method into conservative and magnetically-induced components.
2. MODELS AND METHODS
The method we present for calculating E⃗c and E⃗i consists of first calculating E⃗T and conduction currents (J⃗) in the problem region using a numerical calculation method, then calculating E⃗i based on J⃗, and finally calculating E⃗c by subtraction of E⃗i from E⃗T. Simple analytical approximations of E⃗c, E⃗i and related power loss are performed for comparison to the numerical calculation results. Finally, a recently-published method for reducing the electric fields in the sample within a solenoid using a specially-shaped passive conductor is modeled using this method.
2.1 Numerical Calculation of Total Electric Field (E⃗T) and Conduction Current (J⃗)
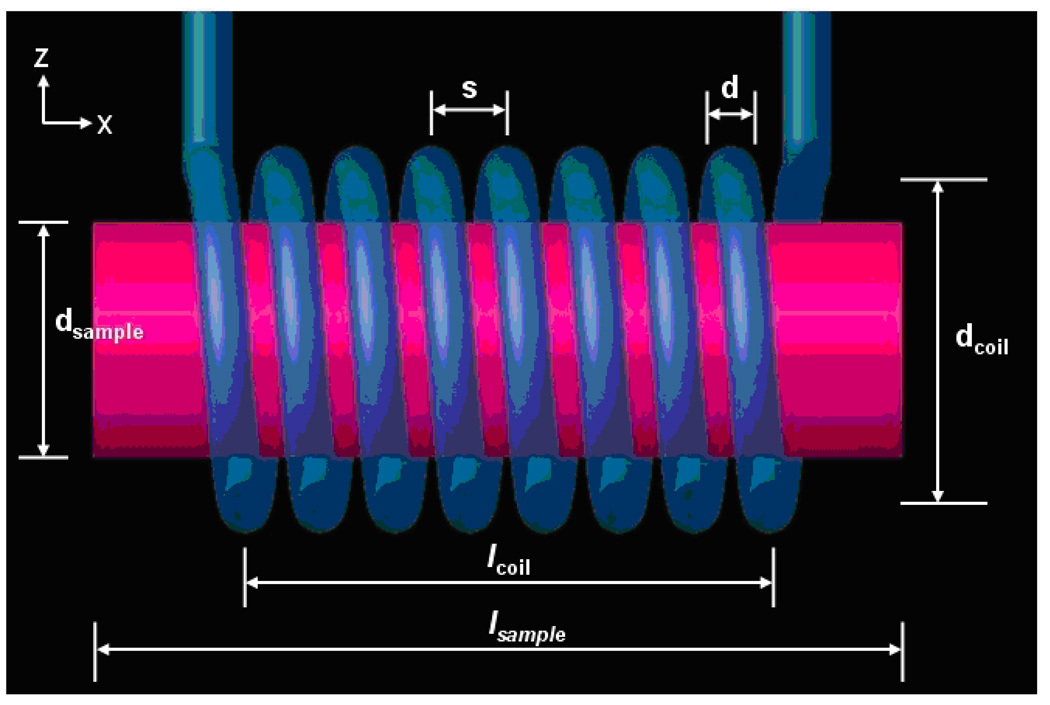
The geometry used in this work consists of a cylindrical sample in a solenoidal coil at 600 MHz (14T). The solenoidal coil was based on a published design having 8 turns of 0.15 mm-diameter round copper wire (d), wound into a solenoid with a diameter (dcoil) of 1.0 mm, length (lcoil) of 2 mm, and distance per turn (s) of 0.231 mm (Fig.1). Samples with different relative permittivity (εr) and electrical conductivity (σ), but with the same diameter (dsample = 0.75 mm) and length (lsample = 2.5 mm) were modeled to mimic air (εr=1, σ=0 S/m), conductor (εr=1, σ=0.2S/m), dielectric (εr=78, σ=0 S/m), and weak saline (εr=78, σ=0.2 S/m). To model a recently-published method for reducing electric fields in the sample [3], we performed an additional calculation with a cylindrical conductor, having a single longitudinal gap, placed between the sample and the coil. Here we refer to this passive conductor as a loop-gap cylinder (LGC). For this application, solenoid and LGC geometries similar to those used in a previously-published work [3] were modeled. The coil had an inner diameter of 3 mm and a length of 3.47 mm, while the LGC had an inner diameter of 2.4 mm and a length of 10.86 mm. The current density J⃗ within both the solenoid and LGC were considered In the determination of E⃗i for this case.
Fig. 1.
Geometry of the solenoidal coil (blue) and the sample (red). Here dcoil is the coil diameter (1.0 mm), s is the distance per turn (s) (0.231 mm), d is the diameter of the round wire (0.15 mm), lcoil is the coil length (2 mm), dsample is the sample diameter (0.75 mm), lsample is the sample length (2.5 mm), and the number of turns is 8.
The calculation of E⃗T could be performed with any of a variety of field simulation methods. Due to availability of software at our site, we chose to use the Finite Difference Time Domain (FDTD) method [6]. All simulations were performed using commercially available software (xFDTD; Remcom, Inc; State College, PA). In all cases the coil was driven with a constant voltage source (1V) in series with a 50Ω resistor connecting the lead wires. Steady-state values of E⃗T, J⃗ and the total magnetic field (B⃗) throughout the problem region were recorded. The mesh resolution for the calculations was 30 µm in each direction.
2.2 Derivation of Conservative (E⃗c) and Magnetically-Induced Electric Fields (E⃗i)
Using values for J⃗ throughout the coil from the Full-Maxwell calculation, E⃗i was calculated as
| (1) |
where
| (2) |
and A⃗ is the magnetic vector potential, ω is the radial frequency, µ0 is the permeability of free space, r indicates the location for which A⃗ is currently being calculated, and r' indicates the location of source current within the solenoid. The integration is performed over the volume of the solenoid wire.
Once both E⃗T and E⃗i are known, E⃗c is calculated as
| (3) |
In this work, the coil diameter (1 mm) is small enough compared to one wavelength (500 mm in air at 600 MHz) that no significant wavelength effects are expected. Thus the displacement current term is negligible [7].
The power dissipated in the sample can be calculated as [8]
| (4) |
where σ is the conductivity of the sample, Ex, Ey, and Ez are the amplitude of the electrical field components in the x, y, and z-directions, and the integration is performed over the volume of the sample. After all fields were calculated, they were normalized so that Bx = 4 µT at the center of the coil.
2.3 Analytical Approximations
To ensure our numerical method for calculating E⃗c, E⃗i and dissipated power is reasonable, simple analytical approximations of electric fields and power dissipation were performed.
2.3.1 Analytical Approximation of |E⃗c|
Using published methods [9], we estimate the inductance of the solenoidal coil to be approximately 24 nH. Thus, the impedance at 600 MHz was approximately j90 Ω. This calculated value was in good agreement with the FDTD numerical simulation result with which had an impedance of 0.05 + j89.38 Ω.
In the numerical calculation, the input was a voltage source with a magnitude of 1V in series with a 50 Ω resistor. Based on the above information,|E⃗c| can be estimated roughly as
| (5) |
where Vcoil is the voltage drop across the solenoidal coil, calculated as
| (6) |
where Vsource is the voltage of the input source (1V), Zcoil is the impedance of the solenoidal coil (j90 Ω) and Ztotal is the total impedance of the solenoidal coil and the 50 Ω resistor connected to the input source (50+ j90 Ω). When assuming 1V is applied at the source (as in the numerical simulations), calculated values are Vsolenoid ≅ 0.874 V, and |E⃗c| ≅ 351 V/m. When the normalization factor used to bring Bx at the center of the sample to 4 µT is applied to this analytical case, |E⃗c| becomes 30.0 V/m (Table 1).
Table 1.
Comparison of rough analytical approximations and numerical calculation results. The maximum conservative and magnetically-induced electric fields were calculated within the sample.
| Analytical Results | Numerical Results | |
|---|---|---|
| Maximum Ec (V/m) |
30 | 42.6 |
| Maximum Ei (V/m) |
2.8 | 2.9 |
| Sample Power Loss (µW) |
0.10 | 0.073 |
2.3.2 Analytical Approximation of |E⃗i|
Using Faraday’s law and assuming a homogeneous B1 field in the sample near the center of the solenoid, |E⃗i| within the sample can be calculated as
| (7) |
If |B⃗| is 4 µT, the calculated maximum |E⃗i| within the sample on the center plane (x=0) is about 2.8 V/m (Table 1).
2.3.3 Analytical Approximation of the Sample Power Loss
For a simple analytical estimation of the sample power loss, it was assumed that B⃗ was uniform throughout the entire sample. Based on Eq. 3–7 and previous research [8–9],
| (8-a) |
Because E⃗c is generally in the axial direction and E⃗i is generally in the circumferential direction, we can expect them to be fairly perpendicular within the sample, so that
| (8-b) |
Where R is the sample radius (0.375 mm) and L is the sample length (2.5 mm). Using Eq. [7], we can find
| (8-c) |
If σ is 0.2 S/m, Ec is 30 V/m, B is 4 µT, L is 2.5mm, and R is 0.375mm, the calculated sample power loss is 0.10 µW (Table 1).
3. RESULTS
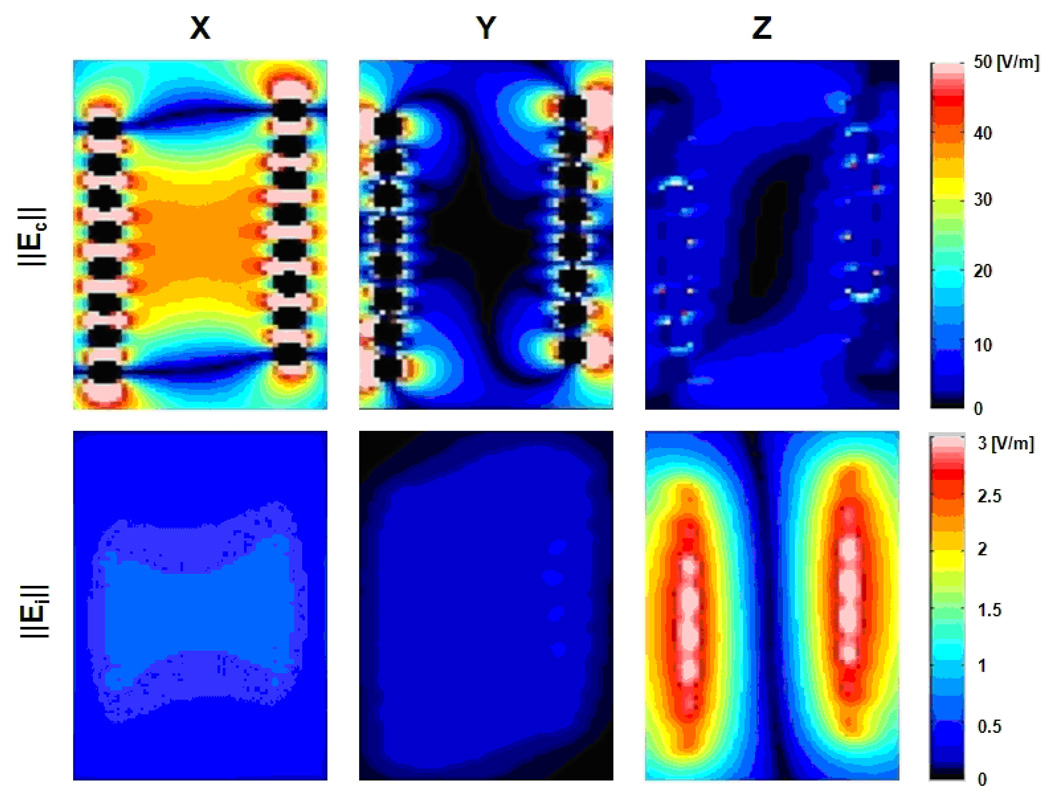
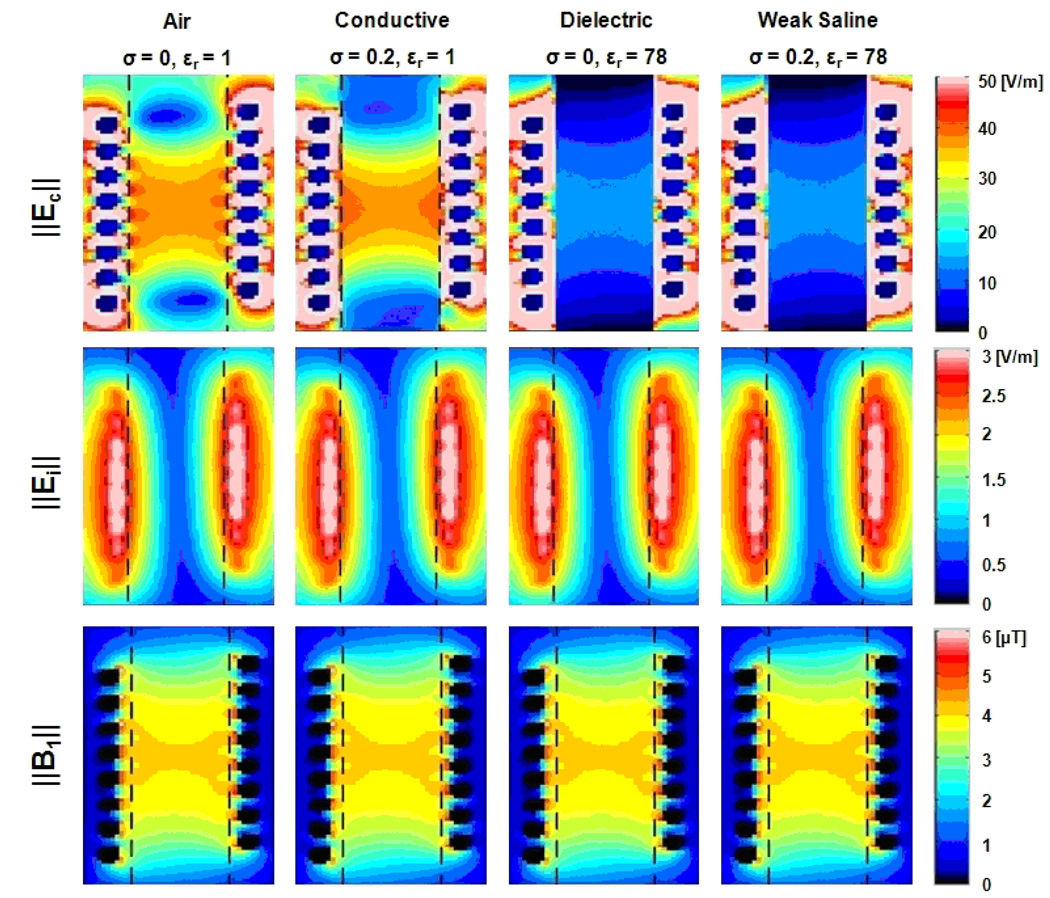
In all simulation conditions, E⃗c was much stronger than E⃗i (by more than an order of magnitude) within and surrounding the sample (Fig. 2 and 3). This result is consistent with simple analytical approximations (Table 1).
Fig. 2.
Magnitudes of x, y, and z-oriented components of Conservative E-field (Ec, top) and Magnetically-induced E-field (Ei, bottom) in the empty solenoidal coil driven at 600 MHz to produce 4 µT at the coil center. On the plane shown, X is axial (up-down on page), Y is radial (left-right on page), and Z is circumferential (in-out of page). Linear color scale is from 0 to 3 V/m for Ei and from 0 to 50 V/m for Ec. Ec is primarily xoriented whereas Ei is primarily z-oriented, and Ec is much stronger than Ei within and surrounding the sample.
Fig. 3.
Approximate total magnitude of conservative E-field (Ec, top), magnetically-induced E-field (Ei, middle) and magnetic flux density (B, bottom) after normalization when loaded with a cylindrical sample containing various materials. Linear color scale from 0 to 3 (V/m) for Ei, from 0 to 50 (V/m) for Ec, and from 0 to 6 (µT) for B. The dashed black lines indicate the region of the sample.
Though still remaining significantly larger than E⃗i, the E⃗c within the sample was reduced when the sample had conductive and/or dielectric properties (Fig. 3). This is to be expected, because when electric fields are applied to a conductive and dielectric sample, multi-polar molecules are re-oriented and charged particles are displaced to boundaries, resulting in a polarization field that opposes the applied field.
E⃗c is primarily oriented in the × direction in the solenoid because the scalar potential changes along the length of the wire, which is wound along the x-axis (Fig. 1). For E⃗i, the z-component (circumferential direction; perpendicular to plane shown in Fig. 2 and 3) is dominant because (following Faraday’s Law) E⃗i is perpendicular to the magnetic flux density (B⃗), which is oriented in the x-direction. Values for E⃗i are nearly zero along the axis of the sample and coil, and are seen to increase with radial distance from the central axis near the longitudinal center of the coil. This meets expectations from Faraday’s Law, which, in this geometry, indicates that E⃗i is directly proportional to r (Eq. 7).
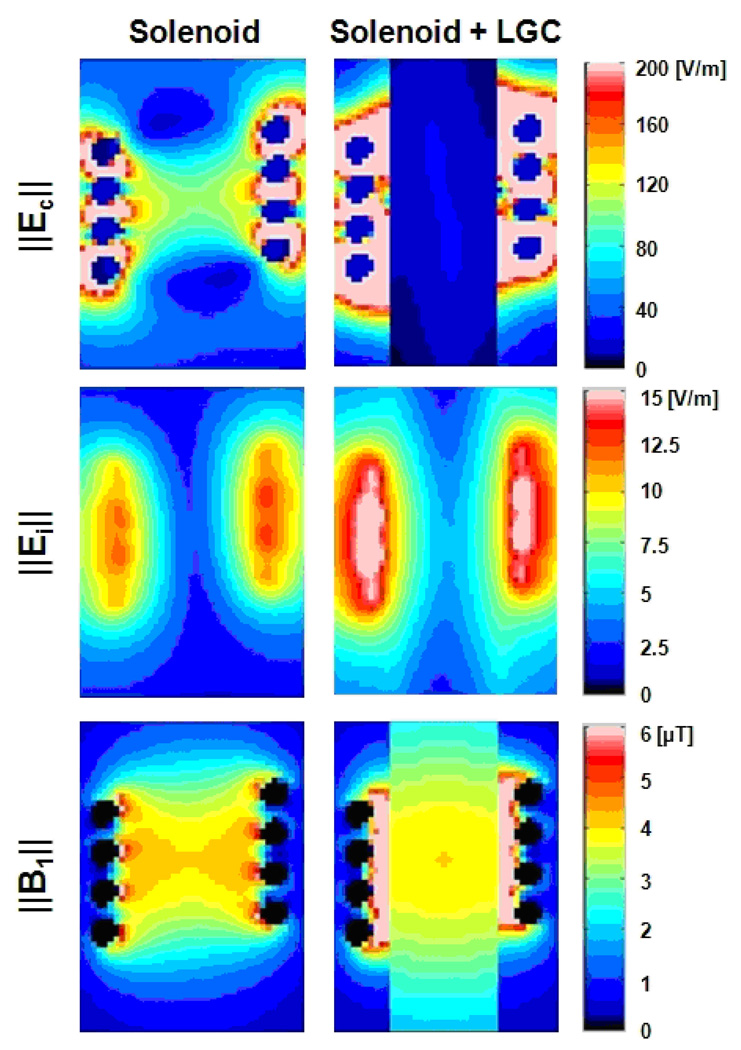
When a cylindrical conductor with a single longitudinal gap is placed between the sample and the solenoid, a reduction in the electric fields and a relative increase in B1 field homogeneity are seen, in agreement with previously-published experimental results [3] (Figure 4).
Fig. 4.
Approximate total magnitude of conservative E-field (Ec, top), magnetically-induced E-field (Ei, middle) and magnetic flux density (B, bottom) after normalization when loaded with (second column) and without (first column) loop-gap cylinder (LGC). Coil ID (3 mm) and length (3.47 mm) were modified to follow the previous research.
4. DISCUSSION
Both the scalar electric potential along the coil wire and the changing vector magnetic potential A⃗ produced by the coil current, can create electric fields [7]. In an empty solenoidal coil, E⃗c can be much bigger than E⃗i (Fig. 2 and 3). The E⃗c distribution presented here is in agreement with the total electric field pattern presented in a previous work [2]. This is further evidence that the contribution of conservative electric fields can be dominant in solenoidal micro-coils.
Based on Faraday’s Law, E⃗i in the sample is induced by a time-varying magnetic field B⃗, which is caused by the conduction current in the coil. In the case of a solenoidal coil that is very small compared to the electrical wavelength, the presence of a dielectric or a weakly-conductive sample has little effect on the distribution of coil currents or B⃗ field distribution. As a result, E⃗i appears to be relatively independent of sample properties.
As presented in Fig. 2 and Fig 3, the dominant factor of the sample power loss (P = σE2) is E⃗c, not E⃗i. These results are in good agreement with previous works indicating that magnetically-induced losses are negligible in high frequency microcoils filled with conducting samples [4, 9].
The total absorbed power (Pabs) in the sample was calculated based on Eq. [4]. Table 2 shows the numerical calculation results of sample power loss. As the relative permittivity (εr) of the sample is increased from 1 to 78, the power loss of the sample is changed by an order of magnitude. This is mainly caused by the decrease of E⃗c within the sample due to the polarization field as discussed previously (Fig. 3).
Table 2.
Numerical calculation results of the normalized sample power loss (Psample) caused by the conservative and magnetically-induced electric field components.
| σsample (S/m) |
εr,sample | Psample from Ec (nW) |
Psample from Ei (nW) |
|---|---|---|---|
| 0.2 | 1 | 74.728 | 0.254 |
| 0.2 | 78 | 8.971 | 0.253 |
The agreement between numerically-calculated values and analytical approximations (Table 1) indicates that our numerical approach yields reasonable results. Comparison to more exact analytical approximations for MR-relevant geometries is, to our knowledge, not feasible at this time. Some differences between numerical and analytical results (Table 1) of the maximum Ec and sample power loss are likely caused by simplifications and assumptions used in making the analytical approximations, such as assuming negligible displacement current and homogeneous B1 field within the sample. Our analytical approximation of Ec based on only the drop in electric potential along the solenoid winding divided by the solenoid length is clearly a major simplification.
For an initial application and demonstration of the method, we simulated a solenoidal coil with and without a passive conductor in the form of a loop-gap cylinder (LGC) inside to shield the interior of the coil from conservative E-fields [3]. As shown in Fig. 4, the addition of the LGC proved to both significantly shield the interior region of the coil from conservative E fields and improve the homogeneity of the B1 field along the axis of the coil, in agreement with previously-published experimental results. In our calculations, the improvement in homogeneity along the coil axis is related to both increased sensitivity over a larger volume and lower efficiency at the coil center, as greater coil current is required to maintain the same B1 field magnitude there.
5. CONCLUSIONS
In summary, we have presented a new method to calculate conservative E-fields (E⃗c) and magnetically induced E-fields (E⃗i), during high frequency micro-imaging, for both loaded and unloaded cases. To the degree they could be compared, these simulation results were in reasonable agreement with the total electric field pattern presented in a previous work and analytical approximations. In all cases, the maximum E⃗c was much bigger than the maximum E⃗i by more than a factor of ten. In dielectric and conductive samples, E⃗i within the sample had a dramatic decrease (but was still bigger than E⃗i ) whereas E⃗i was almost constant.
The method of analysis utilized here could be useful as long as no significant wavelength effects are present, and as long as J⃗ in the coil and good conductors is much greater than that in the sample. Thus, this method may be useful not only for the evaluation of high field microimaging but also as an alternative method of evaluating fields within loaded gradient coils or larger RF coils at very low-frequencies.
ACKNOWLEDGMENTS
Funding for this work was provided by the National Institutes of Health (NIH) through R01 EB000454 and R01 EB000895, and by the Pennsylvania Department of Health.
Footnotes
Publisher's Disclaimer: This is a PDF file of an unedited manuscript that has been accepted for publication. As a service to our customers we are providing this early version of the manuscript. The manuscript will undergo copyediting, typesetting, and review of the resulting proof before it is published in its final citable form. Please note that during the production process errors ay e discovered which could affect the content, and all legal disclaimers hat apply to the journal pertain.
REFERENCES
- 1.Gor’kov PL, Chekmenev EY, Li C, Cotton M, Buffy JJ, Traaseth NJ, Veglia G, Brey WW. Using low-E resonators to reduce RF heating in biological samples for static solid-state NMR up to 900 MHz. Journal of Magnetic Resonance. 2007;185:77–93. doi: 10.1016/j.jmr.2006.11.008. [DOI] [PubMed] [Google Scholar]
- 2.Doty FD, Kulkarni J, Turner C, Entzminger G, Bielecki A. Using a cross-coil to reduce RF heating by an order of magnitude in triple-resonance multinuclear MAS at high fields. J. Magn. Reson. 2006;128:239–253. doi: 10.1016/j.jmr.2006.06.031. [DOI] [PubMed] [Google Scholar]
- 3.Krahn A, Priller U, Emsley L, Engelke F. Resonator with reduced sample heating and increased homogeneity for solid-state NMR. J. Magn. Reson. 2008;191:78–92. doi: 10.1016/j.jmr.2007.12.004. [DOI] [PubMed] [Google Scholar]
- 4.Minard KR, Wind RA. Solenoidal microcoil design-Part II: optimizing winding parameters for maximum signal-to-noise performance. Concepts Magn. Reson. 2001;13A:190–210. [Google Scholar]
- 5.Hoult DI, Richards RE. The signal-to-noise-ratio of the nuclear magnetic resonance experiment. J. Magn. Reson. 1976;24:71–85. doi: 10.1016/j.jmr.2011.09.018. [DOI] [PubMed] [Google Scholar]
- 6.Yee K. Numerical solution of initial boundary value problems involving Maxwell's equations in isotropic media. IEEE Transactions on Antennas and Propagation. 1966;14:302–307. [Google Scholar]
- 7.Mao W, Chronik BA, Feldman RE, Smith MB, Collins CM. Consideration of magnetically-induced and conservative electric fields within a loaded gradient coil. Magn. Reson. Med. 2006;55:1424–1432. doi: 10.1002/mrm.20897. [DOI] [PubMed] [Google Scholar]
- 8.Collins CM, Smith MB. Signal-to-noise ratio and absorbed power as functions of main magnetic field strength, and definition of “90°” RF pulse for the head in the birdcage coil. Magn. Reson. Med. 2001;45:684–691. doi: 10.1002/mrm.1091. [DOI] [PubMed] [Google Scholar]
- 9.Webb AG. Radiofrequency microcoils in magnetic resonance. Prog. Nuc. Magn. Reson. Spec. 1997;31:1–42. doi: 10.1016/j.jmr.2012.10.004. [DOI] [PubMed] [Google Scholar]


