

Abstract
Summary:ArrayExpress is one of the largest public repositories of microarray datasets. R/Bioconductor provides a comprehensive suite of microarray analysis and integrative bioinformatics software. However, easy ways for importing datasets from ArrayExpress into R/Bioconductor have been lacking. Here, we present such a tool that is suitable for both interactive and automated use.
Availability: The ArrayExpress package is available from the Bioconductor project at http://www.bioconductor.org. A users guide and examples are provided with the package.
Contact: audrey@ebi.ac.uk
Supplementary information:Supplementary data are available Bioinformatics online.
1 INTRODUCTION
ArrayExpress is a public database for high-throughput functional genomics data (Parkinson et al., 2009). It consists of a repository, which is a MIAME (Brazma et al., 2001) supportive public archive of microarray data, and an added value gene expression Atlas created from the repository data. Currently, nearly 8000 experiments comprising 230 000 arrays are available from ArrayExpress. Retrieving publicly available data for analysis is a repetitive and error prone task for which automation is desirable. As Bioconductor (Gentleman et al., 2004) contains many widely used tools for the data analysis, tools to make a connection with public databases are useful. The GEOquery package (Davis and Meltzer, 2007) was developed to load GEO datasets into Bioconductor, and the RMAGEML package (Durinck et al., 2004) was designed to import the MAGE-ML files that in the past were used by ArrayExpress for data transfer. The ArrayExpress database now supports the MAGE-TAB format (Rayner et al., 2006), a metadata-rich, but much simpler and more resource-efficient format based on tab-delimited files and all data are made available in this format. We have developed the ArrayExpress package for R/Bioconductor to query ArrayExpress and convert MAGE-TAB formatted datasets from the ArrayExpress repository into objects of the Bioconductor class for microarray datasets, eSet.
2 MIAME
MIAME is a guideline that describes the Minimum Information About a Microarray Experiment needed to ensure interpretation of a microarray dataset. It has five elements: (i) the raw data for each hybridization, (ii) the final processed data for the set of hybridizations in the experiment, (iii) the experiment design including sample data relationships and the essential sample annotation including experimental factors and their values, (iv) sufficient annotation of the array design and (v) essential laboratory and data processing protocols.
3 MAGE-TAB
MAGE-TAB is a tabular MIAME supportive file format and MAGE-TAB documents consist of five different types of files. (i) A ‘raw’ zip archive contains the raw data files, i.e. the files produced by the microarray image analysis software, such as CEL files for Affymetrix GeneChips or GPR files from GenePix. (ii) A ‘data matrix’ file contains processed values, as provided by the data submitter, converted into a common tab-delimited text format representing a matrix of numbers. (iii) The Sample and Data Relationship Format (SDRF) tab-delimited file contains the relationships between samples and arrays, as well as sample properties and experimental factors, as provided by the data submitter. (iv) The Array Design Format (ADF) tab-delimited file describes the design of an array, i. e. the sequence located at each feature on the array and annotation of the sequences. (v) The Investigation Description Format (IDF) tab-delimited file contains top-level information about the experiment including title, description, submitter contact details and protocols.
4 BIOCONDUCTOR CLASSES
The Bioconductor class eSet is a different implementation of the MIAME standard. The class has various specializations, or subclasses, that are adapted to specific array technologies, among these are ExpressionSet for generic one-colour datasets, NChannelSet for generic two-colour datasets and AffyBatch for data from Affymetrix GeneChips. Objects of this class contain one or more identical-sized numeric matrices as assayData elements. They also include a table describing the sample–array relationship as phenoData and a table describing the array features as featureData. Details of experimental methods are in the component structure experimentData.
5 RETRIEVING AND CONVERTING MAGE-TAB DATA
The ArrayExpress package uses the zip archive with either the raw or the processed data to build the assayData component. The SDRF file is used to construct the phenoData table. The ADF file is used to construct the featureData, and the IDF file to fill in the experimentData components.
5.1 Raw data
To import a raw dataset from ArrayExpress, one can use the following R code after loading the package:
As E-ATMX-18 is a two-colour experiment, the returned R object is of class NChannelSet. If the identifier refers to an Affymetrix experiment, the output is an AffyBatch, if it refers to a one-colour experiment using a platform other than Affymetrix, the output is an ExpressionSet. The ArrayExpress function extracts feature intensity summaries from columns of the raw data files based on the common conventions for the data file sources. If the data source is not recognized, or the file does not have the expected column names, the user is asked to explicitly provide the name of the column(s) to extract, for instance, ‘Cy3 Median’. In some cases, there is a mismatch between the sample or feature annotations and the intensity data files; in such cases, a warning is emitted, the phenoData and/or featureData components are left empty and an incomplete (but syntactically valid) object is returned. Tested on the 5298 accessions with raw datasets that were available from the ArrayExpress repository in March 2009, the ArrayExpress function managed to create a complete object in 58% of the cases (Table 1). The 42% of cases in which the function failed or an incomplete object was produced are due to a variety of reasons, including missing or contradictory data in the repository. We are actively working on manually curating these cases and resolving problems as much as possible; however, due to the repository's role as a public record of scientific activity, problems inherent to information submitted by the contributors may persist.
Table 1.
Application of the ArrayExpress package to the ArrayExpress database in March 2009
| Number of accessions | 6117 | |
| Number of datasets | 6891 | |
| Objects created fully automatically | 5550 | 81% |
| Complete objects created | 4017 | 58% |
| Affymetrix | 3407 | |
| Two-colour | 89 | |
| One-colour | 521 | |
| Incomplete objects | 1533 | 22% |
| Missing feature annotation | 1121 | |
| Missing sample annotation | 466 | |
| Objects created with manual selection of columns | 619 | 9% |
| Object creation failed | 722 | 10% |
The number of datasets is higher than the number of accessions since some accessions store multiple datasets (we consider measurements made with different arrays and different datasets). Manual setting of column names was necessary for 1082 (16%) of the 6891 datasets, and we were successful in 619 (9%) cases.
In addition to calling the one-stop function ArrayExpress, it is possible to download the data for local storage using the function getAE and to import a locally stored MAGE-TAB document with the function magetab2bioc.
5.2 Processed data
The way processed data are handled in the database is less uniform than for raw data, because processing methods vary more than the microarray image analysis software outputs. To import a processed dataset from ArrayExpress, three steps are required: download the dataset, identify which column is of interest, create the R object. Example code looks as follows:
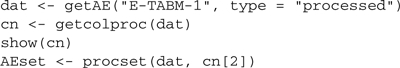
Here, cn is a character vector of all columns in the processed data, and after visual inspection, we decided to use the second one.
6 APPLICATION
We used the queryAE function to list all datasets concerned with breast cancer in Homo sapiens. Then, using the ArrayExpress function, we created R objects from all datasets for which raw data were available. We counted, for each dataset, the number of arrays and features. The Supplementary table summarizes the results of this analysis. This could now be followed by an integrative analysis of the data, a complex and open-ended task for which essential tools are provided in the Bioconductor project: the quality of the datasets could be assessed with the help of the arrayQualityMetrics package (Kauffmann et al., 2009), they could be normalized and analysed for differential expression of genes and gene sets (Hahne et al., 2008), and the combination of different datasets is facilitated, for example, by the MergeMaid package (Cope et al., 2004).
7 CONCLUSIONS
The ArrayExpress package is freely available, open source and easy to use. As most of the Bioconductor tools for microarray analysis process eSet objects, the package facilitates large-scale analyses of public data. A strength of the package is the richness, accuracy and standardized format of the metadata that it imports together with the array intensity data. In fact, the diagnostics produced by the package during dataset import from the ArrayExpress repository are currently used by the curators to decrease the number of problematic experiments and improve the quality of the content delivered. For the end user, the ArrayExpress package eliminates, or at least greatly reduces the amount of manual intervention needed and helps towards automated processing of large collections of datasets. Table 1.
Supplementary Material
ACKNOWLEDGEMENTS
We would like to thank A. Tikhonov, J. Cho, R. Santamaria and the ArrayExpress group.
Funding: EU FP6 (EMERALD, LSHG-CT-2006-037686); National Institutes of Health (5P41HG003619-05).
Conflict of Interest: none declared.
REFERENCES
- Brazma A, et al. Minimum information about a microarray experiment (MIAME) – toward standards for microarray data. Nat. Genet. 2001;29:365–371. doi: 10.1038/ng1201-365. [DOI] [PubMed] [Google Scholar]
- Cope L, et al. MergeMaid: R tools for merging and cross-study validation of gene expression data. Stat. Appl. Genet. Mol. Biol. 2004;3:29. doi: 10.2202/1544-6115.1046. [DOI] [PubMed] [Google Scholar]
- Davis S, Meltzer PS. GEOquery: a bridge between the Gene Expression Omnibus (GEO) and BioConductor. Bioinformatics. 2007;23:1846–1847. doi: 10.1093/bioinformatics/btm254. [DOI] [PubMed] [Google Scholar]
- Durinck S, et al. Importing MAGE-ML format microarray data into Bioconductor. Bioinformatics. 2004;20:3641–3642. doi: 10.1093/bioinformatics/bth396. [DOI] [PubMed] [Google Scholar]
- Gentleman RC, et al. Bioconductor: open software development for computational biology and bioinformatics. Genome Biol. 2004;5:R80. doi: 10.1186/gb-2004-5-10-r80. [DOI] [PMC free article] [PubMed] [Google Scholar]
- Hahne F, et al. Bioconductor Case Studies. New York: Springer; 2008. [Google Scholar]
- Kauffmann A, et al. arrayQualityMetrics – a Bioconductor package for quality assessment of microarray data. Bioinformatics. 2009;25:415–416. doi: 10.1093/bioinformatics/btn647. [DOI] [PMC free article] [PubMed] [Google Scholar]
- Parkinson H, et al. ArrayExpress update – from an archive of functional genomics experiments to the atlas of gene expression. Nucleic Acids Res. 2009;37:D868–D872. doi: 10.1093/nar/gkn889. [DOI] [PMC free article] [PubMed] [Google Scholar]
- Rayner TF, et al. A simple spreadsheet-based, MIAME-supportive format for microarray data: MAGE-TAB. BMC Bioinformatics. 2006;7:489. doi: 10.1186/1471-2105-7-489. [DOI] [PMC free article] [PubMed] [Google Scholar]
Associated Data
This section collects any data citations, data availability statements, or supplementary materials included in this article.