

Abstract
Motivation: Integration of various genome-scale measures of molecular alterations is of great interest to researchers aiming to better define disease processes or identify novel targets with clinical utility. Particularly important in cancer are measures of gene copy number DNA methylation. However, copy number variation may bias the measurement of DNA methylation. To investigate possible bias, we analyzed integrated data obtained from 19 head and neck squamous cell carcinoma (HNSCC) tumors and 23 mesothelioma tumors.
Results: Statistical analysis of observational data produced results consistent with those anticipated from theoretical mathematical properties. Average beta value reported by Illumina GoldenGate (a bead-array platform) was significantly smaller than a similar measure constructed from the ratio of average dye intensities. Among CpGs that had only small variations in measured methylation across tumors (filtering out clearly biological methylation signatures), there were no systematic copy number effects on methylation for three and more than four copies; however, one copy led to small systematic negative effects, and no copies led to substantial significant negative effects.
Conclusions: Since mathematical considerations suggest little bias in methylation assayed using bead-arrays, the consistency of observational data with anticipated properties suggests little bias. However, further analysis of systematic copy number effects across CpGs suggest that though there may be little bias when there are copy number gains, small biases may result when one allele is lost, and substantial biases when both alleles are lost. These results suggest that further integration of these measures can be useful for characterizing the biological relationships between these somatic events.
Contact: E_Andres_Houseman@brown.edu
Supplementary information: Supplementary data are available at Bioinformatics online.
1 INTRODUCTION
New hopes for identifying novel carcinogenesis pathways and potential therapeutic targets (Ng et al., 2006; Shai, 2006) arise from emerging technologies for examination of cancer transcriptomes, genomes, epigenomes, metabolomes, proteomes, and microRNAomes. The advent of next-generation high-throughput sequencing technologies will create high resolution datasets of somatic events that contribute to or accompany carcinogenesis. However, statistical analyses to date have focused solely on a single -omic level (Sjoblom et al., 2006; Sugarbaker et al., 2008; Wood et al., 2007) or, at most, integrated different types of genomic changes (Leary et al., 2008) or genomic changes with accompanying gene expression (Parsons et al., 2008). To truly understand the carcinogenic process and make strides in cancer prevention and treatment, new analytic approaches are needed to more completely and most appropriately integrate across various -omic level datasets (Risch and Plass, 2008; Zender and Lowe, 2008) in large numbers of specimens. However, such analyses will be complicated by differences in the resolution, quality, content, and design of the various assays used, as well as by issues related to specimen source, specimen type (formalin fixed vs. fresh), and specimen quality. Large-scale databases of somatic genetic and epigenetic alterations from CaBIG (Kakazu et al., 2004), The Cancer Genome Atlas (Hanauer et al., 2007) and NIH Roadmap initiative studies will require development of appropriate methodologies for integrating data in a manner that will be both useful and statistically rigorous.
Studies of genome-wide copy number alterations in human tumors are possible through the use of SNP-array technologies, such as the Mapping 500K arrays, or newer genome-wide SNP arrays, commercially available from Affymetrix. These arrays were designed to interrogate constitutional genetic variation, initially at SNPs (Mapping arrays), and later at both SNPs and other copy number polymorphic regions. Somatic single base-pair copy number alterations in tumors are determined either by algorithms that infer copy number from tumor DNA alone or through comparisons of constitutional DNA (i.e. blood or buccal-derived) and tumor DNA, which allows for determining changes in heterozygosity compared with normal tissue. These arrays are highly sensitive and specific.
In parallel, analyses of epigenetic alterations, and specifically promoter CpG island DNA methylation can be performed using BeadArray technologies for both cancer related genes (Goldengate Methylation panel), or genome wide (HumanMethylation27 BeadChip Infinium) commercially available from Illumina. Again, these assays were initially designed for SNP detection, but have been applied to DNA methylation detection using the same sodium bisulfite modification approaches used in the gold standard bisulfite sequencing techniques.
While deep sequencing promises to supplant the present technology in the next decade, it is still out of reach for many researchers. The ability to sequence an entire individual's genome for less than $1000 remains an elusive goal, and methods development is still in its infancy (Morozova and Marra, 2008). As a result, platforms such as Illumina are the sole tool available for epidemiological assessment for large sample sizes. In addition, the Illumina GoldenGate platform has, even recently, been considered as a gold standard (Irizarry et al., 2008). Consequently, we believe it will remain the major platform for population studies for the foreseeable future, especially epidemiologists who require moderate to large sample sizes.
The specific question we address in this manuscript is the following: does the physical number of copies of a particular gene (or, more generally, genomic element) influence the detection of DNA methylation at the location of that element, thereby masking any real relationships between these alterations? Although Illumina used dilution experiments to assess the sensitivity of the methylation assay in the development of the GoldenGate® Methylation Platform, these types of experiments cannot adequately assess how discrete copy number variation may affect the results of the assay (Bibikova et al., 2006). On the other hand, it is difficult to perform controlled experiments to assess biases in methylation related to copy number (i.e., systematic differences that reflect assay properties and not underlying biology) because there are no known mechanisms for inducing methylation at specific sites in living cells, nor any for inducing copy number variations that are reliably independent of methylation patterns. Therefore, we present a detailed analysis of the statistical properties of the GoldenGate methylation assay. We also show observational data from two types of human cancers, head and neck squamous cell carcinoma (HNSCC) and mesothelioma, to validate the expected characteristics of the assay and the systematic signals of assay bias detected in the observational data.
2 METHODS
2.1 Specimens and assays
Our methods were motivated by methylation array data we obtained for two independent types of cancers, HNSCC and malignant pleural mesothelioma tumors. The studies from which the patients came have been previously described (Christensen et al., 2008; Hsiung et al., 2007; Marsit et al., 2006). Histological classification of the malignancy was reported by pathology of the participating hospital, and confirmed by independent study pathologist. All cases enrolled in the study provided written, informed consent as approved by the IRBs of the participating institutions. The HNSCC tumors examined in this analysis were obtained for patients undergoing surgical resection of their incidence HNSCC at the Massachusetts Eye and Ear Infirmary, Boston, MA, while the mesothelioma tumors were obtained from patients at the Brigham and Women's Hospital in Boston, MA. We used fresh frozen tumor specimens and matched peripheral blood samples for 19 HNSCC patients and 23 mesothelioma patients for analysis of promoter hypermethylation and copy number alterations.
2.2 DNA extraction and methylation analysis
DNA was extracted from the peripheral blood and tumor samples using the QIAamp DNA mini kit according to the manufacturer's protocol (Qiagen, Valencia, CA). Sodium bisulfite modification of the tumor DNA was performed using the EZ DNA Methylation Kit (Zymo Research, Orange, CA) following the manufacturer's protocol, with the addition of a 5-min initial incubation at 95○C prior to addition of the denaturation reagent to allow for more complete sodium bisulfite conversion. Illumina GoldenGate methylation bead arrays were used to simultaneously interrogate 1505 CpG loci associated with 803 cancer-related genes in the modified tumor DNA. Bead arrays were run at the UCSF Institute for Human Genetics, Genomics Core Facility according to the manufacturer's protocol and as described in Bibikova et al. (2006).
2.3 Copy number status using Affymetrix arrays
Copy number alterations were determined by hybridizing the DNA obtained from the matched tumor and peripheral blood from the same patient as the referent using the 500 K SNP array (Affymetrix, Santa Clara, CA) (Bignell et al., 2004) at the Harvard Partners Microarray Core Facility following established protocols according to the manufacturer. Resulting data was analyzed first to make genotyping calls using the Affymetrix GeneChip DNA Analysis Software V4.1 (Liu et al., 2003). Copy number (n) was assigned using the Copy Number Analysis Tool v4.0.1 (Huang et al., 2004) (CNAT, Affymetrix) which utilizes a Hidden Markov Model algorithm to define n, similar to previous examinations in other malignancies (Liu et al., 2006). We note that ‘n=4’ technically means amplification (multiple copy gain), and is thus more properly interpreted as ‘n≥4’. However, to avoid complications in notation, we will continue to denote this amplification state as ‘n=4’. We also emphasize the use of a control referent, which rules out gross misclassification of quadraploid tumors.
2.4 Statistical properties of the Goldengate methylation assay
The result of the GoldenGate methylation array is a sequence of ‘beta’ values, one for each of 1505 loci, calculated as the average of ∼30 replicates (30 beads per site per sample) of the quantity max(M, 0)/(|U| + |M| + ε), where U is the green fluorescent signal from an unmethylated allele on a single bead, M is the red signal from a methylated allele, and ε is a constant chosen to ensure that the quantity is well-defined; an absolute value is used in the denominator of the formula to compensate for negative signals due to background subtraction. We assume in the sequel that M≥0 and U≥0, so that the beta value reduces to M/(M + U + ε). Under this assumption, a more technical definition for the beta value  at locus j for array i is
where k indexes each of the κj ≈ 30 beads used to form the assay measurement. Illumina also reports the auxiliary quantities Ūij=κj−1 ∑k=1κj Uijk (‘Cy3’) and  (‘Cy5’), from which the following quantity, approximately equal to
  , can be constructed:
  . In order to understand the statistical properties of the assay, we assume that Mijk ∼ Gamma(αij, λij) and Uijk ∼ Gamma(βij, λij), and that the target quantity of interest is μij = αij/(αij + βij). It follows that Rij ∼ Beta(κjαij, κj βij) and is therefore an unbiased estimator of μij. However,
showing that  is slightly biased in the negative direction, and that the magnitude of the bias varies inversely with αij + βij. Note also that
but
so that  is slightly less variable than Rij. For both measures, variability is more pronounced with smaller signal. It follows that for any nondecreasing transformation
  and ϕ(Rij) of
  and Rij,
  . In addition, if αij + βij increases with some other factor nij (e.g. copy number), then
  when nij <ni′j′. That is, the bias is less pronounced with greater signal. Note that signal amplification never induces bias in Rij as long as the amplification occurs at the same rate for both methylated and unmethylated signals, i.e. αij=fj(nij)α0j and βij=fj(nij)β0j for some CpG-specific amplification function fj and CpG-specific constants (α0j, β0j), as would occur with a well-defined biological mixture of methylated and unmethylated genome and no binding-affinity bias imparted by copy number changes.
Illumina also provides a detection P-value, based on the comparison of signal Mij + Uij from the target sample with that from a negative control (Illumina User Guide, 2008). If  increases with nij, then it is reasonable to assume that detection P-values would have small values with greater frequency when nij is large. We note that the P-values are constructed by comparing Mij + Uij to values generated by negative controls only, so that the P-values are biased against detecting poor signal among methylated CpGs.
2.5 Statistical analysis
To demonstrate that observational data follow the mathematical properties described in the previous section, we conducted an analysis of the HNSCC and mesothelioma tumors described above. Of 1505 CpG loci assayed, 1497 passed quality-assurance procedures (median detection P-value < 0.05). Of those, we excluded 84 X-chromosome loci, for a remainder of 1413 loci. For each tumor i, we compared  and Rij across all j via scatter-plot (Supplementary Fig. 1). For all but one HNSCC tumor,
  and Rij and were highly correlated (Spearman correlation > 0.9998). Because one HNSCC tumor sample showed poorer correspondence (Spearman correlation=0.82) we considered analyses separately with and without it; as there were no major changes in our conclusions, we have chosen only to present other analytic results for the 18 HNSCC with correlation >0.99. All mesothelioma tumors had Spearman correlation >0.9996. We matched each CpG locus to its closest Affymetrix SNP using RS number. That is, for each CpG site j, we found the Affymetrix SNP for which the difference between the RS number for the CpG and RS number for the SNP was smallest. Supplementary Figure 2 shows the distribution of the resulting minimized differences. The result was that for each of tumor i and 1413 loci j, we had the following quantities:
  , Rij, nij, and a P-value πij for
  . Table 1 shows a cross-classification of significant detection P values with copy number.
Table 1.
Summary statistics of copy number changes among 1413 SNPs that are near 1413 CpGs interrogated by GoldenGate, cross-classified by the detection P-value reported by Illumina for the nearby CpG
| Det P≥0.05 | Det P<0.05 | % (Det P≥0.05) | ||
|---|---|---|---|---|
| HNSCC (18 tumors with R>0.99) | 0 copies | 0 | 0 | N/A |
| 1 copy | 7 | 858 | 0.8 | |
| 2 copies | 122 | 23 429 | 0.5 | |
| 3 copies | 2 | 919 | 0.2 | |
| 4 copies | 0 | 97 | 0.0 | |
| HNSCC (1 tumor with R=0.82) | 0 copies | 3 | 5 | 37.5 |
| 1 copy | 10 | 195 | 4.9 | |
| 2 copies | 11 | 958 | 1.1 | |
| 3 copies | 0 | 148 | 0.0 | |
| 4 copies | 0 | 83 | 0.0 | |
| Meso-thelioma (23 tumors) | 0 copies | 2 | 4 | 33.3 |
| 1 copy | 10 | 2657 | 0.4 | |
| 2 copies | 39 | 28 522 | 0.1 | |
| 3 copies | 1 | 1253 | 0.1 | |
| 4 copies | 0 | 11 | 0.0 |
All subsequent analyses were conducted in R (version 2.8.0, R Development Core Team, 2007) using the functions glm, gam (mgcv library), or elementary matrix operations. First, to determine if copy number influences total signal, we fit the following linear regression model:
where the notation ‘1(condition)’ indicates one when condition is true and zero when condition is false, γ2 is the mean square-root signal for two copies, and the square-root transformation was used as the variance-stabilizing transformation for a gamma variable, to ensure that Eij could have plausibly uniform variance with respect to i and j. Note that δ0 was not estimable for HNSCC. For mesothelioma, there were sufficient numbers of zero-copy SNPs to estimate δ0; while in theory, no signal should be detectable when no copies exist, we point out that the SNPs do not reside at the exact location of the CpGs, and there is a stochastic element both to the calling of copy number and the assessment of Mij + Uij. To account for correlation between loci on the same array, we used the bootstrap method of Parzen et al. (1994) to compute standard errors (1000 bootstraps each, assuming the 1413 values from array i are potentially correlated and thus contribute a single unit of independence to the estimating function). We conducted an omnibus test for variation in mean among different numbers of copies by simply constructing the Wald chi-squared test statistics for H0 : δ1=δ3=δ4=0 (for HNSCC) and H0 : δ0=δ1=δ3=δ4=0 (for mesothelioma). In other words, we tested for nonzero differences in mean signal between CpGs having normal copy number and CpGs having loss or gain. Results are shown in Table 2, while Figure 1 illustrates the relationships. Next, to determine how bias in measured methylation may vary with copy number, we fit the following linear regression model:
Again, we used the variance-stabilizing transformation for a beta-distributed variable, and used the method of Parzen et al. (1994) to compute standard errors. Tests for monotonic variation with copy number were conducted by constructing Wald chi-square test statistics for H0 : δ1=δ3=δ4−δ3=0 (HNSCC) and H0 : δ1 −δ0=δ1=δ3=δ4 −δ3=0 (mesothelioma). Results are shown in Table 3.
Table 2.
Regression coefficients describing the average CpG methylation signal (square root of Cy3+Cy5 intensity) as a function of copy number
| Parameter | Estimate | Std. Err. | Z-value | P-value | |
|---|---|---|---|---|---|
| HNSCC (18 tumors) | (Intercept) | 77.41 | 1.66 | 46.58 | 0.0000 |
| 0 copies | |||||
| 1 copy | -6.01 | 2.10 | −2.86 | 0.0043 | |
| 3 copies | 3.46 | 2.58 | 1.34 | 0.1794 | |
| 4 copies | 25.16 | 3.46 | 7.27 | 0.0000 | |
| Meso thelioma (23 tumors) | (Intercept) | 90.80 | 1.76 | 51.67 | 0.0000 |
| 0 copies | −43.50 | 1.76 | −24.76 | 0.0000 | |
| 1 copy | −10.22 | 1.88 | −5.43 | 0.0000 | |
| 3 copies | 4.36 | 2.18 | 2.00 | 0.0457 | |
| 4 copies | 14.67 | 2.97 | 4.94 | 0.0000 |
Fig. 1.

Boxplots depicting signal (y-axis) by copy number (x-axis) associations; white = HNSCC and gray = mesothelioma.
Table 3.
Regression coefficients describing the average difference between arcsine-square-root transformed methylation ‘average beta’,  and the arcsine-square-root transformed ratio of methylation signal intensities, R, as a function of copy number
| Parameter | Estimate | Std. Err. | Z-value | P-value | |
|---|---|---|---|---|---|
| (Intercept) | −0.0089 | 0.0004 | −24.71 | 0.0000 | |
| HNSCC (18 tumors) | 0 copies | ||||
| 1 copy | 0.0000 | 0.0008 | −0.06 | 0.9552 | |
| 3 copies | 0.0003 | 0.0005 | 0.68 | 0.4945 | |
| 4 copies | 0.0002 | 0.0006 | 0.37 | 0.7094 | |
| (Intercept) | −0.0077 | 0.0004 | −1.70 | 0.0000 | |
| Meso-thelioma (23 tumors) | 0 copies | −0.0015 | 0.0004 | −4.17 | 0.0000 |
| 1 copy | −0.0005 | 0.0004 | −1.23 | 0.2171 | |
| 3 copies | −0.0002 | 0.0007 | −0.23 | 0.8159 | |
| 4 copies | 0.0064 | 0.0006 | 10.48 | 0.0000 |
We used logistic regression to examine the relationship between small detection P-values and copy number:
Note that because of the small numbers of detection P-values above 0.05 (as shown in Table 1), we could not fit a stable model with categorical effects. We used the method of Parzen et al. (1994) to compute standard errors, with each bootstrap fit regularized by a small penalty to stabilize results. Results are shown in Table 4. Because of the bias mentioned earlier, we caution against over-interpretation of these results. Finally, we sought a systematic copy number effect in  across both types of tumors. It is difficult to separate effects of biology from assay, especially since copy number and methylation could be associated biologically, as both are mechanisms through which oncogenes can be activated and tumor suppressor genes inactivated coordinately (Cadieux et al., 2006; Jones and Baylin 2002); consequently, we attempted to isolate small copy number effects both by combining tumor types (thus diminishing biological effects) and by restricting the variation of methylation (thus diminishing biological associations of copy number with strong methylation signals). For incremental values of s between 0 and 0.25, we selected CpGs whose within-tumor-type standard deviation was smaller than s. That is, for each value of s, we selected sets J(s) of CpGs satisfying both
  and
and  . Note that for the HNSCC data set we excluded the array with weaker correlation between
  and Rij. For each standard deviation threshold s, we fit the following regression model using only CpGs j∈J(s):
 |
Again, we used the method of Parzen et al. (1994) to compute standard errors. Figure 2 illustrates the variation in coefficients δk(s) as a function of threshold s.
Table 4.
Logistic regression analyzing the probability of a low (<0.05) detection P-value as a function of copy number
| Parameter | Estimate | Std. Err. | Z-value | P-value | |
|---|---|---|---|---|---|
| HNSCC (18 tumors) | (Intercept) | 5.18 | 0.32 | 16.15 | 0.0000 |
| Copies−2 | 0.56 | 0.28 | 2.01 | 0.0440 | |
| Mesothelioma (23 tumors) | (Intercept) | 6.60 | 0.14 | 47.89 | 0.0000 |
| Copies−2 | 1.30 | 0.57 | 2.28 | 0.0228 |
Fig. 2.
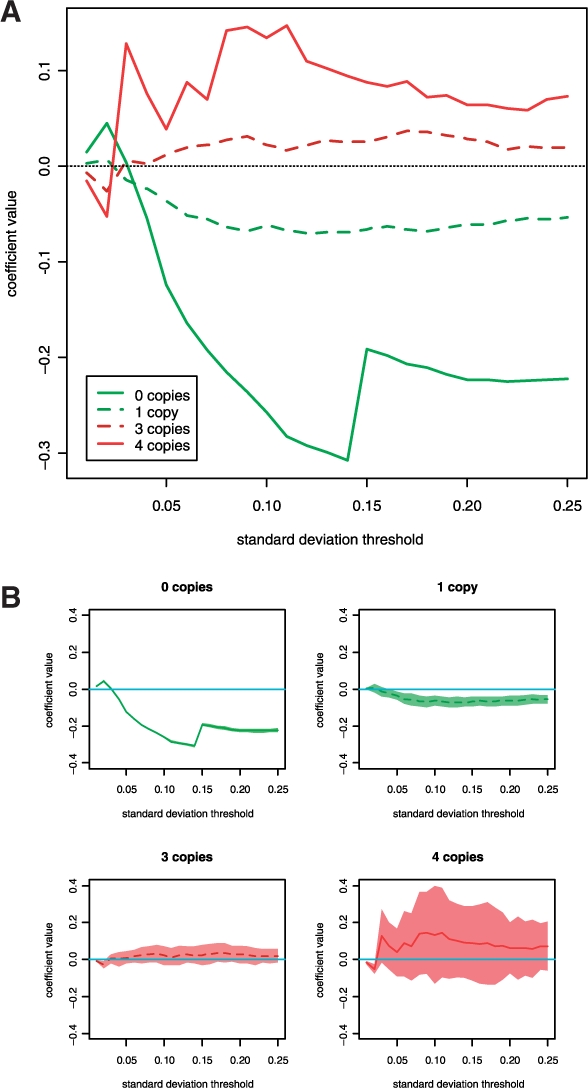
Systematic effect of copy number on methylation at CpG sites for which overall variation in methylation is small. (A) The range of standard deviation thresholds is depicted on the x-axis and the value of the correlation coefficient for the regression of copy number on small methylation changes is depicted on the y-axis for the given copy number states. (B) The range of standard deviation thresholds is depicted on the x-axis and the value of the correlation coefficient and its point-wise 95% confidence band for the regression of copy number on small methylation changes is depicted on the y-axis for each copy number state.
3 RESULTS
As shown in Supplementary Figure 1, 18 of 19 HNSCC tumors and all 23 mesothelioma tumors had strong correlation between  and R (Spearman correlation > 0.99). As shown in Supplementary Figure 2, the distances between GoldenGate CpG and its nearest Affymetrix SNP were generally within 10 kb, although some were as far away as 200 kb. Figure 3 provides a detailed illustration of copy number and methylation along a single chromosome among mesothelioma tumors, showing that, in general, methylation at a CpG is not associated with copy number status at nearby SNPs. For example, loci associated with TNFRSF10D are differentially methylated among the tumors, yet the pattern is dissimilar from that of copy number alterations in the region. Data from other chromosomes and from HNSCC tumors show similar results (Supplementary Fig. 3). Table 1 shows copy number changes among the 1413 SNPs near to the CpG methylation sites cross-classified with the detection P-values provided by Illumina for the nearby CpG (Table 1). These P-values putatively assess the extent to which signal can be distinguished from noise. First, it is clear that the vast majority (89%) of SNPs had two copies, with about 4% of the SNPs having three copies and a much smaller proportion having zero, one or more than four copies. The probability of a large detection P-value (≥0.05) appears to decrease with increasing copy number. Table 2 reports regression coefficients describing the average signal (Cy3 + Cy5 intensity) as a function of copy number. Signal by copy number associations are also depicted in Figure 1. Evident in Table 2 and Figure 1 are statistically significant differences (P<0.0001) in average signal among different numbers of copies. In addition, the regression coefficients indicate that the mean signal increases monotonically with copy number.
Fig. 3.
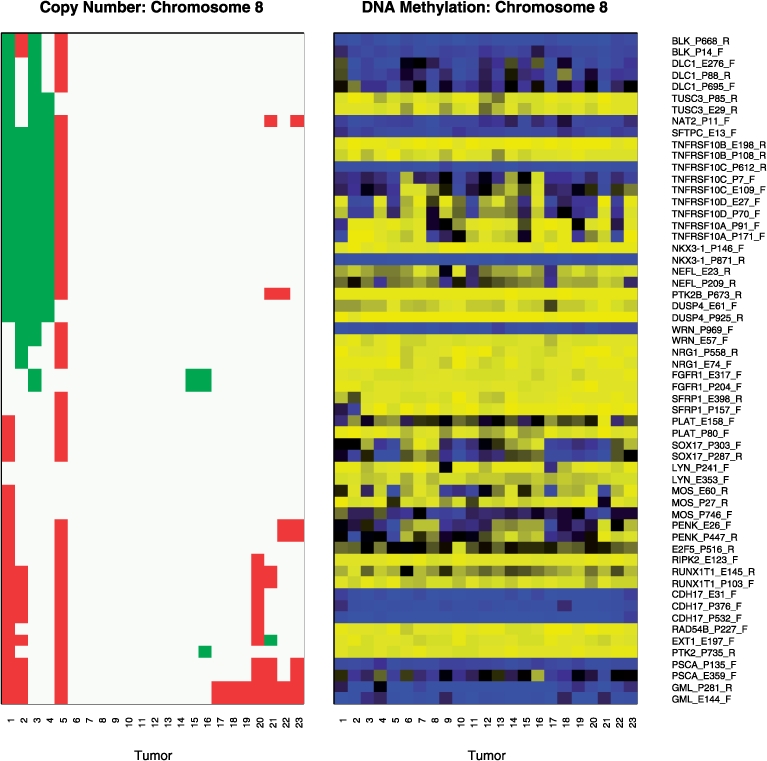
Copy number and methylation on Chromosome 8 among mesothelioma tumors. For copy number, green=loss, white=no change, red=gain. For methylation, yellow=unmethylated, blue=methylated. In both panels, the 23 tumors are ordered by their copy number profiles via hierarchical clustering.
The assay properties dictate that  should be, on average, slightly smaller than R. Table 3 reports regression coefficients describing the average difference between transformed values of
  and R as a function of copy number. Evident in the table is the anticipated negative intercept, whose difference from zero is statistically significant in both groups of tumors considered. This is also somewhat evident in Supplementary Figure 1, as the mass of the scatter plot lies above the black line indicating identity. For HNSCC there was no significant trend in differences among copy number (P=0.86). However, for mesothelioma there was significant trend (P<0.0001), with the differences between
  and R more pronounced for zero copies (i.e. a significantly negative coefficient) and less pronounced for four copies (i.e. a significant positive coefficient). This gradient is consistent with what we would anticipate from consideration of the statistical properties of the assay. The difference in result between HNSCC and mesothelioma may be explained by differences in sample size (n=18 versus n=23), and the fact that there were more copy number variants among the mesotheliomas. From the assay properties, we would anticipate that methylation signals would be easier to detect with increasing copy number; this is evident in Table 4, which reports results of logistic regression analyzing the probability of a low (<0.05) detection P-value as a function of copy number. Thus, observational data confirm the anticipated behavior of the assay.
Figure 2 shows the systematic effect of copy number on methylation at CpGs for which overall variation in methylation is small. The x-axis shows a range of standard deviation thresholds; for each such threshold, CpGs at which methylation varied less than the threshold in both tumor types were used in a regression analysis to determine the association of copy number on small methylation changes. The filtering was necessary to avoid associations with clear biological methylation signals, i.e. CpGs for which the association between copy number and methylation is likely to be confounded by an underlying biological mechanism that correlates copy number changes with hyper- or hypo-methylation; if both copy number changes and aberrant methylation are associated with a global disregulation process, then copy number changes will be associated with large changes in  . Figure 2a shows regression coefficients for zero, one, three and four copies (i.e. systematic methylation differences from two copies), as a function of threshold. Figure 2b shows each coefficient individually with its point-wise confidence band. For all but the smallest thresholds there is a clear gradient, with larger numbers of copies having systematically larger measured methylation values. This result is consistent with an anticipated property of the assay, that a greater number of copies leads to less negative bias. However, as Figure 2b shows, differences at three and four copies were insignificant. Zero copies and one copy led to significant systematic negative differences, although for one copy the difference was small; the results indicate that methylation assayed at or near loci that are wholly lost may have large negative bias.
4 DISCUSSION
There is an increasing interest in the integration of genome-scale data detailing various somatic alterations from disparate platforms in common human cancers, both to provide insight into the carcinogenic process as well as to identify novel pathways and therapeutic targets. There is also recognition that there may be significant complications to the analysis and interpretation of these integrated datasets. This can be particularly important when considering changes in allelic copy number, as the physical number of alleles at any given locus may also effect the detection and analysis of other alterations within that allelic region, including epigenetic alterations. Thus, we have demonstrated that there is little apparent bias induced by increased amplification of signal resulting from additional copies, but that fewer than two copies does result in a negative effect. This negative effect is expected, as loss of the region of interrogation should result in loss of ability to detect methylation of this region. As suggested in the ‘Materials and methods’ section, the mathematical form of the definition of Illumina's reported average beta  may induce small biases in the measured value of methylation, with the magnitude of the bias stronger when there are fewer copies. This is in part due to the normalizing constant in the denominator of the ratios defining the quantity, which will be influenced by changes in signal intensity. On the other hand, a similar measure of methylation, R, constructed from the ratio of dye intensities and defined below, should have no bias, since the signal intensities are (in theory) wholly averaged out. Because observational data are consistent with the behavior we predict from purely mathematical considerations, we have little reason to suspect that our understanding of the statistical properties is incorrect, subject of course to the absence of biases in binding affinities due to polymorphisms in the probe targets, which may affect methylation values at specific CpGs. Because the mathematics predicts only small bias in
  and no bias in R, we are reasonably confident that large biases do not exist when genetic material exists to be assayed. Note, however, that R is (according to theoretical principles) more variable than
  , so that even though R should have smaller magnitude bias relative to
  , its mean-square-error (MSE) may in fact be as large or larger. From observational data alone it is impossible to determine which measure has smaller MSE, since the true methylation status cannot be known with certainty.
Our confidence in the absence of bias on methylation signal for more than two copies is moderated by the additional analysis of systematic effects for CpGs with small variation in methylation (Fig. 2): for three copies and for the amplification state (four or more copies), there appears to be little or no significant systematic variation of copy number with methylation (measured by  . However, for 1 copy we detected a small but significant negative effect, and for zero copies we detected a significant and strong systematic negative effect; this indicates that there may be some negative bias when a single copy at or near the target CpG is lost, and substantial negative bias when genetic material is wholly lost at or near the target CpG.
From a cancer biology perspective, increasing copy number may not correspond to monotonic increases in methylation. At oncogene loci within amplified regions, selective pressure may drive expansion of clones with increased copy number and increased expression; this selective pressure would, in theory, negatively select for methylation in order to preserve oncogene expression, though passenger oncogenes (not driving selection) in the same amplicon may not have aberrant expression or methylation states. Hence, distinguishing between oncogenes that drive selection and those that may be passengers within an amplified region should be possible. However, it is impossible to test such a hypothesis in the presence of doubt about artifactual variation in methylation due to copy number influences. Our analysis suggests that such doubt may be safely discounted.
Thus, these results validate the utility of integration of these platforms, specifically the Affymetrix SNP array for copy number determination, and the Illumina BeadArray systems for DNA methylation analysis. As we have now demonstrated that there is little significant bias in the determination of the average beta of DNA methylation at specific loci, it is possible to undertake larger scale examinations of these alterations in such an integrated fashion. Utilizing our recursive portioning mixture model (RPMM) procedure (Houseman et al., 2008), we can also incorporate data on the clinical and epidemiologic correlates collected on these subjects in order to model the carcinogenic processes responsible for these somatic alterations, the inter-relationship between these somatic alterations, and the clinical utility of these alterations as diagnostic and prognostic markers. In addition, our results underline the importance of careful analytic strategies and validation of these strategies in order to most appropriately model the relationship of these various molecular features in order to avoid misinterpretation.
Supplementary Material
ACKNOWLEDGEMENTS
We acknowledge participation by Ru-Fang Yeh (Genentech).
Funding: National Institutes of Health (R01CA078609, R01CA100679, R01CA121147, R01CA126939); Mesothelioma Applied Research Foundation; the Tendrich/Berkow Fund; Friends of the Dana-Farber Cancer Institute; and Flight Attendants Medical Research Institute.
Conflict of Interest: none declared.
REFERENCES
- Bibikova M, et al. High-throughput DNA methylation profiling using universal bead arrays. Genome Res. 2006;16:383–393. doi: 10.1101/gr.4410706. [DOI] [PMC free article] [PubMed] [Google Scholar]
- Bignell GR, et al. High-resolution analysis of DNA copy number using oligonucleotide microarrays. Genome Res. 2004;14:287–295. doi: 10.1101/gr.2012304. [DOI] [PMC free article] [PubMed] [Google Scholar]
- Cadieux B, et al. Genome-wide hypomethylation in human glioblastomas associated with specific copy number alteration, methylenetetrahydrofolate reductase allele status, and increased proliferation. Cancer Res. 2006;66:8469–8476. doi: 10.1158/0008-5472.CAN-06-1547. [DOI] [PubMed] [Google Scholar]
- Christensen BC, et al. Asbestos burden predicts survival in pleural mesothelioma. Environ. Health Perspect. 2008;116:723–726. doi: 10.1289/ehp.11151. [DOI] [PMC free article] [PubMed] [Google Scholar]
- Hanauer DA, et al. Bioinformatics approaches in the study of cancer. Curr. Mol. Med. 2007;7:133–141. doi: 10.2174/156652407779940431. [DOI] [PubMed] [Google Scholar]
- Houseman EA, et al. Model-based clustering of DNA methylation array data: a recursive-partitioning algorithm for high-dimensional data arising as a mixture of beta distributions. BMC Bioinform. 2008;9:365. doi: 10.1186/1471-2105-9-365. [DOI] [PMC free article] [PubMed] [Google Scholar]
- Hsiung D, et al. Global DNA methylation level in whole blood as a biomarker in head and neck squamous cell carcinoma. Cancer Epidemiol. Biomarkers Prev. 2007;16:108–114. doi: 10.1158/1055-9965.EPI-06-0636. [DOI] [PubMed] [Google Scholar]
- Huang J, et al. Whole genome DNA copy number changes identified by high density oligonucleotide arrays. Human Genom. 2004;1:287–299. doi: 10.1186/1479-7364-1-4-287. [DOI] [PMC free article] [PubMed] [Google Scholar]
- Illumina . BeadStudio User Guide. San Diego, CA: 2008. p. 106. [Google Scholar]
- Irizarry RA, et al. Comprehensive high-throughput arrays for relative methylation (CHARM) Genome Res. 2008;18:780–790. doi: 10.1101/gr.7301508. [DOI] [PMC free article] [PubMed] [Google Scholar]
- Jones PA, Baylin SB. The fundamental role of epigenetic events in cancer. Nature Rev. 2002;3:415–428. doi: 10.1038/nrg816. [DOI] [PubMed] [Google Scholar]
- Kakazu KK, et al. The Cancer Biomedical Informatics Grid (caBIG): pioneering an expansive network of information and tools for collaborative cancer research. Hawaii Med. J. 2004;63:273–275. [PubMed] [Google Scholar]
- Leary RJ, et al. Integrated analysis of homozygous deletions, focal amplifications, and sequence alterations in breast and colorectal cancers. Proc. Natl Acad. Sci. USA. 2008;105:16224–16229. doi: 10.1073/pnas.0808041105. [DOI] [PMC free article] [PubMed] [Google Scholar]
- Liu WM, et al. Algorithms for large-scale genotyping microarrays. Bioinformatics. 2003;19:2397–2403. doi: 10.1093/bioinformatics/btg332. [DOI] [PubMed] [Google Scholar]
- Liu W, et al. Comprehensive assessment of DNA copy number alterations in human prostate cancers using Affymetrix 100K SNP mapping array. Genes Chromosomes Cancer. 2006;45:1018–1032. doi: 10.1002/gcc.20369. [DOI] [PubMed] [Google Scholar]
- Marsit CJ, et al. Epigenetic inactivation of the SFRP genes is associated with drinking, smoking and HPV in head and neck squamous cell carcinoma. Int. J. Cancer. 2006;119:1761–1766. doi: 10.1002/ijc.22051. [DOI] [PubMed] [Google Scholar]
- Morozova O, Marra MA. Applications of next-generation sequencing technologies in functional genomics. Genomics. 2008;92:255–264. doi: 10.1016/j.ygeno.2008.07.001. [DOI] [PubMed] [Google Scholar]
- Ng A, et al. Resources for integrative systems biology: from data through databases to networks and dynamic system models. Briefings Bioinform. 2006;7:318–330. doi: 10.1093/bib/bbl036. [DOI] [PubMed] [Google Scholar]
- Parsons DW, et al. An integrated genomic analysis of human glioblastoma multiforme. Science. 2008;321:1807–1812. doi: 10.1126/science.1164382. [DOI] [PMC free article] [PubMed] [Google Scholar]
- Parzen MI, et al. A resampling method based on pivotal estimating functions. Biometrika. 1994;81:341–350. [Google Scholar]
- R Development Core Team. R: A Language and Environment for Statistical Computing. Vienna, Austria: R Foundation for Statistical Computing; 2007. [Google Scholar]
- Risch A, Plass C. Lung cancer epigenetics and genetics. Int. J. Cancer. 2008;123:1–7. doi: 10.1002/ijc.23605. [DOI] [PubMed] [Google Scholar]
- Shai RM. Microarray tools for deciphering complex diseases. Front. Biosci. 2006;11:1414–1424. doi: 10.2741/1892. [DOI] [PubMed] [Google Scholar]
- Sjoblom T, et al. The consensus coding sequences of human breast and colorectal cancers. Science. 2006;314:268–274. doi: 10.1126/science.1133427. [DOI] [PubMed] [Google Scholar]
- Sugarbaker DJ, et al. Transcriptome sequencing of malignant pleural mesothelioma tumors. Proc. Natl Acad. Sci. USA. 2008;105:3521–3526. doi: 10.1073/pnas.0712399105. [DOI] [PMC free article] [PubMed] [Google Scholar]
- Wood LD, et al. The genomic landscapes of human breast and colorectal cancers. Science. 2007;318:1108–1113. doi: 10.1126/science.1145720. [DOI] [PubMed] [Google Scholar]
- Zender L, Lowe SW. Integrative oncogenomic approaches for accelerated cancer-gene discovery. Curr. Opin. Oncol. 2008;20:72–76. doi: 10.1097/CCO.0b013e3282f31d5d. [DOI] [PMC free article] [PubMed] [Google Scholar]
Associated Data
This section collects any data citations, data availability statements, or supplementary materials included in this article.