

Abstract
Synaptotagmin-I (syt-I) is required for rapid neurotransmitter release in mouse hippocampal neurons. However, contradictory results have been reported regarding evoked and spontaneous secretion from syt-I knock-out (KO) neurons. Here, we compared synaptic transmission in two different hippocampal neuron preparations: autaptic cultures in which a single isolated cell innervates itself, and dissociated mass cultures in which individual cells are innervated by neighboring cells. In autaptic cultures, the total extent of evoked release, size of readily releasable pool of synaptic vesicles, and release probability were unchanged in syt-I KO neurons. In contrast, in cultures containing multiple interconnected neurons, total evoked release, the number of docked vesicles, and release probability, were significantly reduced in syt-I KO neurons. Using a micronetwork system in which we varied the number of cells on an island, we found that the frequency of spontaneous synaptic vesicle fusion events (minis) was unchanged in syt-I KO neurons when two or fewer cells were present on an island. However, in micronetworks composed of three or more neurons, mini frequency was increased threefold to fivefold in syt-I KO neurons compared with wild type. Moreover, interneuronal synapses exhibited higher rates of spontaneous release than autaptic synapses. This higher rate was attributable to an increase in release probability because excitatory hippocampal neurons in micronetworks formed a set number of synapses per cell regardless of the number of connected neurons. Thus, aspects of synaptic transmission differ between autaptic and dissociated cultures, and the synaptic transmission phenotype, resulting from loss of syt-I, is dictated by the connectivity of neurons.
Introduction
Neurons communicate via the Ca2+-triggered exocytosis of synaptic vesicles (Katz, 1969). The synaptic vesicle membrane protein, synaptotagmin-I (syt-I), binds Ca2+ and plays a critical role during secretion by interacting with soluble N-ethylmaleimide-sensitive factor attachment protein receptor (SNARE) proteins and phospholipids. Through these interactions, Ca2+ and syt-I drive the opening and dilation of fusion pores, and the expulsion of transmitters into synaptic cleft (Chapman, 2008).
Many types of neurons exhibit two components of evoked release induced by a single action potential: fast synchronous and slow asynchronous release (Goda and Stevens, 1994). Knock-out (KO) studies have established that syt-I is essential for fast synchronous release (Koh and Bellen, 2003), but the total amount of transmitter released in syt-I KOs is the subject of dispute: it was markedly reduced in mass cultures of syt-I KO cortical neurons (Maximov and Südhof, 2005) and in ensembles of syt-I KO hippocampal neurons grown on islands (Geppert et al., 1994), but was unaffected in autaptic cultures of syt-I KO hippocampal neurons (Nishiki and Augustine, 2004a,b). Moreover, although the fast synchronous component was abolished at the Drosophila neuromuscular junction in syt-I-null mutants, a slow asynchronous release appeared (Yoshihara and Littleton, 2002).
In addition to playing a stimulatory role in Ca2+-triggered exocytosis, numerous studies of the Drosophila neuromuscular junction of syt-I mutants indicate that syt-I inhibits spontaneous synaptic vesicle release (Broadie et al., 1994; DiAntonio and Schwarz, 1994; Littleton et al., 1994). In agreement with these studies, the frequency of both miniature EPSCs and IPSCs in mass cultures of syt-I KO hippocampal and cortical neurons was increased approximately fivefold (Pang et al., 2006; Chicka et al., 2008). The mechanism by which syt-I clamps SNARE-mediated liposome fusion was recently described: before the Ca2+ trigger, apo-syt-I (syt-I without bound Ca2+) arrested SNARE proteins at a step after trans-SNARE pairs have begun to assemble (Chicka et al., 2008). However, a clamping function for syt-I was not observed in autaptic cultures of syt-I KO hippocampal neurons (Geppert et al., 1994).
The role of syt-I in synaptic vesicle docking also remains unclear. Analysis of Drosophila syt-I mutants revealed a decrease in the number of docked vesicles in accordance with a decrease in evoked release (Reist et al., 1998), but in syt-I KO mice, the total number of synaptic vesicles and the number of docked vesicles were unchanged in a qualitative study (Geppert et al., 1994). A quantitative study of synaptic morphology in syt-I KOs has not been performed.
Autaptic cultures are commonly used to study synaptic transmission (Bekkers and Stevens, 1991). But this culture method excludes communications between neurons. Differences in synaptic transmission between autaptic cultures and mass cultures of neurons remain to be explored.
Here, we test the hypothesis that different neuronal preparations, autapses versus dissociated mass cultures, give rise to different properties of synaptic vesicle release in syt-I KO neurons. Using a micronetwork system in which we vary the number of neurons grown on a microisland, we conclude that the connectivity of neurons underlies the distinct phenotypes of synaptic transmission observed in syt-I KO hippocampal neurons.
Materials and Methods
Cell culture.
Hippocampi of newborn pups (postnatal day 0) from heterozygous syt-I KO mouse matings were isolated as described previously (Gitler et al., 2004) in accordance with the guidelines of the National Institutes of Health, as approved by the Animal Care and Use Committee of the University of Wisconsin–Madison. Tails were kept for genotyping, and electrophysiological recordings from syt-I KO and wild-type (WT) littermate neuron cultures were compared. For dissociated cultures, neurons were plated at 25,000–50,000 cells/cm2 on 12 mm coverslips in Neurobasal medium supplemented with B27 and glutamax (Invitrogen). For autaptic cultures, hippocampal neurons were prepared as described previously (Bekkers and Stevens, 1991; Feng et al., 2002). Micronetwork cultures were generated as described previously for autaptic cultures.
Electrophysiology.
Whole-cell patch-clamp recordings were made from dissociated hippocampal cultures as well as from microisland cultures in which the number of neurons per microisland were varied. All recordings were done 12–17 d after neurons were plated on coverslips. The pipette solution consisted of 130 mm K-gluconate, 1 mm EGTA, 5 mm Na-phosphocreatine, 2 mm Mg-ATP, 0.3 mm Na-GTP, and 10 mm HEPES, pH 7.3 (290 mOsm). For evoked recordings in dissociated cultures, 5 mm QX-314 (lidocaine N-ethyl bromide) was added to the pipette solution. Neurons were continuously perfused with extracellular solution consisting of 140 mm NaCl, 5 mm KCl, 1 mm MgCl2, 10 mm glucose, 10 mm HEPES, pH 7.3 (300 mOsm), 50 μm d-2-amino-5-phosphonopentanoate (d-AP5), 0.1 mm picrotoxin, and 10 mm Ca2+ or 2 mm Ca2+ (for supplemental Fig. S1, available at www.jneurosci.org as supplemental material). For recording miniature EPSCs (mEPSCs) in Ca2+-free conditions (for Fig. 4 B; supplemental Fig. S2, available at www.jneurosci.org as supplemental material), 10 mm EGTA replaced Ca2+, and 1 μm tetrodotoxin (TTX), 25 μm 1,2-bis(o-aminophenoxy)ethane-N,N,N′,N′-tetra-acetic acid acetoxymethyl ester (BAPTA-AM), and 30 μm cyclopazonic acid (CPA) were added to the bath solution. Cultures were incubated in bath solution for 30 min before recording to allow BAPTA-AM and CPA to exert their effects. We increased extracellular KCl concentration by 5 mm for 4 d before electrophysiological recording in supplemental Figure S2 (available at www.jneurosci.org as supplemental material). Picrotoxin was dissolved in ethanol, d-AP5 was dissolved in NaOH, and BAPTA-AM and CPA were dissolved in DMSO. All drugs were from Sigma-Aldrich. The stimulating bipolar electrode used in paired recordings was filled with extracellular solution. Neurons were voltage clamped at −70 mV with an EPC-10/2 amplifier (HEKA). Only cells with series resistances of <15 MΩ, with 70–80% of this resistance compensated, were analyzed. Currents were acquired using PATCHMASTER software (HEKA), filtered at 2.9 kHz, and digitized at 10 kHz. Data were analyzed using MiniAnalysis software (Synaptosoft), Clampfit (Molecular Devices), and Igor (Wavemetrics). All experiments were performed at room temperature. We note that ∼10% of cells failed to yield EPSCs; these are probably inhibitory neurons that fail to yield any synaptic currents because of the presence of picrotoxin.
Figure 4.

Analysis of synaptic vesicle recycling using FM1-43 in syt-I KO autaptic and dissociated cultures. A, Experimental scheme for uptake and destaining of FM1-43 from autaptic and dissociated cultures. Synaptic vesicles were loaded with FM1-43 for 2 min using high [K+]. Images were acquired at 1 s intervals between the time points indicated by arrows. B–D, Measurement of FM1-43 destaining in autaptic cultures. B, Normalized rate of FM1-43 destaining of syt-I KO (n = 51; 5 different coverslips) versus WT neurons (n = 50; 5 different coverslips). C, Normalized recycling vesicle pool size calculated from the total FM1-43 destain is unchanged in syt-I KO compared with WT neurons (WT, 100 ± 8.50%; KO, 85.70 ± 5.77%). D, The rate of FM1-43 destaining, calculated from single-exponential fits to the data in B, is similar between syt-I KO and WT neurons (WT, 5.81 ± 0.50 ms; KO, 6.93 ± 0.60 ms). E–G, Measurement of FM1-43 destaining in dissociated cultures. E, Normalized rate of FM1-43 destaining of syt-I KO (n = 80; 6 different coverslips) versus WT neurons (n = 80; 4 different coverslips). F, Normalized recycling vesicle pool size calculated by FM1-43 destain magnitude is significantly reduced in syt-I KO neurons compared with WT neurons (WT, 100 ± 4.69%; KO, 63.10 ± 3.03%). G, The rate of FM1-43 destaining, calculated from single-exponential fitting of the data in E, is significantly slower in syt-I KO neurons compared with WT neurons (WT, 11.56 ± 0.37 ms; KO, 17.41 ± 0.64 ms). The asterisks indicate statistically significant differences: ***p < 0.001. All data shown represent means ± SEM.
Readily releasable pool (RRP) size determination in autaptic cultures was made by adding 500 mm sucrose to the extracellular solution as described previously (Rosenmund et al., 1995). In dissociated cultures, we puffed sucrose to cover the entire area viewed under a 40× objective lens, which includes virtually all presynaptic boutons contacting the patched cells. The sucrose was applied for 8 s so that we could acquire the steady-state response, indicating replenishment of the RRP. Sucrose responses were integrated for the fast response to calculate the RRP size.
To measure release probability using high-frequency action potential trains, we used low extracellular Ca2+ concentration (2 mm) to eliminate recurrent activity in the whole network in dissociated cultures.
All data are presented as the mean ± SEM. The p values were calculated using Student's t test and presented as follows: *p < 0.05, **p < 0.01, and ***p < 0.001.
FM1-43 experiments.
Hippocampal neurons in autaptic and dissociated cultures were loaded with FM1-43 (10 μm; Invitrogen) in 45 mm KCl depolarizing buffer (100 mm NaCl, 45 mm KCl, 2 mm CaCl2, 2 mm MgCl2, 5.5 mm glucose, 20 mm HEPES, pH 7.3) for 2 min. Coverslips were then washed with low K+ buffer (140 mm NaCl, 5 mm KCl, 2 mm CaCl2, 2 mm MgCl2, 5.5 mm glucose, 20 mm HEPES, pH 7.3) for 5 min to remove excess dye. Images were acquired with a Cascade II EMCCD camera (Roper Scientific Photometric) on a Nikon TE300 inverted microscope. Images were collected with 200 ms exposures at 1 s intervals during dye destaining. A baseline was collected for 10 images before addition of depolarizing buffer to destain boutons. Dye-labeled boutons were selected as regions of interest in MetaMorph (Improvision), and fluorescence intensity was plotted versus time. Destaining traces were normalized by setting maximal load to 1 and complete destaining (disappearance of bouton to background levels) to zero for comparison of rates. Recycling vesicle pool size was calculated from the total fluorescence loss from boutons during destaining.
Counting glutamatergic synapse number in micronetworks.
We immunostained cultures using a polyclonal guinea pig anti-VGluT1 (vesicular glutamate transporter) antibody (Millipore Bioscience Research Reagents) to mark excitatory presynaptic terminals. Twelve to 14 d in vitro (DIV), neurons were fixed with 4% paraformaldehyde in PBS, permeabilized, and blocked in 10% goat serum plus 0.1% Triton X-100, and immunostained with primary antibodies for 2 h and with secondary antibody, Cy2-tagged anti-guinea pig (Jackson ImmunoResearch Laboratories), for 30 min at room temperature. Coverslips were then mounted in Fluoromount (Southern Biotechnology Associates). Images of immunostained neurons were acquired on an Olympus FV1000 upright confocal microscope with a 60× 1.10 numerical aperture water-immersion lens. For quantitation between conditions, images were acquired with identical laser and gain settings and imported into MetaMorph. The number of synapses was calculated using MetaMorph software, with thresholds such that all recognizable synaptic puncta were selected.
Electron microscopy/high-pressure freezing.
Electron microscopy grids were prepared by floating a thin layer of Formvar on water, and then laying grids on the Formvar and retrieving them with a 12 mm coverslip (five grids per coverslip). The grids were then treated with a plasma glow discharge to make them hydrophilic and coated with poly-lysine. Grids on coverslips were sterilized for 30 min under UV light, and hippocampal neurons were plated at a density of 50,000–100,000 cells/cm2. Twelve to 15 DIV neurons were frozen using a BAL-TEC PM-010 high-pressure freezer (Technotrade International). Samples were then freeze-substituted over a period of 5 d, slowly removing the water and infusing glutaraldehyde and osmium tetroxide. After freeze substitution, samples were embedded in Epon-Araldite and examined under a dissection microscope. Approximately 300 μm square areas containing cells were randomly selected, cut out, sectioned at 250 nm thickness, and stained using uranyl acetate and lead citrate. These sections were then examined under low magnification (1000×) and areas of interest that contain synapses were imaged using a Tecnai F20 microscope (FEI) operated at 200 keV and a Gatan 2k × 2k CCD camera. A series of 120 tilted images, starting at −60°, were collected at 35,000× magnification every 1° until +60°, and then the sample was rotated 90° and the process was repeated. Tomographic reconstructions were produced from the acquired tilt series of images using the IMOD software package (Kremer et al., 1996) to generate a reconstruction with a resolution of ∼4–5 nm. Reconstructions were then rendered and contoured to give final three-dimensional representation. For reconstructions containing synapses, the total number of vesicles and docked vesicles (vesicles touching the presynaptic membrane in the reconstruction) were counted.
Results
Differences in evoked release in autapses versus dissociated mass cultures of mouse hippocampal neurons
In the first series of experiments, we compared evoked release in the two preparations: autapses and mass cultures of dissociated neurons (hereafter referred to as dissociated cultures). In autaptic cultures (Fig. 1 A), action potentials were induced by depolarization from −70 to +40 mV for 1 ms using an intracellular patch pipette and excitatory postsynaptic responses were recorded. In dissociated cultures, a stimulating bipolar electrode (Fig. 1 F, left) touches the soma and triggers an action potential by pulses of minus 20 V for 1 ms. This action potential induces synaptic vesicle release, which is recorded as a postsynaptic response by an electrode in the connected neuron (Fig. 1 F, right). In dissociated cultures, to exclude contaminating current caused by transmitter release from other neurons activated by the stimulated neuron, we chose only EPSCs with a single peak amplitude response, and smooth decay kinetics, for analysis of WT neurons. Although we cannot exclude contaminating current in syt-I KO neurons, because of their characteristic slow and long-lasting asynchronous release properties, we only analyzed EPSCs with a single relatively large response followed by ongoing smaller responses within a 1 s time window (Fig. 1 G, see representative KO) to minimize the contribution of contaminating currents.
Figure 1.

The extent of evoked release in syt-I KOs is normal in autapses but reduced in dissociated cultures of hippocampal neurons. A–E, Recordings from autaptic cultures. A, An autaptic culture depicting the recording scheme (red, synapsin; green, MAP2). B, Evoked EPSCs from WT (black line) and syt-I KO (red line) neurons. The inset shows full current scale of WT neurons. C, Average cumulative evoked EPSC charges for WT (n = 32) and syt-I KO (n = 38) neurons. D, Total EPSC charge in WT (48.05 ± 9.2 pC) and syt-I KO (43.96 ± 5.12 pC) neurons. E, Normalized cumulative total charge averaged and fitted by a double-exponential function (solid line). F–J, Recordings from dissociated cultures. F, Recording scheme used for dissociated cultures (red, synapsin; green, MAP2). G, Evoked EPSCs from WT (black line) and syt-I KO (red line) dissociated cultures. The inset shows full current scale of WT neurons. H, Average cumulative evoked EPSC charges for WT (n = 17) and syt-I KO (n = 12) neurons. I, Total EPSC charge in WT (55.4 ± 8.26 pC) and syt-I KO (33.3 ± 4.78 pC) neurons. J, Normalized total charge averaged and fitted by a double-exponential function (solid line). K, Kinetics of evoked responses from WT and syt-I KO neurons determined by fitting individual normalized total charge traces. The asterisks indicate statistically significant differences for syt-I KO versus WT: *p < 0.05. All data shown represent means ± SEM.
We found that the fast synchronous component of synaptic transmission was markedly reduced, but long-lasting slow asynchronous release persisted, in syt-I KO neurons in both culture preparations [autaptic culture (Fig. 1 B); dissociated culture (Fig. 1 G)]. Evoked EPSCs were integrated over the total time in which responses were detected to determine the cumulative charge, which provides an estimate of the total number of vesicles released. We found that loss of syt-I had distinct effects on the total charge transfer in the two preparations. In autaptic cultures, the cumulative charge reached a plateau with integration times of ∼1 s (Fig. 1 C), and the total amount of release in syt-I KOs was the same as in WT neurons (Fig. 1 D). However, in dissociated cultures, integration of EPSCs over 1 s after the stimulus revealed a significant reduction in the total cumulative charge in syt-I KO neurons compared with WT neurons (Fig. 1 H,I).
Fitting the cumulative evoked release plot with a double-exponential function revealed two components of release in syt-I KO and WT neurons in both autaptic (Fig. 1 E) and dissociated cultures (Fig. 1 J), as previously reported (Geppert et al., 1994; Shin et al., 2003; Nishiki and Augustine, 2004a,b). In WT neurons, the relative contributions of fast (85–88%) and slow (12–15%) release were the same in autaptic and dissociated cultures (Fig. 1 K). However, in syt-I KO autapses, we observed equal amounts of “fast” (49%) and slow (51%) release, but these proportions differed in dissociated cultures of syt-I KO neurons with release dominated by the slow component (78%); only low levels of fast transmission (22%) were observed. These data, along with the time constants of release under each condition, are shown in Figure 1 K. In dissociated cultures, the time constant of fast release in syt-I KOs was ∼1.8-fold slower than in WT neurons, whereas the time constant for slow release was unchanged. However, in autaptic cultures, the time constant for fast release in syt-I KOs was ∼10-fold slower than in WT neurons, whereas the time constant of slow release in syt-I KOs was ∼2.1-fold slower than in WT neurons (Fig. 1 K).
We noticed a similar charge transfer in WT neurons between dissociated cultures and autaptic cultures, but we did not directly compare the total charge released between the two kinds of cultures in our studies because different stimulation methods were used. For example, the extracellular stimulation (applied via a bipolar electrode) used in the dissociated cultures activates more synapses or drives a greater amount of vesicle release per synapse, compared with release that is triggered by intracellular depolarization via whole-cell patches.
Synaptic vesicle docking, and the readily releasable vesicle pool, in syt-I KO neurons
One hypothesis for the differences in the extent of release in autaptic versus dissociated syt-I KO cultures is that the RRP size and number of docked vesicles is somehow reduced in dissociated, but not autaptic, cultures. To investigate this, we used hypertonic sucrose solution to determine the RRP size, as described previously (Rosenmund and Stevens, 1996). Sucrose responses, in both syt-I KO and WT neurons, showed a fast component of release followed by a slower steady-state phase of secretion that might be attributable to replenishment of the RRP (Fig. 2 A,C). The integrated charge of the fast component corresponds to the size of the RRP. We found that, in autaptic cultures, the RRP size was the same in syt-I KO and WT synapses (Fig. 2 B), but in dissociated cultures, the RRP size in syt-I KO synapses was reduced ∼2.7-fold compared with WT synapses (Fig. 2 D).
Figure 2.

The RRP size in syt-I KOs is unchanged in autaptic cultures but reduced in dissociated cultures of hippocampal neurons. A, Representative sucrose responses from autaptic cultures of WT and syt-I KO neurons. B, Total charge transfer from autaptic cultures was the same between WT (463.65 ± 106 pC; n = 16) and syt-I KO (474.95 ± 77 pC; n = 13) neurons. C, Representative sucrose responses from dissociated cultures of WT and syt-I KO neurons. D, Total charge transfer from dissociated cultures was reduced in syt-I KO (214.84 ± 29 pC; n = 12) compared with WT (577.77 ± 40 pC; n = 12) neurons. The asterisks indicate statistically significant differences for syt-I KO versus WT: ***p < 0.001. All data shown represent means ± SEM.
RRP size is thought to correlate with the number of docked vesicles in presynaptic boutons (Murthy et al., 2001). We therefore examined the ultrastructure of synapses in dissociated cultures using EM tomography. We used the high-pressure freezing method, which results in better preservation of synaptic structure than conventional chemical fixation (Sawaguchi et al., 2002; Rostaing et al., 2006). EM tomography revealed a dramatic decrease in the number of synaptic vesicles in syt-I KO terminals (Fig. 3 C,D) compared with WT terminals (Fig. 3 A,B). The total number of vesicles was reduced twofold (Fig. 3 E), and the number of docked vesicles was decreased threefold (Fig. 3 F) in syt-I KOs. These results differ from a previous qualitative ultrastructure analysis, which found no difference between syt-I KO and WT synapses (Geppert et al., 1994). Our finding in dissociated cultures, together with similar findings in the syt-I-null neuromuscular junction of Drosophila (Reist et al., 1998), suggests a general role of syt-I in synaptic vesicle docking.
Figure 3.
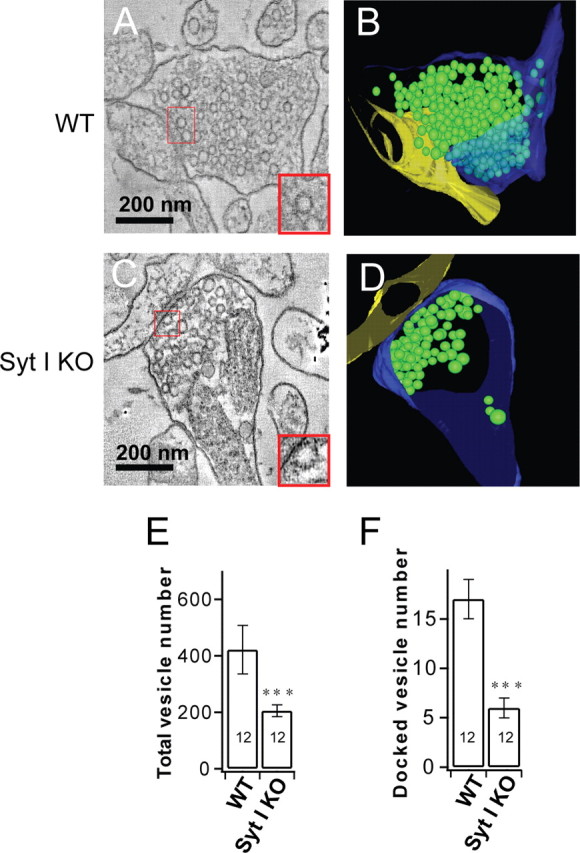
Loss of syt-I results in reduced numbers of total and docked synaptic vesicles in dissociated cultures of hippocampal neurons. A, Representative electron micrograph of a WT synapse. The inset shows docked vesicles. B, Tomographic reconstruction of the synapse shown in A. C, Representative electron micrograph of a syt-I KO synapse. The inset shows docked vesicles. D, Tomographic reconstruction of the synapse shown in C. E, Plot of the number of vesicles per terminal (n = 12 tomograms) in WT (421 ± 86) and syt-I KO (205 ± 21) neurons. F, Plot of the number of docked vesicles per terminal (n = 12 tomograms) in WT (17 ± 2) and syt-I KO (6 ± 1) neurons. The asterisks indicate statistically significant differences for syt-I KO versus WT: ***p < 0.001. All data shown represent means ± SEM.
The reduction in the number of synaptic vesicles could be attributable to defects in endocytosis in syt-I KO neurons (Poskanzer et al., 2003; Nicholson-Tomishima and Ryan, 2004) and/or the high rate of spontaneous release in syt-I KO neurons (Reist et al., 1998). The reduction in the number of docked synaptic vesicles as observed by EM tomography, in conjunction with the reduced sucrose response in syt-I KO neurons determined electrophysiologically, underscore the correlation between RRP size and the number of docked vesicles (Murthy et al., 2001).
We did not generate tomograms of presynaptic boutons in autaptic cultures because there are only approximately two autapses per grid used for EM tomography, and the probability of finding enough autapses for analysis is low. Moreover, the agarose that is used to support microislands is destroyed after high-pressure freezing, fragmenting the islands and destroying the morphology of the neurons. Instead, we relied on sucrose responses recorded from autaptic cultures as a means of measuring the docked vesicle pool (Fig. 2 A,B).
In summary, the decrease in the number of docked vesicles in syt-I KOs provides an explanation for the observed reduction in evoked release in syt-I KO neurons. Likewise, in autaptic cultures, the same RRP size in syt-I KO and WT synapses is in accordance with the same total amount of evoked release in syt-I KO and WT synapses in this type of culture.
Recycling vesicle pool size is unchanged in syt-I KO autaptic cultures but is reduced in dissociated cultures compared with WT neurons
We also used FM1-43 to directly measure synaptic vesicle recycling in the two different culture conditions (Fig. 4 A). We found that, in single synaptic terminals, the recycling vesicle pool size was unaltered in syt-I KO autaptic cultures (Fig. 4 C) but was reduced in syt-I KO dissociated cultures (∼60%) (Fig. 4 F) compared with WT neurons. A single-exponential function was used to fit normalized destaining traces (Fig. 4 B,E) to calculate destaining rates. In dissociated cultures, destaining of syt-I KO boutons was significantly slower compared with WT (Fig. 4 G). In contrast, there was no significant difference between syt-I KO and WT autapses. (Fig. 4 D). We note that, in WT neurons, destaining in autaptic cultures was significantly faster compared with dissociated cultures. Autaptic cultures may operate at a “maximal rate” of synaptic vesicle release, such that additional increases in destaining rate cannot occur. Our results using dissociated cultures are consistent with a previous study (Nicholson-Tomishima and Ryan, 2004), but differ from those of Nishiki and Augustine (2004a), who reported no change in the recycling vesicle pool size. This probably results from the different loading protocols used in these studies. When we reduced the loading time to 1 min, as in the study by Nishiki and Augustine (2004a), we found that the recycling vesicle pool size was the same between syt-I KO and WT neurons (data not shown).
These FM dye experiments suggest that the reduction in recycling vesicle pool size may contribute to the reduction of transmitter release observed in syt-I KO neurons in dissociated culture.
Release probability in autapses versus dissociated cultures of syt-I KO neurons
The hypertonic sucrose and FM dye uptake experiments described above revealed different RRP phenotypes in autapses versus dissociated cultures of syt-I KO neurons. These findings suggest that release probability is somehow reduced in dissociated, but not autaptic, cultures. Release probability is defined as the fraction of vesicles in the RRP that can be released by a single action potential. In dissociated cultures, to directly compare evoked release to the RRP size in synapses between two connected neurons, we applied high-frequency action potential trains (20 Hz/40 APs) to calculate the RRP size (Fig. 5 A) (Moulder and Mennerick, 2005; Stevens and Williams, 2007), after paired recordings of evoked release. This method was also used in autaptic cultures (Fig. 5 D) for comparison. A linear function was used to fit the cumulative EPSC area between the 30th and the 40th EPSCs to estimate the RRP size. The RRP was significantly reduced in syt-I KO neurons in dissociated cultures, but unchanged in autaptic cultures, compared with WT (y-intercepts) (Fig. 5 B,E). These data are consistent with the conclusion about RRP estimated by sucrose (Fig. 2). We found that, in dissociated cultures, the release probability was significantly reduced in syt-I KO neurons compared with WT neurons (Fig. 5 C). However, in autaptic cultures, the release probability was similar between syt-I KO and WT neurons (Fig. 5 F). Thus, alterated release probability between autaptic and dissociated cultures might contribute to different extents of evoked responses observed in syt-I KO neurons.
Figure 5.

Loss of syt-I reduces the release probability in dissociated, but not autaptic, hippocampal cultures. A–C, Recordings from dissociated cultures. A, Representative EPSCs trains (40 stimuli; 20 Hz) recorded from syt-I KO and WT neurons. Presynaptic stimulus transients have been removed for clarity. B, Plot of average cumulative EPSCs area from each neuron versus stimulus number. The dashed line represents a linear function (inset) fit to data points between the 30th to the 40th EPSCs to estimate the RRP size (y-intercepts). C, Release probability, calculated by single evoked EPSC charge divided by the RRP size from the paired measurement on the same cell, was significantly reduced in syt-I KO neurons compared with WT (WT, 0.25 ± 0.04, n = 10; KO, 0.15 ± 0.02, n = 10). D–F, Recordings from autaptic cultures. D, Representative EPSCs trains (40 stimuli; 20 Hz) recorded from WT and syt-I KO neurons. E, Plot of average cumulative EPSC area from each neuron versus stimulus number. The dashed line represents a linear function (inset) fit to data points from the 30th to the 40th EPSCs to estimate the RRP size (y-intercepts). F, Release probability, calculated by single evoked EPSC charge divided by the RRP size from the paired measurement on the same cell, was similar between WT and syt-I KO neurons (WT, 0.21 ± 0.01, n = 9; KO, 0.18 ± 0.02, n = 8). Recordings of EPSCs trains were corrected for nonsynaptic artifacts by subtraction of a record obtained in the presence of CNQX (100 μm) to obtain accurate measurements of EPSC charge. The charges integrals include all synchronous and asynchronous release. The asterisks indicate statistically significant differences: *p < 0.05. All data shown represent means ± SEM.
Effect of neuronal connectivity and syt-I on the rate of spontaneous synaptic vesicle release
Another controversial issue concerns the putative clamping activity of syt-I; if apo-syt-I acts as a clamp, then mini frequency should be increased in syt-I KO neurons. To determine whether different effects on mini frequency reported previously in studies focused on hippocampal neurons (Geppert et al., 1994; Chicka et al., 2008) result from the use of distinct culture preparations, we developed a micronetwork assay in which we varied the number of neurons on a microisland. We then examined the frequency of mEPSCs in micronetworks with one to five neurons on a microisland (Fig. 6 A). Recordings were performed under Ca2+-free conditions as described previously (Chicka et al., 2008). First, we found that the frequency of spontaneous release events, in both syt-I KO and WT neurons, increased with increasing numbers of neurons on a microisland (Fig. 6 B); there was a steep sevenfold to eightfold increase in mini frequency in micronetworks of two neurons compared with one neuron. Second, when we compared minis in syt-I KO and WT neurons, we found that the frequency was the same in micronetworks of one neuron (autaptic culture) and two neurons. However, in micronetworks consisting of three or more neurons, the mini frequency in syt-I KOs was significantly increased, threefold to fivefold, compared with WT neurons (Fig. 6 B). The shape, amplitude, and quantal charge of mEPSCs were indistinguishable between syt-I KO and WT neurons for all conditions tested (data not shown).
Figure 6.

Analysis of mEPSC frequency and synapse number in micronetworks. A, Image of micronetworks consisting of one to five hippocampal neurons (white arrows). B, The frequency of mEPSCs was unchanged between WT and syt-I KO micronetworks of one neuron (WT, 0.29 ± 0.07 Hz, n = 8; syt-I KO, 0.47 ± 0.18 Hz, n = 9) or two neurons (WT, 1.85 ± 0.84 Hz, n = 7; syt-I KO, 2.89 ± 0.88 Hz, n = 11). mEPSC frequency was increased in syt-I KO neurons compared with WT in microislands of three (WT, 1.65 ± 0.53 Hz, n = 6; syt-I KO, 4.04 ± 1.25 Hz, n = 7; p = 0.025), four (WT, 3.9 ± 1.5 Hz, n = 9; syt-I KO, 9.08 ± 2.98 Hz, n = 10; p = 0.033), or five neurons (WT, 2.15 ± 0.56 Hz, n = 7; syt-I KO, 8.48 ± 3.64 Hz, n = 8; p = 0.022). C, VGluT1 immunostaining of glutamatergic synapses in microislands containing one, two, or three neurons (white arrows). The right panel is an enlarged image of the indicated rectangular area in the left and middle panels; note the different scale in these panels. D, The number of synapses in microislands consisting of one (WT, 309 ± 57, n = 9; KO, 337 ± 79, n = 9), two (WT, 746 ± 119, n = 7; KO, 761 ± 115, n = 8), or three neurons (WT, 1250 ± 181, n = 6; KO, 1177 ± 125, n = 6) was the same in WT and syt-I KO neurons. The total synapse number was plotted versus the number of neurons, and these data were fitted with a linear function (inset, dashed line). This plot (b value) revealed that an average of 445 synapses was formed per neuron. The asterisks indicate statistically significant differences for syt-I KO versus WT: *p < 0.05. All data shown represent means ± SEM.
As stated above, together with a previous study (Chicka et al., 2008), mini frequency was unchanged in syt-I KO neurons in autaptic cultures, but increased in dissociated cultures. Interestingly, a similar discrepancy in mini frequency between autaptic and dissociated cultures was also observed in another KO mouse model, syt-IV KOs. We found that syt-IV KO hippocampal neurons displayed enhanced mini frequency and amplitude in dissociated cultures but not in autaptic cultures (supplemental Fig. S1, available at www.jneurosci.org as supplemental material). Syt-IV is present on neurotrophin-containing vesicles where it modulates synaptic function via regulation of BDNF release (Dean et al., 2009). Hence, loss of syt-I or syt-IV both result in increased mini frequency in dissociated cultures; this occurs via completely distinct mechanisms, with syt-I acting as a fusion clamp (Chicka et al., 2008), whereas syt-IV acts indirectly via neurotrophin secretion (Dean et al., 2009).
In autaptic cultures, neuronal activity is lower than in dissociated cultures: we did not observe spontaneous action potentials in our recordings from autapses. Does the relative lack of activity in autapses underlie the failure of this preparation to report increases in mini frequency when syt-I has been disrupted? To address this question, we enhanced neuronal activity in autaptic cultures by increasing the extracellular KCl concentration by 5 mm for 4 d. We found that this treatment was effective in that we observed a reduction in mini amplitude (supplemental Fig. S2, available at www.jneurosci.org as supplemental material), most likely via a reduction in surface AMPA receptors (Tokuoka and Goda, 2008). However, this treatment failed to change mini frequency in syt-I KO autapses (supplemental Fig. S2, available at www.jneurosci.org as supplemental material). These results suggest that the differences in the mini frequency phenotype of syt-I KO neurons in autaptic cultures, compared with dissociated cultures, is not attributable to differences in neuronal activity. However, it remains possible that KCl treatment fails to mimic patterns of neuronal activity that might be effective in altering the mini frequency in syt-I KO autapses.
Increases in mini frequency can be attributable to an enhancement in the probability of spontaneous release or can be secondary to an increase in the total number of synapses. For dissociated cultures, we previously ruled out the latter interpretation, since the number of synapses per micrometer was unchanged in syt-I KOs compared with WT neurons (Chicka et al., 2008). However, this question had not been explored using autaptic cultures or microislands that harbor small numbers of neurons. To address this issue, we counted the number of excitatory synapses, marked by VGluT1, in micronetworks consisting of one, two, or three neurons (Fig. 6 C). We found that the total number of excitatory synapses per neuron, ∼445, was the same between WT and syt-I KO neurons in microislands consisting of one to three neurons (given by the slope of the plot shown in Fig. 6 D). The synapse size, measured by area of VGluT1-positive puncta, was indistinguishable between syt-I KO and WT neurons for all conditions tested (data not shown). This synapse number is similar to that of previous reports in autaptic culture (Nägler et al., 2001). Thus, the increase in mini frequency in micronetworks observed in our experiments is attributable to an increase in the probability of spontaneous fusion events.
Discussion
A number of studies using knock-out animals have demonstrated that syt-I plays a critical role in the rapid and synchronous release of neurotransmitters from presynaptic nerve terminals (Koh and Bellen, 2003; Chapman, 2008). However, recordings from mouse syt-I KO neurons have resulted in disparate findings (Geppert et al., 1994; Nishiki and Augustine, 2004a,b; Maximov and Südhof, 2005; Pang et al., 2006; Chicka et al., 2008), and a clear view of the syt-I KO phenotype in vertebrates is lacking.
Here, we compared synaptic vesicle release properties in autaptic and dissociated cultures of hippocampal neurons from syt-I knock-out mice. In autapses, evoked release triggered by a single action potential, the size of the readily releasable pool of synaptic vesicles, as determined using hypertonic sucrose, and release probability were unchanged in syt-I KO neurons. In contrast, evoked release was reduced by ∼60% in dissociated cultures from syt-I KO mice. This reduction was accompanied by lower release probability and by marked reductions in the number of total and docked vesicles. In autaptic cultures, syt-I KO neurons exhibited a higher fraction of slow release with a prolongation of both the fast (10-fold slower) and slow (2-fold slower) components compared with WT. However, in syt-I KO synapses from dissociated cultures, the increase in the fraction of the slow component was larger, but prolongation of the fast component was less marked (twofold slower), and the time constant of the slow component was unchanged. The different extents of prolongation of the fast and slow release components in syt-I KO neurons are attributable to differences in culture conditions; at present, the mechanistic basis for these differences is unclear but might involve the more global depolarization that occurs in recordings from autapses
Interestingly, we found that the reduction in sucrose response in syt-I KO synapses (to 37 ± 5%) is proportional to the reduction in the number of docked vesicles tested by EM in syt-KO synapses (to 35 ± 5%), which suggests that syt-I is not essential for synaptic vesicle priming. This phenotype differs from previous studies on Munc13, a known priming factor (Augustin et al., 1999; Richmond et al., 1999). Knock-out of Munc13 eliminated both spontaneous release and response to hypertonic sucrose but did not reduce the number of docked synaptic vesicles. However, we cannot completely exclude a potential function of syt-I on priming because there is not a definitive correlation between the number of docked vesicles and primed vesicles. Furthermore, in vitro studies suggest that syt-I has subtle priming effects that result in enhanced rates of Ca2+-triggered membrane fusion (Chicka et al., 2008).
As for spontaneous release, mini frequency was unchanged in syt-I KO neurons on microislands that consisted of one to two neurons compared with WT neurons; however, when three or more neurons were present on an island, mini frequency was three to five times greater in the KOs. We found that increasing neuronal activity in autaptic cultures via long-term treatment with KCl did not affect the frequency of spontaneous release events in syt-I KO or WT neurons (supplemental Fig. S2, available at www.jneurosci.org as supplemental material), indicating that the low levels of neuronal activity in autaptic cultures does not account for the unchanged mini frequency in syt-I KOs. These findings are consistent with a previous study by Pang et al. (2006) of dissociated cultures, which reported that blockade of neuronal activity by long-term incubation with TTX does not affect the spontaneous release frequency between syt-I KO and WT neurons.
The increase in mini frequency observed in dissociated syt-I KO hippocampal cultures is not attributable to changes in synapse number (Fig. 6 D) but rather is likely attributable to an increase in the intrinsic rate of spontaneous SNARE catalyzed fusion resulting from relief of an apo-syt-I clamp (Chicka et al., 2008). Since mini frequency is elevated in both dissociated cultures and slice preparations (Kerr et al., 2008), we favor a model in which apo-syt-I does in fact act as a fusion clamp.
It is not yet clear why, in autapses, a clamping function is not apparent. We therefore investigated the generality of this observation using another KO mouse model, syt-IV KOs. We found that syt-IV KOs displayed enhanced mini frequency and amplitude in dissociated cultures but not in autaptic cultures (supplemental Fig. S1, available at www.jneurosci.org as supplemental material). Syt-IV is localized to neurotrophin-containing vesicles where it regulates BDNF release (Dean et al., 2009). Therefore, loss of syt-I or syt-IV both increase mini frequency in dissociated cultures, but they do so by completely distinct mechanisms: syt-I acts as a fusion clamp (Chicka et al., 2008), whereas syt-IV acts indirectly via neurotrophin secretion (Dean et al., 2009). It is striking that these two distinct mechanisms of altering the rate of spontaneous release are both mitigated in autaptic cultures. Apparently, autaptic cultures are resistant to manipulations that change mini frequency, regardless of the means by which minis are altered. These findings indicated that autaptic cultures might not constitute an ideal model system to study fusion clamps or mini frequency. We hypothesize that this refractory quality is attributable to differences in connectivity in the cultured neurons.
A more general observation was that the rate of spontaneous release was markedly increased in microislands that harbor two or more (WT or syt-I KO) neurons compared with autaptic synapses. Apparently, neurons preferentially “chatter” (via minis) with other neurons rather than with themselves. We do not know why the mini frequency is strongly enhanced when a neuron is allowed to form connections with another neuron. In other words, how do neurons “know” that they are isolated on an island or connected to a partner? Does the second neuron impact spontaneous release properties by presenting distinct cell surface molecules or secreted factors to enhance release probability? Or is the effect of the second neuron manifest via differences in the timing of synaptic inputs, which are more asynchronous than in autaptic cultures? Similar questions arise regarding evoked responses, but in this case the differences between syt-I KO and WT neurons can be attributed to differences in vesicle number. For reasons that are unclear, synaptic vesicles are selectively reduced in dissociated cultures but not in autapses of syt-I KO neurons. Additional study of autaptic cultures versus micronetworks of interconnected neurons is needed to shed light on these issues.
In terms of spontaneous release, we consider a working model in which autapses use a negative regulatory mechanism that reduces futile signaling of a neuron onto itself; such a mechanism might occlude the clamping function of apo-syt-I in isolated neurons (Chicka et al., 2008). Although such mechanisms are speculative, the experiments reported here clearly reveal that different vesicle release properties, between autaptic and dissociated cultures, underlie the apparently contradictory syt-I KO phenotypes that have been reported in the literature (Geppert et al., 1994; Nishiki and Augustine, 2004a,b; Pang et al., 2006; Chicka et al., 2008). A new study recently reported an increase in mini frequency and reductions in evoked release in the dentate gyrus of slices from newborn syt-I KO mice (Kerr et al., 2008). These results are consistent with our findings in dissociated cultures. Here, we demonstrate that, at least in the case of syt-I, dissociated cultures more closely mimic findings obtained from slices. Therefore, the interpretation of synaptic transmission data from, for example, genetically modified mice, must take cell culture conditions into account.
In summary, our study reconciles many of the seemingly disparate reports regarding the function of syt-I in synaptic transmission and reveals differences between autaptic and interneuronal synapses. Our findings show that network connectivity can regulate synapse phenotype, including the frequency of spontaneous release events, the kinetics extent of evoked release, release probability, and vesicle distributionin the absence of syt-I.
Footnotes
This work was supported by National Institutes of Health (NIH) National Research Service Award NS049748 (C.D.) and NIH–National Institute of General Medical Sciences Grant GM56827, NIH–National Institute of Mental Health Grant MH61876, and American Heart Association Grant 0440168N (E.R.C.). E.R.C. is an Investigator of the Howard Hughes Medical Institute. We thank members of the Chapman Laboratory and Meyer Jackson for helpful discussions. H.L. designed and performed experiments, analyzed data, and wrote the paper. C.D. performed immunostaining and FM dye experiments, assisted with analysis of data, and helped to write the paper. C.P.A. performed and analyzed tomography experiments. M.D. assisted with data analysis. E.R.C. designed experiments and wrote the paper.
References
- Augustin I, Rosenmund C, Südhof TC, Brose N. Munc13-1 is essential for fusion competence of glutamatergic synaptic vesicles. Nature. 1999;400:457–461. doi: 10.1038/22768. [DOI] [PubMed] [Google Scholar]
- Bekkers JM, Stevens CF. Excitatory and inhibitory autaptic currents in isolated hippocampal neurons maintained in cell culture. Proc Natl Acad Sci U S A. 1991;88:7834–7838. doi: 10.1073/pnas.88.17.7834. [DOI] [PMC free article] [PubMed] [Google Scholar]
- Broadie K, Bellen HJ, DiAntonio A, Littleton JT, Schwarz TL. Absence of synaptotagmin disrupts excitation-secretion coupling during synaptic transmission. Proc Natl Acad Sci U S A. 1994;91:10727–10731. doi: 10.1073/pnas.91.22.10727. [DOI] [PMC free article] [PubMed] [Google Scholar]
- Chapman ER. How does synaptotagmin trigger neurotransmitter release? Annu Rev Biochem. 2008;77:615–641. doi: 10.1146/annurev.biochem.77.062005.101135. [DOI] [PubMed] [Google Scholar]
- Chicka MC, Hui E, Liu H, Chapman ER. Synaptotagmin arrests the SNARE complex before triggering fast, efficient membrane fusion in response to Ca2+ . Nat Struct Mol Biol. 2008;15:827–835. doi: 10.1038/nsmb.1463. [DOI] [PMC free article] [PubMed] [Google Scholar]
- Dean C, Liu H, Dunning FM, Chang PY, Jackson MB, Chapman ER. Synaptotagmin-IV modulates synaptic function and LTP by regulating BDNF release. Nat Neurosci. 2009 doi: 10.1038/nn.2315. in press. [DOI] [PMC free article] [PubMed] [Google Scholar]
- DiAntonio A, Schwarz TL. The effect on synaptic physiology of synaptotagmin mutations in Drosophila . Neuron. 1994;12:909–920. doi: 10.1016/0896-6273(94)90342-5. [DOI] [PubMed] [Google Scholar]
- Feng J, Chi P, Blanpied TA, Xu Y, Magarinos AM, Ferreira A, Takahashi RH, Kao HT, McEwen BS, Ryan TA, Augustine GJ, Greengard P. Regulation of neurotransmitter release by synapsin III. J Neurosci. 2002;22:4372–4380. doi: 10.1523/JNEUROSCI.22-11-04372.2002. [DOI] [PMC free article] [PubMed] [Google Scholar]
- Geppert M, Goda Y, Hammer RE, Li C, Rosahl TW, Stevens CF, Südhof TC. Synaptotagmin I: a major Ca2+ sensor for transmitter release at a central synapse. Cell. 1994;79:717–727. doi: 10.1016/0092-8674(94)90556-8. [DOI] [PubMed] [Google Scholar]
- Gitler D, Xu Y, Kao HT, Lin D, Lim S, Feng J, Greengard P, Augustine GJ. Molecular determinants of synapsin targeting to presynaptic terminals. J Neurosci. 2004;24:3711–3720. doi: 10.1523/JNEUROSCI.5225-03.2004. [DOI] [PMC free article] [PubMed] [Google Scholar]
- Goda Y, Stevens CF. Two components of transmitter release at a central synapse. Proc Natl Acad Sci U S A. 1994;91:12942–12946. doi: 10.1073/pnas.91.26.12942. [DOI] [PMC free article] [PubMed] [Google Scholar]
- Katz B. Springfield, IL: Thomas; 1969. The release of neural transmitter substances. [Google Scholar]
- Kerr AM, Reisinger E, Jonas P. Differential dependence of phasic transmitter release on synaptotagmin 1 at GABAergic and glutamatergic hippocampal synapses. Proc Natl Acad Sci U S A. 2008;105:15581–15586. doi: 10.1073/pnas.0800621105. [DOI] [PMC free article] [PubMed] [Google Scholar]
- Koh TW, Bellen HJ. Synaptotagmin I, a Ca2+ sensor for neurotransmitter release. Trends Neurosci. 2003;26:413–422. doi: 10.1016/S0166-2236(03)00195-4. [DOI] [PubMed] [Google Scholar]
- Kremer JR, Mastronarde DN, McIntosh JR. Computer visualization of three-dimensional image data using IMOD. J Struct Biol. 1996;116:71–76. doi: 10.1006/jsbi.1996.0013. [DOI] [PubMed] [Google Scholar]
- Littleton JT, Stern M, Perin M, Bellen HJ. Calcium dependence of neurotransmitter release and rate of spontaneous vesicle fusions are altered in Drosophila synaptotagmin mutants. Proc Natl Acad Sci U S A. 1994;91:10888–10892. doi: 10.1073/pnas.91.23.10888. [DOI] [PMC free article] [PubMed] [Google Scholar]
- Maximov A, Südhof TC. Autonomous function of synaptotagmin 1 in triggering synchronous release independent of asynchronous release. Neuron. 2005;48:547–554. doi: 10.1016/j.neuron.2005.09.006. [DOI] [PubMed] [Google Scholar]
- Moulder KL, Mennerick S. Reluctant vesicles contribute to the total readily releasable pool in glutamatergic hippocampal neurons. J Neurosci. 2005;25:3842–3850. doi: 10.1523/JNEUROSCI.5231-04.2005. [DOI] [PMC free article] [PubMed] [Google Scholar]
- Murthy VN, Schikorski T, Stevens CF, Zhu Y. Inactivity produces increases in neurotransmitter release and synapse size. Neuron. 2001;32:673–682. doi: 10.1016/s0896-6273(01)00500-1. [DOI] [PubMed] [Google Scholar]
- Nägler K, Mauch DH, Pfrieger FW. Glia-derived signals induce synapse formation in neurones of the rat central nervous system. J Physiol. 2001;533:665–679. doi: 10.1111/j.1469-7793.2001.00665.x. [DOI] [PMC free article] [PubMed] [Google Scholar]
- Nicholson-Tomishima K, Ryan TA. Kinetic efficiency of endocytosis at mammalian CNS synapses requires synaptotagmin I. Proc Natl Acad Sci U S A. 2004;101:16648–16652. doi: 10.1073/pnas.0406968101. [DOI] [PMC free article] [PubMed] [Google Scholar]
- Nishiki T, Augustine GJ. Synaptotagmin I synchronizes transmitter release in mouse hippocampal neurons. J Neurosci. 2004a;24:6127–6132. doi: 10.1523/JNEUROSCI.1563-04.2004. [DOI] [PMC free article] [PubMed] [Google Scholar]
- Nishiki T, Augustine GJ. Dual roles of the C2B domain of synaptotagmin I in synchronizing Ca2+-dependent neurotransmitter release. J Neurosci. 2004b;24:8542–8550. doi: 10.1523/JNEUROSCI.2545-04.2004. [DOI] [PMC free article] [PubMed] [Google Scholar]
- Pang ZP, Sun J, Rizo J, Maximov A, Südhof TC. Genetic analysis of synaptotagmin 2 in spontaneous and Ca2+-triggered neurotransmitter release. EMBO J. 2006;25:2039–2050. doi: 10.1038/sj.emboj.7601103. [DOI] [PMC free article] [PubMed] [Google Scholar]
- Poskanzer KE, Marek KW, Sweeney ST, Davis GW. Synaptotagmin I is necessary for compensatory synaptic vesicle endocytosis in vivo. Nature. 2003;426:559–563. doi: 10.1038/nature02184. [DOI] [PubMed] [Google Scholar]
- Reist NE, Buchanan J, Li J, DiAntonio A, Buxton EM, Schwarz TL. Morphologically docked synaptic vesicles are reduced in synaptotagmin mutants of Drosophila . J Neurosci. 1998;18:7662–7673. doi: 10.1523/JNEUROSCI.18-19-07662.1998. [DOI] [PMC free article] [PubMed] [Google Scholar]
- Richmond JE, Davis WS, Jorgensen EM. UNC-13 is required for synaptic vesicle fusion in C. elegans . Nat Neurosci. 1999;2:959–964. doi: 10.1038/14755. [DOI] [PMC free article] [PubMed] [Google Scholar]
- Rosenmund C, Stevens CF. Definition of the readily releasable pool of vesicles at hippocampal synapses. Neuron. 1996;16:1197–1207. doi: 10.1016/s0896-6273(00)80146-4. [DOI] [PubMed] [Google Scholar]
- Rosenmund C, Feltz A, Westbrook GL. Synaptic NMDA receptor channels have a low open probability. J Neurosci. 1995;15:2788–2795. doi: 10.1523/JNEUROSCI.15-04-02788.1995. [DOI] [PMC free article] [PubMed] [Google Scholar]
- Rostaing P, Real E, Siksou L, Lechaire JP, Boudier T, Boeckers TM, Gertler F, Gundelfinger ED, Triller A, Marty S. Analysis of synaptic ultrastructure without fixative using high-pressure freezing and tomography. Eur J Neurosci. 2006;24:3463–3474. doi: 10.1111/j.1460-9568.2006.05234.x. [DOI] [PubMed] [Google Scholar]
- Sawaguchi A, McDonald KL, Karvar S, Forte JG. A new approach for high-pressure freezing of primary culture cells: the fine structure and stimulation-associated transformation of cultured rabbit gastric parietal cells. J Microsc. 2002;208:158–166. doi: 10.1046/j.1365-2818.2002.01085.x. [DOI] [PubMed] [Google Scholar]
- Shin OH, Rhee JS, Tang J, Sugita S, Rosenmund C, Südhof TC. Sr2+ binding to the Ca2+ binding site of the synaptotagmin 1 C2B domain triggers fast exocytosis without stimulating SNARE interactions. Neuron. 2003;37:99–108. doi: 10.1016/s0896-6273(02)01145-5. [DOI] [PubMed] [Google Scholar]
- Stevens CF, Williams JH. Discharge of the readily releasable pool with action potentials at hippocampal synapses. J Neurophysiol. 2007;98:3221–3229. doi: 10.1152/jn.00857.2007. [DOI] [PMC free article] [PubMed] [Google Scholar]
- Tokuoka H, Goda Y. Activity-dependent coordination of presynaptic release probability and postsynaptic GluR2 abundance at single synapses. Proc Natl Acad Sci U S A. 2008;105:14656–14661. doi: 10.1073/pnas.0805705105. [DOI] [PMC free article] [PubMed] [Google Scholar]
- Yoshihara M, Littleton JT. Synaptotagmin I functions as a calcium sensor to synchronize neurotransmitter release. Neuron. 2002;36:897–908. doi: 10.1016/s0896-6273(02)01065-6. [DOI] [PubMed] [Google Scholar]