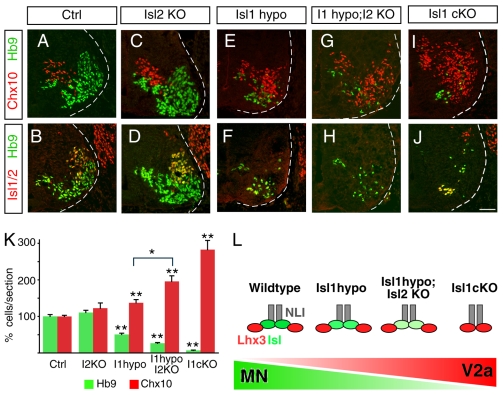
Fig. 4.
The balance between MN and V2a IN development is sensitive to Isl protein levels. (A-J) Immunolabeling to detect Isl1/2+ and Hb9+ MNs, and Chx10+ V2a INs in E11.5 cervical spinal cords. Wild-type (Ctrl; A,B), Isl2 null (Isl2 KO; C,D), Isl1 hypo (E,F), Isl1 hypo; Isl2 KO (G,H) and Isl1 cKO (I,J) embryos were examined. (K) Quantification of Hb9+ MNs and Chx10+ V2a INs in transverse sections of E11.5 embryos. The loss of Isl labeling was found to correlate with an increase in V2a IN (Chx10) labeling. Each bar represents the average of eight sections collected from three different embryos. Mean±s.e. is shown. Asterisks indicate statistically significant differences compared with control or groups marked with bracket (*P<0.05; **P<0.01, paired Student's t-test). (L) Diagram depicting the hexameric 2-NLI: 2-Lhx3: 2-Isl1 transcription complex in wild-type and Isl mutant embryos. As Isl protein level drops, the formation of 2-NLI: 2-Lhx3 complexes for V2a IN development are likely to predominate. Scale bar: in J, 40 μm for A-J.

