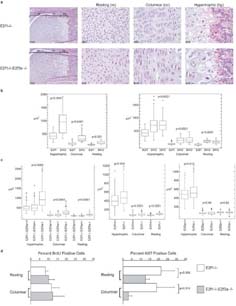
Figure 4.
Mutation of E2f1 and E2f3a results in abnormal cartilage morphology. (a) Hematoxylin and eosin stained sections of hind leg femoral epiphyses from E2f1-/- and E2f1-/-;E2f3a-/- mutant littermate P1 pups. The zones of resting, columnar and prehypertrophic/hypertrophic chondrocytes are shown. Cells in all three zones are larger in E2f1;E2f3a mutants in comparison with control E2f1 mutants, in addition cells within the columnar zone are disorganized in the E2f1;E2f3a mutants in comparison with control E2f1 mutants and don't form the typical stacked columns. (b) From photographs of E2f1 mutant and littermate E2f1;E2f3a mutant femurs chondrocyte sizes in each zone were measured and the data displayed as box plots for two representative P1 litters illustrating the universal increase in cell size. The data was also analyzed using a student's t-Test and, in all zones, cells in the E2f1;E2f3a mutants were statistically significantly larger than those in the same zones of the E2f1 mutants (p values indicated). (c) Box plot analyses of chondrocyte size quantification from three or more E2f1;E2f3a mutant embryos and littermate controls of the indicated genotypes at 18.5dpc show a similar phenotype (left panel). A weaker but statistically significant increase in cell size is observed in 18.5dpc E2f1-/- embryos relative to wildtype controls (middle panel). A minor cell size increase is also seen in 18.5dpc E2f3a-/- embryos versus wildtype controls only in the hypertrophic chondrocytes (right panel), p values derived from Student's t-test analysis of the mean cell sizes are shown. (d) Quantification of proliferation markers in resting and columnar chondrocytes at 18.5 dpc. Immunohistochemistry was used to label cells that had incorporated BrdU or expressed Ki67. No significant difference in BrdU labeling was detected but Ki67 was detected in a smaller percentage of cells within the columnar layer in E2f1;E2f3a mutants relative to E2f1 mutants (mean +/- s.d. and p values indicated).

