Abstract
Surface-bound fluorescence assays such as microarrays have emerged as a prominent technology in current life sciences research and are currently performed on optically passive substrates such as glass microscope slides. We present an alternative approach using photonic crystal substrates exhibiting resonant reflections. In this work, we design and fabricate a photonic crystal with a TM-polarized resonance at the cyanine-5 excitation wavelength and a TE-polarized resonance spectrally overlapping this fluorophore’s emission spectrum. The former resonance increases the excitation of the fluorophore through enhanced electric field intensities, while the latter resonance redirects a proportion of emitted light toward the detection instrumentation. Spots of cyanine-5 conjugated streptavidin on the photonic crystal demonstrate a 60-fold increase in fluorescence intensity and a 42-fold increase in signal-to-noise ratio relative to a glass slide.
The microarray is a common method for quantifying molecular species present in a test sample, with applications in life science research and clinical diagnostics enabled by detection of single-strand DNA sequences for gene expression analysis1 or detection of disease biomarker proteins.2 The utility of microarrays is attributed to the ability to dispense thousands of specific biological capture molecules in a spatially defined pattern. By allowing fluorescently labeled biomolecules in a sample to be captured by their complementary binding partners within the array, researchers can identify the presence and quantity of specific analytes in a high throughput fashion. However, information about low abundance molecules within samples may be lost because the fluorescence measurement systems lack the sensitivity to detect a small number of fluorescent tags. By enhancing the signal-to-noise ratio (SNR) observed from surface-bound fluorescent molecules, lower concentrations of analyte molecules may be detected than is possible on an ordinary glass slide microarray substrate.
The SNR from fluorescent spots is enhanced by replacing the common glass slide substrate with a photonic crystal (PC) supporting resonant reflections.3 These PCs are nanostructures comprised of a periodically modulated low refractive index SiO2 surface structure coated with a high refractive index dielectric layer of TiO2. A resonant reflection is observed when evanescent diffracted orders couple to modes of an effective high refractive index layer, and are radiated through diffraction in-phase with the reflected zeroth-order wave and out-of-phase with the transmitted zeroth-order wave.4 Under broadband illumination a highly efficient reflection is observed at a specific wavelength. PC surfaces have been demonstrated with resonances that coincide with the wavelength of a laser that is used to excite fluorophores, leading to increased local energy density which strongly excites fluorophores (enhanced excitation).5, 6 PCs with resonances that coincide with the emission wavelength of a fluorescent dye have also been demonstrated, allowing light emitted by fluorohpores to couple into resonant modes and reradiate toward the direction of the excitation source (enhanced extraction).7
Enhanced excitation and enhanced extraction independently augment the signal observed from surface-bound fluorophores, and can yield multiplicative effects when combined. In this work, we use a TM resonance to achieve a small resonant linewidth for enhanced excitation and a TE resonance for broad spectral overlap with cyanine-5 (Cy-5) emission. Rigorous coupled-wave analysis (RCWA) simulation aids the design of a linear grating (one-dimensional) surface PC optimized for normal incidence illumination, and this design is translated to a fabricated PC structure by nanoreplica molding. Using a commercially available microarray scanner, we demonstrate a Cy-5 enhancement of ∼60×, significantly higher than previous one-dimensional PCs.
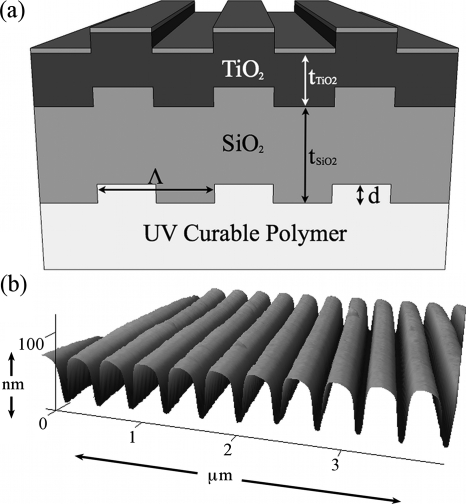
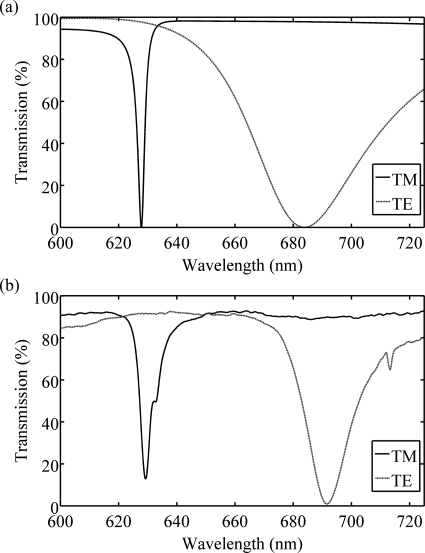
The one-dimensional PC was designed by simulation software to exhibit a resonant reflection at the He–Ne laser excitation wavelength (λ=632.8 nm) as well as a second resonance overlapping the transmission bandwidth of the Cy-5 emission filter (690±20 nm). The resonance at the Cy-5 excitation wavelength was designed for TM-polarized illumination (electric field components perpendicular to periodic modulation), while the resonance overlapping the Cy-5 emission spectrum was designed for TE-polarized illumination (electric field components parallel to periodic modulation). The simulation package (DIFFRACTMOD, RSoft) employs RCWA to determine resonance wavelengths based on PC period (Λ), grating depth (d), TiO2 thickness (tTiO2), and material refractive indices (nUVCP=1.46, nSiO2=1.46, and nTiO2=2.35) derived from experimentally determined values. Illumination was fixed to normal incidence. A design of Λ=360 nm, d=60 nm, and tTiO2=160 nm was chosen, with a grating width of 180 nm [Fig. 1a]. A SiO2 layer of thickness tSiO2=300 nm was included to vertically offset the TiO2 layer from the fluorescent UV-curable polymer layer, decreasing substrate fluorescence. The simulated transmission spectra are shown in Fig. 2a.
Figure 1.
(a) Schematic of PC designed in this work. The dimensions are as follows: period Λ=360 nm, grating depth d=60 nm, SiO2 thickness tSiO2=300 nm, and TiO2 thickness tTiO2=160 nm. The grating width is 50% of the period. (b) Atomic force micrograph of PC fabricated by nanoreplica molding, showing the measured period of Λ=368 nm and a grating depth of d=60 nm, in good agreement with the simulated structure.
Figure 2.
(a) Simulated and (b) measured transmission efficiencies as a function of wavelength for white light illumination of the PC at normal incidence with either TM-polarized incident light or TE-polarized incident light.
The PC was fabricated by nanoreplica molding liquid UV-curable polymer into an 8″ silicon wafer with a negative volume image of the PC design.8 After polymer curing, SiO2 and then TiO2 were sputtered onto the structure according to design dimensions. PCs were cut to fit 1×3″ microscope slides and adhered to slides with optical adhesive. PC dimensions were measured by atomic force microscopy [Fig. 1b]; the period was Λ=368 nm and the grating depth was d=60 nm. The resonant wavelengths [Fig. 2b] were determined by illuminating the PC with collimated white light and measuring the transmitted light with a spectrometer (Ocean Optics). The simulated TM resonance wavelength was λTM=628 nm with a full width at half maximum (FWHMTM) of 3 nm, while the measured wavelength was λTM=629 nm with FWHMTM=4.4 nm. The TM resonance wavelength of 628 nm does not exactly match the laser wavelength of 633 nm to allow for shifting in the resonance wavelength when proteins are attached to the surface, locally altering the effective refractive index.9 The simulated TE resonance wavelength was λTE=684 nm with FWHMTE=48.7 nm, with measured values of λTE=692 nm and FWHMTE=17.8 nm. The discrepancy between measured and simulated TE resonance characteristics likely arises because the simulation does not take into account rounding and sidewall deposition of the sputtered dielectric film [Fig. 1b]. However, since the resonance still entirely overlaps the Cy-5 emission range, this deviation should have minimal impact on enhanced extraction.
To evaluate fluorescence enhancement, a ∼15 nm layer of SiO2 was deposited onto the PC and the control glass slide for identical surface chemistry conditions. Both surfaces were cleaned by O2 plasma for 3 min and functionalized by incubation in an enclosed chamber with 5% 3-glycidoxypropyldimethylethoxysilane in dry toluene at 100 °C overnight. Cy-5 conjugated streptavidin (GE Healthcare) at 10 μg∕ml in phosphate buffered saline (PBS) plus 0.5% trehalose was spotted onto the slides (Perkin Elmer Piezorray) with 96 replicates of 300 pL spots per slide. The slides were washed by ultrasonication in a 0.05% Tween solution in PBS for 30 s, followed by ultrapure deionized water rinse. The slides were scanned in a microarray scanner (Tecan LS Reloaded) with TM-polarized 633 nm illumination at an incidence angles of 0° and 20° with fixed photomultiplier tube gain and a resolution of 20 μm. ARRAYPRO ANALYZER software collected spot and background fluorescence intensities. For each spot, the net fluorescence intensity, or the spot intensity minus the local background intensity was calculated. In addition, the SNR, or the net fluorescence intensity divided by the noise (or standard deviation of the local background intensity) was calculated.
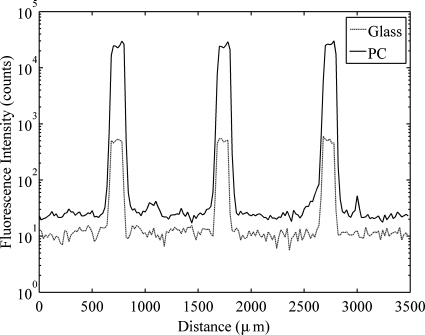
The mean spot intensities over the 96 replicate Cy-5 conjugated streptavidin spots for the PC and glass slide at normal incidence and at an incidence angle of 20° are listed in Table 1. Spot intensities on the PC were enhanced by 59.5× relative to the glass slide at 0°, and the enhancement factor at 20° was 4.81×. The normal incidence SNR enhancement was 41.9× while the SNR enhancement at 20° was 4.3×. A representative line profile generated by plotting fluorescence intensities from a single line of pixels through three spots on the PC and the glass images appears in Fig. 3. This profile clearly illustrates the SNR enhancement provided by the PC, as the fluorescence intensity throughout the spots is significantly elevated on the PC while the background and noise intensities are only slightly higher.
Table 1.
Spot intensities and signal-to-noise ratios for photonic crystal and glass slide at identical scan conditions over 96 replicates per slide. Coefficients of variation (CV) are included for each scan condition.
| PC, 0° incidence | Glass, 0° incidence | PC, 20° incidence | Glass, 20° incidence | |
|---|---|---|---|---|
| Mean spot intensity (counts)±CV | 23 700±12.6% | 398±15.9% | 1430±6.47% | 297±18.4% |
| Signal-to-noise ratio±CV | 6910±22.3% | 165±15.3% | 512±11.6% | 119±18.0% |
Figure 3.
Intensity profile as a function of distance for a line of fluorescent image pixels profiling three spots of cyanine-5 conjugated streptavidin for both the glass slide and the PC under normal incidence illumination. Fluorescence intensity is plotted on a logarithmic scale.
This PC utilizes resonant reflections with a TM-polarized resonance to amplify the excitation light and a TE-polarized resonance to increase detection of fluorophore emission. The intensity enhancement of 59.5× at normal incidence is significantly higher than previous one-dimensional surface PC structures using excitation enhancement alone to achieve an enhancement of 18× (Ref. 6). This suggests that both enhanced excitation and enhanced extraction multiply at normal incidence, greatly improving the PC’s enhancement factor of the PC over previous one-dimensional designs. The PC’s optimization at normal incidence is also useful, since a majority of microarray scanners utilize normal incidence illumination and emission collection. Thus, this work demonstrates a feasible substrate to replace glass microscope slides in microarrays. Coupled with the inexpensive PC fabrication by nanoreplica molding, normal incidence operation makes PC substrates for microarray work attractive to researchers because they can use their current instrumentation and achieve increased performance without significant increases in cost.
In conclusion, we have used RCWA to design a PC operating at normal incidence with a TM resonance to excite surface-bound Cy-5 more strongly and a TE resonance to redirect a larger proportion of Cy-5 emitted light toward detection instrumentation. The PC was fabricated inexpensively by nanoreplica molding and showed good agreement with the design characteristics. By applying identical surface chemistries to the PC and a glass slide, we achieve an intensity enhancement of 60× from Cy-5 conjugated streptavidin spots and a SNR enhancement of 42×.
Acknowledgments
This work was supported by the National Institutes of Health (Grant No. GM086382A), the National Science Foundation (Grant No. CBET 07-54122), and SRU Biosystems. Any opinions, findings, conclusions, or recommendations expressed in this material are those of the authors and do not necessarily reflect the views of National Institutes of Health or the National Science Foundation. The authors thank the staff at the Micro and Nanotechnology Laboratory at the University of Illinois at Urbana-Champaign.
References
- Schena M., Shalon D., Davis R. W., and Brown P. O., Science 270, 467 (1995). 10.1126/science.270.5235.467 [DOI] [PubMed] [Google Scholar]
- Woodbury R. L., Varnum S. M., and Zangar R. C., J. Proteome Res. 1, 233 (2002). 10.1021/pr025506q [DOI] [PubMed] [Google Scholar]
- Budach W., Neuschafer D., Wanke C., and Chibout S. -D., Anal. Chem. 75, 2571 (2003). 10.1021/ac026390k [DOI] [PubMed] [Google Scholar]
- Rosenblatt D., Sharon A., and Friesem A. A., IEEE J. Quantum Electron. 33, 2038 (1997). 10.1109/3.641320 [DOI] [Google Scholar]
- Ganesh N., Mathias P. C., Zhang W., and Cunningham B. T., J. Appl. Phys. 103, 083104 (2008). 10.1063/1.2906175 [DOI] [Google Scholar]
- Mathias P. C., Ganesh N., Zhang W., and Cunningham B. T., J. Appl. Phys. 103, 094320 (2008). 10.1063/1.2917184 [DOI] [Google Scholar]
- Ganesh N., Block I. D., Mathias P. C., Zhang W., Chow E., Malyarchuk V., and Cunningham B. T., Opt. Express 16, 21626 (2008). 10.1364/OE.16.021626 [DOI] [PubMed] [Google Scholar]
- Cunningham B., Lin B., Qiu J., Li P., Pepper J., and Hugh B., Sens. Actuators B 85, 219 (2002). 10.1016/S0925-4005(02)00111-9 [DOI] [Google Scholar]
- Cunningham B. T., Li P., Lin B., and Pepper J., Sens. Actuators B 81, 316 (2002). 10.1016/S0925-4005(01)00976-5 [DOI] [Google Scholar]


