Abstract
Purpose
The purpose of this paper is to compare the uptake of two clinically promising positron emission tomography (PET) hypoxia targeting agents, 124I-iodoazomycin galactopyranoside (124I-IAZG) and 18F-fluoromisonidazole (18F-FMISO), by dynamic microPET imaging, in the same rats bearing liver tumors and peritoneal metastasis.
Methods
Morris hepatoma (RH7777) fragments were surgically implanted into the livers of four nude rats. Tumors formed in the liver and disseminated into the peritoneal cavity. Each rat had a total of two to three liver tumors and peritoneal metastasis measuring 10–15 mm in size. Animals were injected with 18F-FMISO, followed on the next day (upon complete 18F decay) by 124I-IAZG. The animals were imaged in list mode on the microPET system from the time of injection of each tracer for 3 h and then again at 6 h and 24 h for the long-lived 124I-IAZG tracer (4.2-day half-life). Micro computed tomography (CT) scans of each rat were performed for co-registration with the microPET scans acquired with a liver contrast agent, allowing tumor identification. Regions of interest (ROIs) were drawn over the heart, liver, muscle, and the hottest areas of the tumors. Time-activity curves (TACs) were drawn for each tissue ROI.
Results
The 18F-FMISO signal increased in tumors over the 3-h time course of observation. In contrast, after the initial injection, the 124I-IAZG signal slowly and continuously declined in the tumors. Nevertheless, the tumor-to-normal-tissue ratios of 124I-IAZG increased, but more slowly than those of 18F-FMISO and as a result of the differentially faster clearance from the surrounding normal tissues. These pharmacokinetic patterns were seen in all 11 tumors of the four animals.
Conclusions
18F-FMISO localizes in the same intra-tumor regions as 124I-IAZG. The contrast ratios (tumor/background) reach similar values for the two hypoxia tracers, but at later times for 124I-IAZG than for 18F-FMISO and, therefore, with poorer count statistics. As a consequence, the 18F-FMISO images are of superior diagnostic image quality to the 124I-IAZG images in the Morris hepatoma McA-R-7777 tumor model.
Keywords: Hypoxia, Fluoromisonidazole, Iodoazomycin galactopyranoside, MicroPET, Dynamic PET
Introduction
Tumor hypoxia modulates cancer behavior and increases resistance to most types of cancer therapy [1, 2]. Recently, high hypoxia levels have been reported in patients with colorectal liver metastasis based on the post-surgical analysis of tumor specimens [3]. The ability to preoperatively and noninvasively assess liver tumor hypoxia would offer three potential benefits: (i) the identification of tumor heterogeneity for biologically based focal ablative therapies (e.g., intensity-modulated radiotherapy or high-focus ultrasound therapy) [4]; (ii) the selection of patients who would benefit from newly developed hypoxia-targeted treatment regimens [5]; and (iii) a prognostic marker of treatment outcome [6].
A variety of different hypoxia markers [7–12] have been labeled with positron-emitting radionuclides to enable the noninvasive imaging of tumor hypoxia by positron emission tomography (PET). While many of these labeled markers exhibit promising results in vitro, and also in vivo in flank tumor models, their utility in more clinically relevant orthotopic tumor models has not been studied. The imaging of hypoxia in intra-abdominal tumors is problematic because of high tracer background levels in the abdomen [12–15]. Choosing the appropriate imaging tracer will be essential for the success of clinical trials using imaging as a biological (e.g., hypoxia) tumor biomarker. Understanding the relative advantages and disadvantages of various tracers is challenging, since most investigators explore a single tracer and aspects of their study designs, such as the tumor models and imaging time points used, vary substantially. Comparison is most effective when multiple tracers are tested on identical tumor models, using identical imaging protocols [16].
In the present study, we compared uptake of 124Iiodoazomycin galactopyranoside (124I-IAZG) with the uptake of fluorine-18-labeled fluoromisonidazole (18F-FMISO; half-life 1.8 h), as assessed by dynamic microPET imaging, testing both tracers in the same rats bearing liver tumors and peritoneal metastasis [17, 18]. The selection of 124I-IAZG for our study was based on hypoxia tracer uptake in other tumor animal models, where the potential advantages of delayed PET imaging with 124I was demonstrated [14]. 18F-FMISO was chosen for comparison because it has been extensively evaluated in the United States (University of Washington, WA) and in Europe (University of Tuebingen, Germany) and, at present, is considered to be the standard for PET hypoxia imaging [19–21].
Materials and methods
Animal tumor model
Animal studies were performed in conformity with all applicable policies, procedures, and regulatory requirements of the Institutional Animal Care and Use Committee (IACUC), the Research Animal Resource Center (RARC) of the Memorial Sloan-Kettering Cancer Center (MSKCC), and the National Institutes of Health (NIH)’s “Guide for the care and use of laboratory animals.” Six- to eight-week-old nude rats were purchased from Charles River Laboratories (Wilmington, MA), two were kept per cage, and were allowed food and water ad libitum. All animal procedures were performed under anesthesia by the inhalation of 2% isoflurane. The syngeneic rat hepatocellular carcinoma cell line Morris hepatoma McA-R-7777 was obtained from the American Type Culture Collection (Rockville, MD) and was maintained in the Dulbeccos modified Eagles medium (DMEM, Memorial Sloan-Kettering Cancer Center media lab, New York, NY) supplemented with high glucose (4.5 g/l), 10% fetal bovine serum, and 5 mmol/l L-glutamine. A subcutaneous flank tumor was established by injecting roughly 5×10⁶ Morris hepatoma cells (RH7777) in phosphate buffer solution (PBS) in a total volume of 50 µl and the animal was monitored until the tumor reached a size of 1 cm. The animal was sacrificed and the tumor was harvested and cut to small fragments of size ~2 mm3. Other nude rats were anesthetized and opened via midline incision. With a pointed #11 blade scalpel lying flat on the liver surface, a 1-cm-long tunnel was punctured into the left liver lobe horizontally just beneath the liver capsule and an approximately 2-mm3 tumor fragment was inserted into the resulting superficial pouch. After further implantations into the middle and right liver, the animals were closed and returned to their cages. Tumor growth was monitored with a dedicated small animal ultrasound system (Vevo 770™, VisualSonics, Toronto, Canada). When implanted tumor fragments disseminated into the peritoneal cavity and grew as peritoneal implants, they were considered to mimic peritoneal metastasis and their detection by PET imaging with the two hypoxia tracers was also compared. The liver tumors and peritoneal metastasis that result from the procedure described above consistently feature extensive hypoxic areas throughout the entire tumor (pO2<0.5 mmHg), as demonstrated by immunohistochemistry staining with the well-established hypoxia tracers pimonidazole and EF5 in previous studies (C.C.R., unpublished data, 2006).
Radioisotope production
18F-fluoride was produced in-house on an EBCO TR19/9 cyclotron (EBCO Technologies, Vancouver, Canada) capable of accelerating protons to a maximal energy of 19 MeV. 18F was produced by proton irradiation of an enriched 18O-water target in a small-volume titanium chamber. 18F-FMISO was prepared as previously reported [22], with minor modifications. IAZG was radiolabeled with 124I as previously described by Zanzonico et al. [14], with exchange labeling between the nonradioactive iodoazomycin nucleoside and 124I-NaI (Eastern Isotopes, Somerset, NJ), and purification by AgCl-treated celite/anion exchange chromatography [10]. Radiochemical purity, evaluated by thin-layer chromatography, was >99%.
FMISO (1-(2-nitroimidazole)-3-fluoro-2-propanol) is a compound with a 2-nitroimidazole (azomycin) group coupled with 3-fluoro-2-propanol. IAZG (1-(6-deoxy-6-iodo-beta-D-galactopyranosyl) 2-nitroimidazole) is a “sugar-coupled” 2-nitroimidazole (azomycin) derivative. A significant difference between these two hypoxia markers is their lipophilicity [23]. According to Sorger et al. [23], the partition coefficients, which are frequently used as lipophilicity indicators, for FMISO and IAZA are 2.60 and 4.98, respectively. And according to Engelhardt et al. [22], the partition coefficients for IAZA and IAZG are 3.85 and 0.63, respectively.
Dynamic hypoxia microPET-CT imaging
The study was performed on four rats, each with a total of two to three liver tumors and peritoneal metastasis of 10–15 mm in size. A two-day imaging procedure (described below) was performed on one pair of rats and was repeated three weeks later on a second pair of rats. Imaging was performed using an R4 or a Focus 120 microPET™ dedicated small-animal PET scanner (Concorde Microsystems Inc., Knoxville, TN). The rats were maintained under 2% isofluorane anesthesia in oxygen at a flow rate of 2 L/min during the entire scanning period. During imaging, the body temperature of the anesthetized animals was stabilized with a heat lamp. With a single bed position centered on the animals’ livers, the lower half of the thorax (including the heart) and the upper half of the abdomen were covered by the scanners. On day one, two rats were injected with 74 MBq (2 mCi) of 18F-FMISO (t1/2=1.8 h) intravenously. Twenty-four hours later, after the 18F-FMISO activity had decayed to a negligible fraction, 37 MBq (1 mCi) of 124I-IAZG was injected into the same two rats. The long half-life of 124I (t1/2=4.2 d) permitted additional acquisitions of 1-h duration at 6 h (all four rats) and at 24 h (two of four rats) after injection.
Three-dimensional (3D) list-mode data were acquired using an energy window of 350–700 keV and a coincidence timing window of 6 ns. These data were then sorted into two-dimensional (2D) histograms by Fourier re-binning using a span of 3 and a maximum ring difference of either 32 (R4) or 47 (Focus 120). Transverse images were reconstructed by filtered back-projection using a ramp filter with a cut-off frequency equal to the Nyquist frequency in either a 128×128×64 matrix (R4) or a 128×128×94 matrix (Focus 120) comprised of 0.866×0.866×0.866-mm voxels. The image data were corrected for: (a) nonuniformity of scanner response using a uniform cylinder-source-based normalization; (b) dead time count losses using a single-count-rate-based global correction; (c) physical decay to the time of injection; and (d) the 124I branching ratio. There was no correction applied for attenuation, scatter, or partial-volume averaging. The count rates in the reconstructed images were converted to activity concentration (% of injected dose per gram of tissue, %ID/g) using a system calibration factor (µCi/ml/cps/voxel) derived from the imaging of a rat-size phantom filled with a uniform aqueous solution of 18F.
The measured reconstructed spatial resolutions of the R4 and Focus 120 are ~2.3 mm and ~1.6 mm full-width half-maximum (FWHM), respectively, for 18F at the center of the field of view; the corresponding values for 124I are 0.3–0.4 mm larger. The response (observed count rate versus activity) of the R4 and of the Focus 120, measured using18F, is linear up to a total activity of ~1.5 mCi in the field of view (FOV). Only about half of a rat is within the scanner’s FOV, however. Therefore, for a tail vein injection of 2 mCi, no more than about 1 mCi is presumably within the FOV.
To allow for the anatomical orientation of the PET images, computed tomography (CT) scans of each rat were performed for co-registration with each PET scan. For this, six hours prior to the first CT scan, the small animal CT liver contrast agent Fenestra LC (Fenestra LC, Alerion Biomedical, San Diego, CA) was administered [24]. CT scans were performed on a dedicated small animal CT scanner (X-Spect, Gamma Medica, Chicago, IL). PET and CT image fusion and image analysis were performed using ASIPro software (Concorde Microsystems Inc., Knoxville, TN). For each dynamic data set, regions of interest (ROIs) were drawn over the heart (to provide information on the delivered radioactivity), liver, muscle, and the hottest areas of the tumors. Time-activity curves (TACs) were drawn for each tissue ROI and presented on a single graph. For the sake of clarity, error bars have been excluded from the graphs. However, the magnitude of the data variability can be seen by the fluctuation between adjacent time points. Furthermore, ROIs were drawn on the 6-h and 24-h static 124I-IAZG PET images, and decay-corrected measured activities were added to the TAC data.
Results
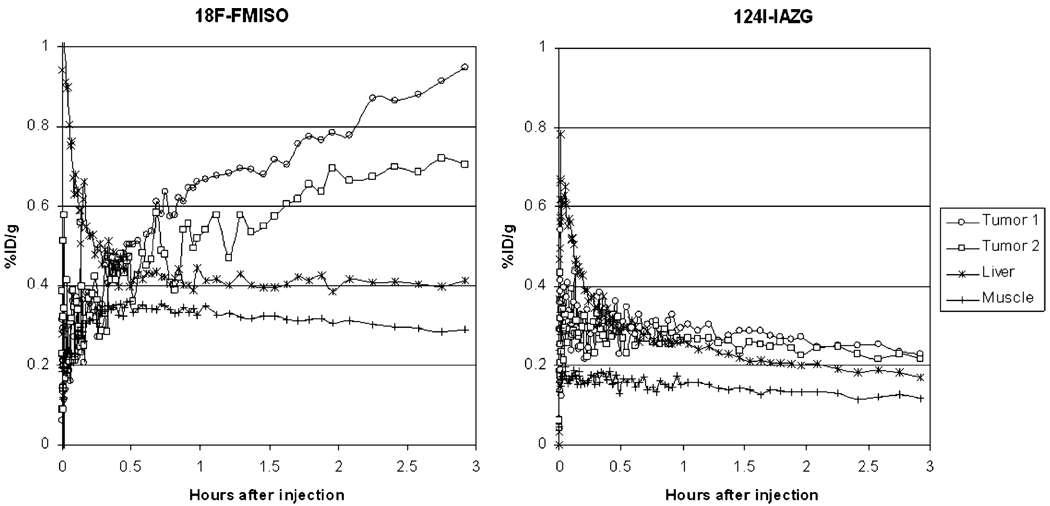
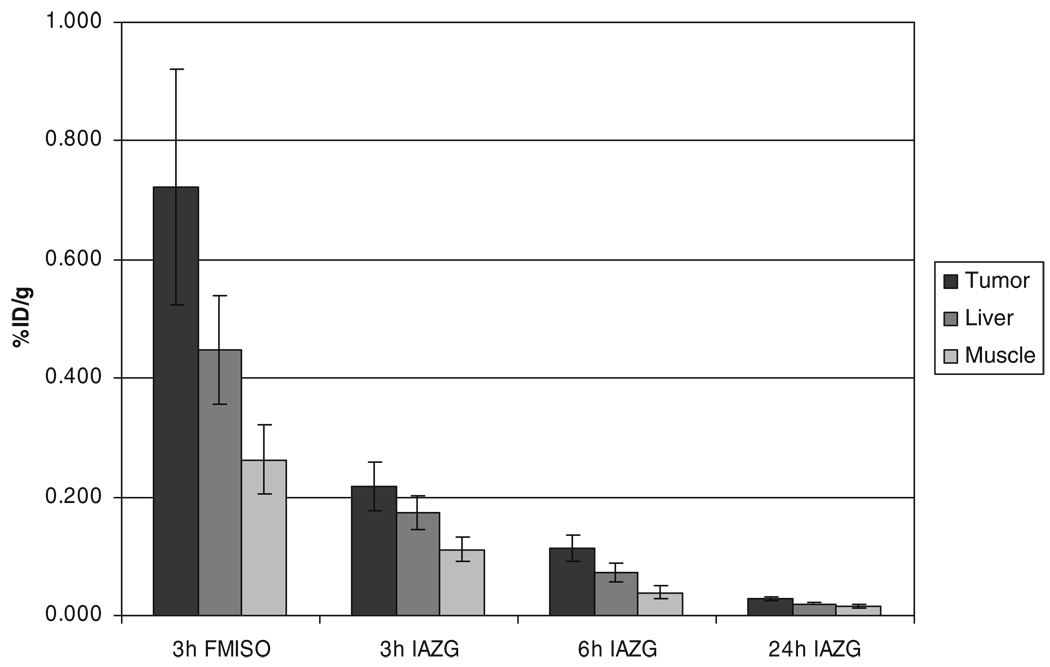
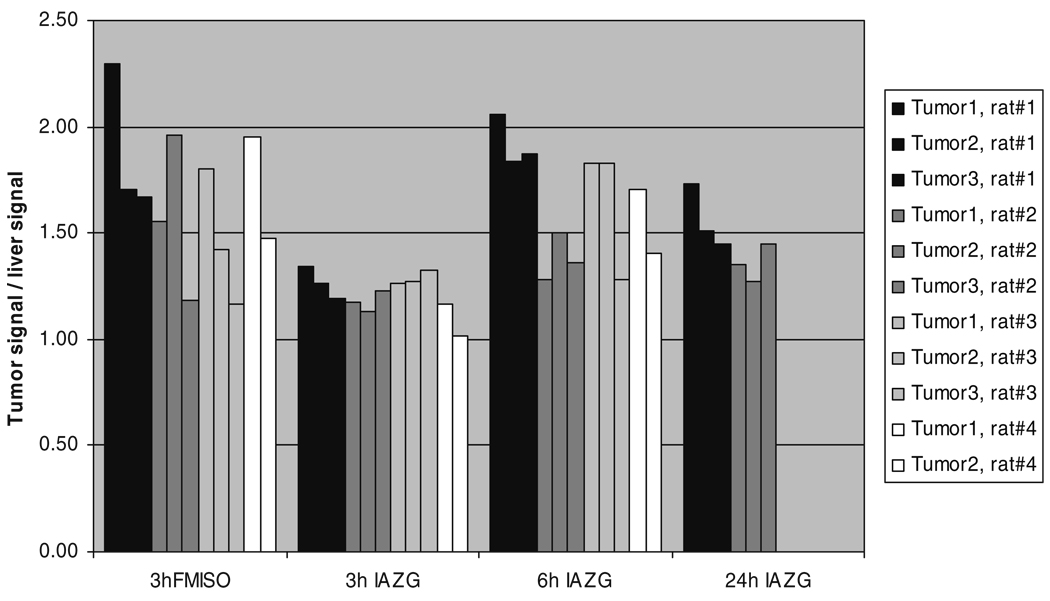
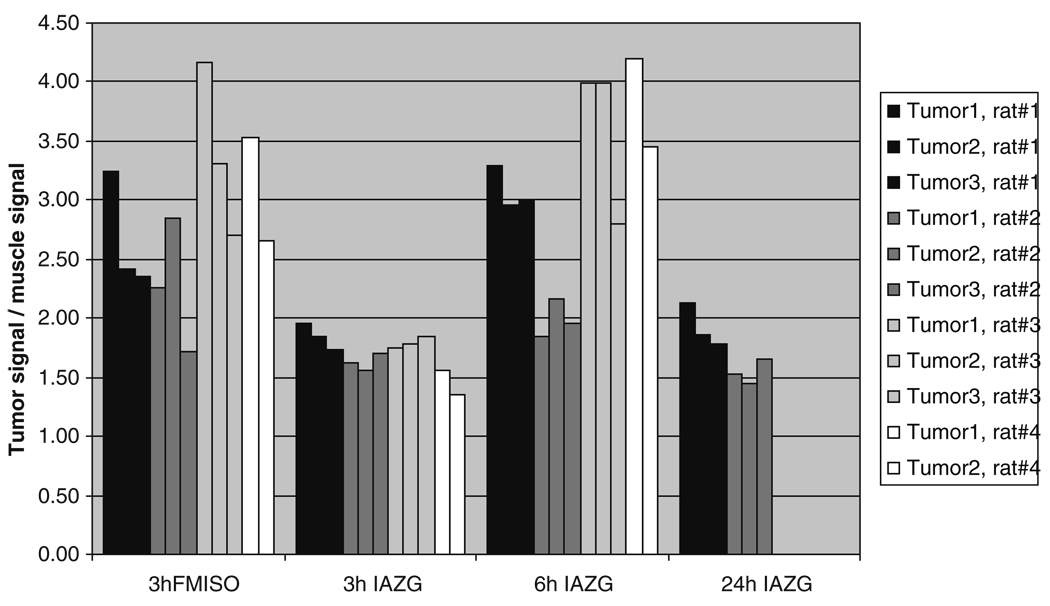
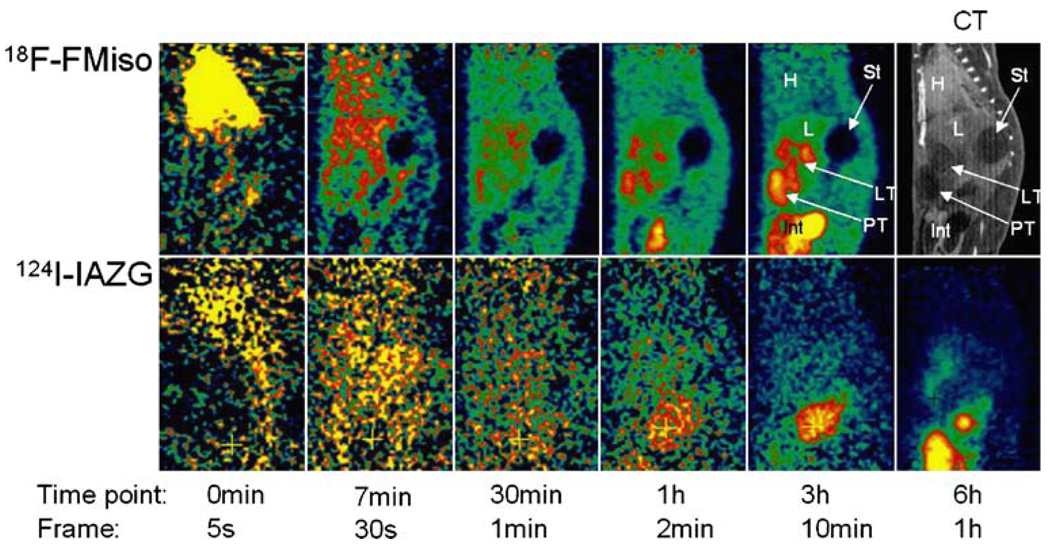
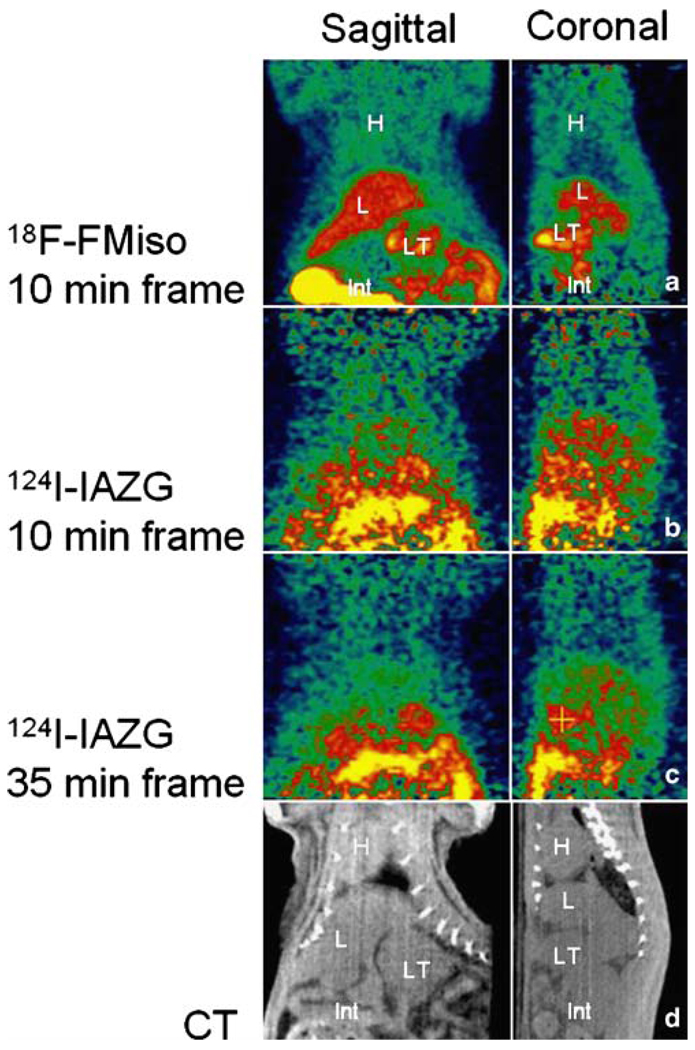
The PET imaging of both 18F-FMISO and 124I-IAZG tracers demonstrated the targeting of tumor hypoxia. Figure 1 shows representative 3-h TACs for 18F-FMISO and 124I-IAZG in tumor, liver, and muscle tissue in the same animal (rat #1). Figure 2 shows the %ID/g in the three tissue types of all animals for both tracers at 3 h, as well as for 124I-IAZG at 6 h and 24 h. There were distinct differences in the TACs of the two hypoxia tracers. The signal increase for 18F-FMISO in tumor tissue suggests the accumulation of the tracer within tumor hypoxia over time and resembles the kinetic uptake profiles reported by Thorwarth et al. in clinical 18F-FMISO studies [25]. In contrast, 124I-IAZG demonstrated a continuous but slow signal decrease in tumor tissue over time. However, the rate of signal decline in the surrounding normal liver and muscle tissue was faster than in the tumor, resulting in a gradually increasing tumor-to-background ratio (Fig. 3 and Fig 4). The described patterns were seen in all 11 tumors of the four animals. Figure 5 shows various frames over time of the dynamic PET studies of an animal for both tracers, as well as the 124I-IAZG at 6-h post-injection. Figure 6 shows the last 10-min frames from the initial (3-h) dynamic image for both tracers in another representative animal. Additionally, for 124I-IAZG, a longer 35-min frame from the end of the 3-h acquisition period was reconstructed to compensate for a possible lower signal-to-noise ratio due to the lower administered dose of 124I-IAZG (1 mCi compared to 2 mCi of 18F-FMISO; Fig. 6d).
Fig. 1.
Representative 3-h time activity curves for 18F-FMISO and 124I-IAZG in tumor tissue, liver, and muscle in the same animal
Fig. 2.
%ID/g in tumor, liver, and muscle for 18F-FMISO at 3 h and 124I-IAZG at 3 h, 6 h, and 24 h after administration
Fig. 3.
Tumor-to-liver ratios of 18F-FMISO at 3 h and of 124I-IAZG at 3 h, 6 h, and 24 h after administration
Fig. 4.
4 Tumor-to-muscle ratios of 18F-FMISO at 3 h and of 124I-IAZG at 3 h, 6 h, and 24 h after administration
Fig. 5.
Representative images over various time points after the administration of 2 mCi of 18F-FMISO (upper row) and 1 mCi of 124I-IAZG (lower row) in the same animal on consecutive days. H=heart; L=liver; St=stomach; LT=liver tumor; PT=peritoneal tumor; Int=intestines
Fig. 6.
PET images 3 h after tracer administration (different animal than in Fig. 5). Ten-minute frames at 3 h after the administration of a 2 mCi 18F-FMISO and b one day later, 1 mCi of 124I-IAZG. c 124I-IAZG images acquired at 3 h, corresponding to the same time as the optimum 18F-FMISO image in panel a, reconstructed with a 35-min data segment to compensate for the lower positron emission fraction. d CT for anatomic correlation. H=heart; L=liver; LT=liver tumor; Int=intestines
Signal intensities in the intestines varied substantially for both tracers from far below and up to three times higher than tumor levels. Signal intensity levels varied not only between animals, but also within animals, depending on region and time. Most of the activity observed in the gastrointestinal tract is associated with stools, as reported in the paper by Zanzonico et al. [14].
Discussion
There is growing evidence to support the contention that tumor hypoxia is a major prognostic indicator of treatment outcome, regardless of the type of therapy [1, 2, 6]. As a consequence, methods to noninvasively determine the tumor hypoxic fraction are of immediate clinical relevance. Surrogate magnetic resonance (MR) methods to measure hypoxia, such as lactate spectroscopy [26] or 19F MRI relaxometry of hexafluorobenzene [27, 28], are under development. However, the focus of our paper was on PET imaging. Since the best hypoxia-specific PET radiotracer is not known, we performed a comparison of two promising radiolabeled nitroimidazoles, one using a short 18F and the second a long-lived 124I isotope, allowing late imaging. Both hypoxia radiotracers have demonstrated a high degree of pO2 specificity in uptake and retention through cell culture studies in our labs and by others [29] and in tumor-bearing animal model studies [14]. What is unique about our study is that it is the first reported comparison of these two tracers by dynamic PET imaging and was performed in an orthotopic model of hepatic carcinoma. The tracers were compared in the same four animals, reducing the possible effects of inter-tumor variability on the analysis.
The kinetic data curves from our study demonstrate the more rapid uptake and differentiation of 18F-FMISO than of 124I-IAZG. At 3 h, 18F-FMISO uptake is more than two times higher in tumor than in normal liver and muscle tissue; in contrast, at the same point, the ratio of 124I-IAZG uptake in the tumor to that in normal liver and muscle tissue is only 1.05 to 1.35 in the same animals. Liver and muscle %ID/g values for 124I-IAZG between 1 and 3 h are about one half those of 18F-FMISO, suggesting a more rapid initial renal elimination. Similar results were observed for normal tissues by Zanzonico et al. in the MCa breast tumor model [14]. Note that the tumor-to-normal-tissue ratios at 3 h for 18F-FMISO range from 1.2 to 2.3, higher for almost all tumors than the corresponding ratios for 124I-IAZG, which range from 1.05 to 1.35. At the later 6-h and 24-h imaging time points, beyond the time range of 18F-FMISO imaging, the 124I-IAZG tumor-to-normal-tissue ratios reach values similar to those of 18F-FMISO for all tumors (see Fig. 3 and Fig 4). This data suggests that the two tracers are comparable in their selective uptake in tumor hypoxia, in terms of tumor-to-normal-tissue ratios. However, the later appearance of higher uptake ratios for 124I-IAZG affects the PET image quality, since adequate hypoxia-specific ratios are only achieved when the absolute amount of tracer concentration is low. In contrast, at the optimum imaging time point for 18F-FMISO (2 h to 3 h), the absolute amount of 18F-FMISO concentration in the tumor is relatively high. This is clearly manifested in the PET images (Fig. 5), where the higher counts from 18F result in sharper and better diagnostic quality images than can be attained for the 124I compound.
124I is a positron emitter with a long half-life of 4.2 days, rendering it highly suitable for many radiotracer applications (such as those with IAZG), where tumor uptake or nonspecific signal clearance is slow. It has not been widely used because: (i) its positron fraction (0.24) is low compared to that of 18F (0.97); (ii) its higher positron energy results in longer range emissions and poorer image resolution; and (iii) its decay scheme is complex and includes several high-energy gamma rays. However, measurements made under realistic conditions on several different PET scanners have shown that satisfactory imaging and quantitation can be achieved [30]. Line source resolution experiments showed that image spatial resolution was only slightly degraded (by less than 20%) on the clinical scanners studied, relative to the spatial resolution seen with 18F, and concluded that quantitative imaging with 124I was possible under realistic conditions with various PET scanners [30]. Resolution measurements have also been performed for 124I on the R4 microPET scanner. The FWHM of the line spread function is 2.2 mm for 18F and 3.3 mm for 124I at the center of the field of view, and 3.2 mm for 18F and 4.1 mm for 124I at 2.5 cm from the center of the field of view, a degradation of only 25% [14].
In conclusion, the findings of the present study show that 18F-FMISO localizes in the same intra-tumor regions as 124I-IAZG, and results in superior diagnostic image quality compared to 124I-IAZG in the Morris hepatoma McA-R-7777 tumor model. The differences appear to be related to the greater positron fraction of 18F, resulting in four-fold more counts (halving the Poisson statistical noise) per unit millicurie administered, and also to differences in the kinetic behavior of the hypoxia tracers. The 18F-FMISO signal was observed to increase in the tumor over the 3-h time course of observation. In contrast, the 124I-IAZG, after the initial blood bolus, slowly and continuously declined in the tumor. Tumor-to-normal tissue ratios improved slowly and steadily as a consequence of more gradual clearance from the tumor than from surrounding normal tissues. The reasons for the different kinetic behavior of 124I-IAZG, relative to the expected slow accumulation seen with 18F-FMISO, is not understood and further investigation will be necessary. Two possible explanations are de-iodination of the 124I-IAZG tracer and differences in octanol-to-water partition coefficients of the respective hypoxia compounds, resulting in differences in the intra- and extra-cellular fractions of the tracers and in the consequent metabolic and elimination rates.
Acknowledgments
Supported in part by R25-CA096945-3 (C.C.R., P.B., H.H., J.L.H.) and by NCI grant PO1 CA115675 on the Detection of Tumor Hypoxia by Non Invasive Nuclear Imaging Methods (C.C.L and J.L.H).
The authors thank Ada Muellner for editing the manuscript.
Contributor Information
Christopher C. Riedl, Department of Radiology, Memorial Sloan-Kettering Cancer Center, New York, NY, USA
Peter Brader, Department of Radiology, Memorial Sloan-Kettering Cancer Center, New York, NY, USA.
Pat Zanzonico, Department of Radiology, Memorial Sloan-Kettering Cancer Center, New York, NY, USA; Department of Medical Physics, Memorial Sloan-Kettering Cancer Center, 1275 York Avenue, New York, NY 10021, USA.
Vincent Reid, Department of Surgery, Memorial Sloan-Kettering Cancer Center, New York, NY, USA.
Yanghee Woo, Department of Surgery, Memorial Sloan-Kettering Cancer Center, New York, NY, USA.
Bixiu Wen, Department of Medical Physics, Memorial Sloan-Kettering Cancer Center, 1275 York Avenue, New York, NY 10021, USA.
C. Clifton Ling, Department of Medical Physics, Memorial Sloan-Kettering Cancer Center, 1275 York Avenue, New York, NY 10021, USA.
Hedvig Hricak, Department of Radiology, Memorial Sloan-Kettering Cancer Center, New York, NY, USA.
Yuman Fong, Department of Surgery, Memorial Sloan-Kettering Cancer Center, New York, NY, USA.
John L. Humm, Department of Radiology, Memorial Sloan-Kettering Cancer Center, New York, NY, USA Department of Medical Physics, Memorial Sloan-Kettering Cancer Center, 1275 York Avenue, New York, NY 10021, USA.
References
- 1.Brizel DM, Sibley GS, Prosnitz LR, Scher RL, Dewhirst MW. Tumor hypoxia adversely affects the prognosis of carcinoma of the head and neck. Int J Radiat Oncol Biol Phys. 1997;38:285–289. doi: 10.1016/s0360-3016(97)00101-6. [DOI] [PubMed] [Google Scholar]
- 2.Gray LH, Conger AD, Ebert M, Hornsey S, Scott OC. The concentration of oxygen dissolved in tissues at the time of irradiation as a factor in radiotherapy. Br J Radiol. 1953;26:638–648. doi: 10.1259/0007-1285-26-312-638. [DOI] [PubMed] [Google Scholar]
- 3.van Laarhoven HW, Kaanders JH, Lok J, Peeters WJ, Rijken PF, Wiering B, et al. Hypoxia in relation to vasculature and proliferation in liver metastases in patients with colorectal cancer. Int J Radiat Oncol Biol Phys. 2006;64:473–482. doi: 10.1016/j.ijrobp.2005.07.982. [DOI] [PubMed] [Google Scholar]
- 4.Chao KS, Bosch WR, Mutic S, Lewis JS, Dehdashti F, Mintun MA, et al. A novel approach to overcome hypoxic tumor resistance: Cu-ATSM-guided intensity-modulated radiation therapy. Int J Radiat Oncol Biol Phys. 2001;49:1171–1182. doi: 10.1016/s0360-3016(00)01433-4. [DOI] [PubMed] [Google Scholar]
- 5.Rajendran JG, Hendrickson KR, Spence AM, Muzi M, Krohn KA, Mankoff DA. Hypoxia imaging-directed radiation treatment planning. Eur J Nucl Med Mol Imaging. 2006;33 Suppl 13:44–53. doi: 10.1007/s00259-006-0135-1. [DOI] [PubMed] [Google Scholar]
- 6.Rischin D, Hicks RJ, Fisher R, Binns D, Corry J, Porceddu S, et al. Prognostic significance of [18F]-misonidazole positron emission tomography-detected tumor hypoxia in patients with advanced head and neck cancer randomly assigned to chemo-radiation with or without tirapazamine: a substudy of Trans-Tasman Radiation Oncology Group Study 98.02. J Clin Oncol. 2006;24:2098–2104. doi: 10.1200/JCO.2005.05.2878. [DOI] [PubMed] [Google Scholar]
- 7.Bruehlmeier M, Roelcke U, Schubiger PA, Ametamey SM. Assessment of hypoxia and perfusion in human brain tumors using PET with 18F-fluoromisonidazole and 15O-H2O. J Nucl Med. 2004;45:1851–1859. [PubMed] [Google Scholar]
- 8.Dehdashti F, Grigsby PW, Mintun MA, Lewis JS, Siegel BA, Welch MJ. Assessing tumor hypoxia in cervical cancer by positron emission tomography with 60Cu-ATSM: relationship to therapeutic response—a preliminary report. Int J Radiat Oncol Biol Phys. 2003;55:1233–1238. doi: 10.1016/s0360-3016(02)04477-2. [DOI] [PubMed] [Google Scholar]
- 9.Rajendran JG, Schwartz DL, O’Sullivan J, Peterson LM, Ng P, Scharnhorst J, et al. Tumor hypoxia imaging with [F-18] fluoromisonidazole positron emission tomography in head and neck cancer. Clin Cancer Res. 2006;12:5435–5441. doi: 10.1158/1078-0432.CCR-05-1773. [DOI] [PMC free article] [PubMed] [Google Scholar]
- 10.Schneider RF, Englehardt EL, Stobbe CC, Fenning MC, Chapman JD. The synthesis and radiolabelling of novel markers of tissue hypoxia of the iodinated azomycin nucleoside class. J Label Comp Radiopharm. 1997;39:541–557. [Google Scholar]
- 11.Valk PE, Mathis CA, Prados MD, Gilbert JC, Budinger TF. Hypoxia in human gliomas: demonstration by PET with fluorine-18-fluoromisonidazole. J Nucl Med. 1992;33:2133–2137. [PubMed] [Google Scholar]
- 12.Yuan H, Schroeder T, Bowsher JE, Hedlund LW, Wong T, Dewhirst MW. Intertumoral differences in hypoxia selectivity of the PET imaging agent 64Cu(II)-diacetyl-bis(N4-methylthiosemicarbazone) J Nucl Med. 2006;47:989–998. [PubMed] [Google Scholar]
- 13.Laforest R, Dehdashti F, Lewis JS, Schwarz SW. Dosimetry of 60/61/62/64Cu-ATSM: a hypoxia imaging agent for PET. Eur J Nucl Med Mol Imaging. 2005;32:764–770. doi: 10.1007/s00259-004-1756-x. [DOI] [PubMed] [Google Scholar]
- 14.Zanzonico P, O’Donoghue J, Chapman JD, Schneider R, Cai S, Larson S, et al. Iodine-124-labeled iodo-azomycin-galactoside imaging of tumor hypoxia in mice with serial microPET scanning. Eur J Nucl Med Mol Imaging. 2004;31:117–128. doi: 10.1007/s00259-003-1322-y. [DOI] [PubMed] [Google Scholar]
- 15.Ziemer LS, Evans SM, Kachur AV, Shuman AL, Cardi CA, Jenkins WT, et al. Noninvasive imaging of tumor hypoxia in rats using the 2-nitroimidazole 18F-EF5. Eur J Nucl Med Mol Imaging. 2003;30:259–266. doi: 10.1007/s00259-002-1037-5. [DOI] [PubMed] [Google Scholar]
- 16.O’Donoghue JA, Zanzonico P, Pugachev A, Wen B, Smith-Jones P, Cai S, et al. Assessment of regional tumor hypoxia using 18F-fluoromisonidazole and 64Cu(II)-diacetyl-bis(N4-methylthiosemicarbazone) positron emission tomography: comparative study featuring microPET imaging, Po2 probe measurement, autoradiography, and fluorescent microscopy in the R3327-AT and FaDu rat tumor models. Int J Radiat Oncol Biol Phys. 2005;61:1493–1502. doi: 10.1016/j.ijrobp.2004.12.057. [DOI] [PubMed] [Google Scholar]
- 17.Dubois L, Landuyt W, Haustermans K, Dupont P, Bormans G, Vermaelen P, et al. Evaluation of hypoxia in an experimental rat tumour model by [(18)F]fluoromisonidazole PET and immunohistochemistry. Br J Cancer. 2004;91:1947–1954. doi: 10.1038/sj.bjc.6602219. [DOI] [PMC free article] [PubMed] [Google Scholar]
- 18.Rasey JS, Koh WJ, Grierson JR, Grunbaum Z, Krohn KA. Radiolabelled fluoromisonidazole as an imaging agent for tumor hypoxia. Int J Radiat Oncol Biol Phys. 1989;17:985–991. doi: 10.1016/0360-3016(89)90146-6. [DOI] [PubMed] [Google Scholar]
- 19.Rajendran JG, Mankoff DA, O'Sullivan F, Peterson LM, Schwartz DL, Conrad EU, et al. Hypoxia and glucose metabolism in malignant tumors: evaluation by [18F]fluoromisonidazole and [18F]fluorodeoxyglucose positron emission tomography imaging. Clin Cancer Res. 2004;10:2245–2252. doi: 10.1158/1078-0432.ccr-0688-3. [DOI] [PubMed] [Google Scholar]
- 20.Rasey JS, Koh WJ, Evans ML, Peterson LM, Lewellen TK, Graham MM, et al. Quantifying regional hypoxia in human tumors with positron emission tomography of [18F]fluoromisonidazole: a pretherapy study of 37 patients. Int J Radiat Oncol Biol Phys. 1996;36:417–428. doi: 10.1016/s0360-3016(96)00325-2. [DOI] [PubMed] [Google Scholar]
- 21.Thorwarth D, Eschmann SM, Paulsen F, Alber M. A kinetic model for dynamic [18F]-Fmiso PET data to analyse tumour hypoxia. Phys Med Biol. 2005;50:2209–2224. doi: 10.1088/0031-9155/50/10/002. [DOI] [PubMed] [Google Scholar]
- 22.Engelhardt EL, Schneider RF, Seeholzer SH, Stobbe CC, Chapman JD. The synthesis and radiolabeling of 2-nitroimidazole derivatives of cyclam and their preclinical evaluation as positive markers of tumor hypoxia. J Nucl Med. 2002;43:837–850. [PubMed] [Google Scholar]
- 23.Sorger D, Patt M, Kumar P, Wiebe LI, Barthel H, Seese A, et al. [18F]Fluoroazomycinarabinofuranoside (18FAZA) and [18F]Fluoromisonidazole (18FMISO): a comparative study of their selective uptake in hypoxic cells and PET imaging in experimental rat tumors. Nucl Med Biol. 2003;30:317–326. doi: 10.1016/s0969-8051(02)00442-0. [DOI] [PubMed] [Google Scholar]
- 24.Weber SM, Peterson KA, Durkee B, Qi C, Longino M, Warner T, et al. Imaging of murine liver tumor using microCT with a hepatocyte-selective contrast agent: accuracy is dependent on adequate contrast enhancement. J Surg Res. 2004;119:41–45. doi: 10.1016/S0022-4804(03)00357-3. [DOI] [PubMed] [Google Scholar]
- 25.Thorwarth D, Eschmann SM, Scheiderbauer J, Paulsen F, Alber M. Kinetic analysis of dynamic 18F-fluoromisonidazole PET correlates with radiation treatment outcome in head-and-neck cancer. BMC Cancer. 2005;5:152. doi: 10.1186/1471-2407-5-152. [DOI] [PMC free article] [PubMed] [Google Scholar]
- 26.Yanai S, Nisimaru N, Soeda T, Yamada K. Simultaneous measurements of lactate and blood flow during hypoxia and recovery from hypoxia in a localized region in the brain of the anesthetized rabbit. Neurosci Res. 1997;27:75–84. doi: 10.1016/s0168-0102(96)01135-2. [DOI] [PubMed] [Google Scholar]
- 27.Hunjan S, Zhao D, Constantinescu A, Hahn EW, Antich PP, Mason RP. Tumor oximetry: demonstration of an enhanced dynamic mapping procedure using fluorine-19 echo planar magnetic resonance imaging in the Dunning prostate R3327-AT1 rat tumor. Int J Radiat Oncol Biol Phys. 2001;49:1097–1108. doi: 10.1016/s0360-3016(00)01460-7. [DOI] [PubMed] [Google Scholar]
- 28.Mason RP, Rodbumrung W, Antich PP. Hexafluorobenzene: a sensitive 19F NMR indicator of tumor oxygenation. NMR Biomed. 1996;9:125–134. doi: 10.1002/(SICI)1099-1492(199605)9:3<125::AID-NBM405>3.0.CO;2-F. [DOI] [PubMed] [Google Scholar]
- 29.Rasey JS, Nelson NJ, Chin L, Evans ML, Grunbaum Z. Characteristics of the binding of labeled fluoromisonidazole in cells in vitro. Radiat Res. 1990;122:301–308. [PubMed] [Google Scholar]
- 30.Pentlow KS, Graham MC, Lambrecht RM, Daghighian F, Bacharach SL, Bendriem B, et al. Quantitative imaging of iodine-124 with PET. J Nucl Med. 1996;37:1557–1562. [PubMed] [Google Scholar]


