

Abstract
The Akt family of serine-threonine kinases participates in diverse cellular processes, including the promotion of cell survival, glucose metabolism and cellular protein synthesis. All three known Akt family members—Akt1, Akt2 and Akt3—are expressed in the myocardium, although Akt1 and Akt2 are most abundant. Previous studies demonstrated that Akt1 and Akt3 overexpression results in enhanced myocardial size and function. Yet, little is known about the role of Akt2 in modulating cardiac metabolism, survival and growth. Here, we utilize murine models with targeted disruption of the akt2 or the akt1 genes to demonstrate that Akt2 – but not Akt1 - is required for insulin-stimulated [3H]-2-deoxyglucose uptake and metabolism. In contrast, akt2−/− mice displayed normal cardiac growth responses to provocative stimulation, including ligand stimulation of cultured cardiomyocytes, pressure overload by transverse aortic constriction and myocardial infarction. However, akt2−/− mice were found to be sensitized to cardiomyocyte apoptosis in response to ischemic injury, and apoptosis was significantly increased in the peri-infarct zone of akt2−/− hearts 7 days after occlusion of the left coronary artery. These results implicate Akt2 in the regulation of cardiomyocyte metabolism and survival.
Cardiac growth and metabolism are coordinated through the integration of a complex array of extracellular and intracellular signals. Much recent work suggests that the Akt family of intracellular serine-threonine kinases regulates both cardiac growth and metabolism (1–3). The Akt family of serine-threonine kinases consists of three isoforms—Akt1, Akt2 and Akt3—each encoded by distinct, highly conserved genes. All three isoforms are expressed in the myocardium, although Akt1 and Akt2 comprise the vast majority of total Akt protein in the heart (2). Examination of numerous experimental models implicates both Akt1 and Akt3 in regulating pathologic and physiologic hypertrophy (4–6). Indeed, the hypothesis that the phosphatidlyinositol-3’ kinase α -Akt1 cascade mediates physiologic cardiac growth is now well-founded (7). Cardiac-specific expression of constitutively active Akt1 (myrAkt1) in transgenic mice results in massive cardiac hypertrophy and fibrosis consistent with pathologic hypertrophy (4), and nuclear localization of Akt1 was recently shown to augment ventricular function and contractility (8). A comparable phenotype was observed in response to cardiac overexpression of activated Akt3, while no observable cardiac growth defects were detectable in Akt3-deficient mice at baseline (6).
Akt family members are also key regulators of cellular metabolism. Indeed, GLUT4 translocation to the plasma membrane is a wortmannin-sensitive process (9), and Akt2-mediated phosphorylation of the syntaxin interacting protein (synip) results in docking and fusion of GLUT4-containing vesicles with the plasma membrane (10). Akt family members promote glycogen synthesis through phosphorylation and inhibition of glycogen synthase kinase 3 (GSK3), which itself inhibits glycogen synthesis (11). GSK3 phosphorylation results in the augmentation of glycogen synthesis, while Akt activation antagonizes the AMP-activated protein kinase (AMPK) (12), a key mediator of glycogenolysis and lipolysis. In addition, Akt kinases inhibit fatty acid metabolism by phosphorylating and inhibiting FOXO-1, a forkhead family transcription factor that positively modulates fatty acid oxidative gene expression (13).
Although the role of Akt family members in cardiac growth and metabolism has been widely studied, the role of Akt2 in the development of physiologic and pathologic cardiac hypertrophy is unknown. Additionally, the role of individual Akt family members in the regulation of cardiac metabolism remains unexplored. In the current study, an Akt2 loss-of-function murine model was utilized to assess the role of Akt2 in cardiac growth, metabolism and cardiomyocyte survival. Here, we show that Akt2 is dispensable in the development of cardiac hypertrophy in response to a variety of physiologic and pathologic provocative stimuli. Conversely, we demonstrate that Akt2 is absolutely required for the maintenance of normal cardiac glucose metabolism and for cardiomyocyte survival in response to ischemic injury.
EXPERIMENTAL PROCEDURES
Maintenance of akt1−/− and akt2−/− Mice
Mice with targeted disruption of the akt1 or the akt2 genes were generated as previously described (14,15). Mice were repeatedly backcrossed (more than 6 times) with WT C57Bl.6 mice obtained from the Jackson Laboratory prior to experimentation. Progeny were screened by tail-prep PCR. All procedures were approved by the committee for the handling and care of laboratory animals (CHCLA) prior to experimentation. Experimentation was performed in strict accordance with CHCLA protocols (Washington University Approval #20030049).
Adult Mouse Cardiomyocyte Cultures (AMCMs)
AMCMs were isolated according to standard procedures with minor modifications (16). Cultures were isolated in the presence of butanedione monoxime (BDM) and were switched to culture medium containing 10µM blebbistatin (Sigma-Aldrich, St. Louis, MO) prior to assay.
[3H]-2-deoxy-D-glucose (2DG) Uptake Assays
Serum-deprived (16h) adult male mouse cardiac myocyte cultures were incubated in mouse myocyte culture medium containing 1µCi/mL 2DG (American Radiochemicals, Inc. St. Louis, MO) in the presence or absence of 2nM insulin (Sigma-Aldrich, St. Louis, MO) for 5’. 2DG uptake was determined to be linear with respect to time for up to 10 minutes 2DG pulse (data not shown). Non-carrier-mediated 2DG uptake was corrected by measuring 2DG uptake in AMCM cultures pre-incubated (15 minutes) with cytochalasin B (Sigma-Aldrich, St. Louis, MO). Counts measured in these cultures were subtracted from experimental cultures as background. Uptake in each culture was normalized for total sample protein abundance by protein concentration determination using the Bradford Coomassie blue dye reagent. Results are expressed as cpm per ug protein ± standard error for n = 3 samples under each condition. Results are representative of a minimum of 3 experiments under each set of conditions.
Western Blotting
SDS-PAGE/immunoblotting were performed according to standard procedures as previously described. Total Akt2 antibodies and phospho-specific Akt, GSK3P, p70 S6 kinase (S6K), S6 ribosomal subunit and ERK1/2 antibodies were obtained from Cell Signaling Technologies (Beverly, MA). Caspase-3, total ERK1/2 and total Akt1 antibodies were obtained from Santa Cruz Biotechnologies (Santa Cruz, CA). Total GLUT1 antiserum was a kind gift from the laboratory of Kelle Moley, Washington University School of Medicine. Phospho-specific Akt, GSK3β and S6 antibodies were probed simultaneously. Thereafter, membranes were stripped of bound antibody using 0.2M NaOH prior to reprobing.
Isolated Working Mouse Heart Perfusion
Isolated mouse working heart perfusions were based on a previously described procedure (17). Adult male mice (8 weeks old) were heparinized (100 units i.p) 10 min prior to anesthesia. Animals were then deeply anesthetized with 5–10 mg of Na+-pentobarbitol (intraperitoneal). Hearts were excised and placed in an ice-cold Krebs-Henseleit bicarbonate (KHB) solution (118 mM NaCl, 25 mM NaHCO3, 4.7 mM KCl, 0.4 mM KH2PO4, 2.5 mM CaCl2, and 5.0 mM glucose, 30 µU/mL insulin, pH 7.4). Hearts were cannulated first via the aorta and perfused retrogradely by the Langendorff method. Following left atrial cannulation, perfusion was switched to working heart perfusion with KHB solution containing 0.4 mM palmitate bound to 3% fatty acid free BSA with a preload pressure of 11.5 mmHg and an afterload pressure of 50 mmHg for 60 minute with oxygenated buffer solution. To determine palmitate and glucose oxidation rates, trace amounts of 3H-palmitate (0.1 µCi/ml) and [U-14C]-glucose (0.1 µCi/ml) were used respectively. Samples were collected every 10 minutes for 14CO2 trapped in 1M hyamine hydroxide solution as result of glucose oxidation and 3H2O released into the buffer as a result of palmitate oxidation and the radioactivity was counted. Functional measurements like cardiac output and aortic flows, peak systolic pressure and heart rate were acquired every ten minutes for 10 seconds using inline flow probes (Transonic Systems, Inc) and MP100 system from AcqKnowledge (BIOPAC Systems, Inc) and a pressure transducer (TSD 104A, BIOPAC System, Inc) respectively. Coronary flow was calculated as the difference between cardiac output and aortic flows. Cardiac work was calculated as the product of peak systolic pressure and cardiac output. At the end of each perfusion, hearts were frozen immediately in liquid nitrogen. A small piece of heart tissue was also used for determining dry to wet weight ratio.
[3H]-palmitate Uptake Assays
Male AMCMs were isolated and serum-starved for 1hr. prior to incubation with up to 100nM insulin for 20hr. Following the incubation period, alpha MEM containing 2mM unlabeled palmitate complexed with 20%BSA (3:1 complex ratio) and 1uCi/mL [3H]-palmitate (New England Nuclear, Boston, MA). Cultures were pulsed (5 minutes) and washed extensively in ice-cold 10mM phloretin in phosphate-buffered saline solution. Cells were lysed in 0.1N NaOH/0.2% SDS, and 80% of the lysate was counted in 5mL Ultima Gold liquid scintillation counting fluid. Uptake in each culture was normalized for total protein amount as measured by Bradford protein concentration determination.
Leucine Uptake Assays
Serum-deprived (16h) adult mouse cardiac myocyte cultures were incubated in mouse myocyte culture medium containing 1µCi/mL [3H]-leucine (Amersham Radiochemicals, Piscataway, NJ) in the presence or absence of 100nM endothelin-1 (Sigma-Aldrich, St. Louis, MO) or 10nM IGF-1 for 16h. Uptake was normalized for total protein abundance by Bradford protein concentration determination. Results are expressed as total cpm per ug protein ± standard error.
Transverse Aortic Constriction (TAC)
TAC operations were performed on anesthetized akt2−/− and WT mice to induce cardiac pressure overload (18). Sham-operated akt2−/− and their WT littermates were used as controls. The surgeon was blinded to the genetic status of the mice. Seven days after surgery, all groups were evaluated by echocardiography (18). Mice with a Doppler gradient between 3.5 and 5.0 m/s were included in subsequent analyses. Mice were sacrificed and postmortem and histological studies were performed as described below.
Histology
Ventricular tissue was fixed in 10% formalin, paraffin-embedded, microtome sectioned and stained with H&E. Myocyte cross-sectional areas from 3–5 randomly selected high-power fields from 3–5 different mice in each group were calculated on a Carl Zeiss, Inc. Axioskop microscope using ImageJ (version 1.34S) software.
In some cases, myocardial tissue sections were evaluated by terminal deoxynucleotidyltransferase (TdT) nick end labeling assay (TUNEL). TUNEL was performed on 5 mm paraffin sections with a TdT-FragEL DNA Fragmentation Detection Kit (Oncogene, Cambridge, MA). Sections were mounted on coverslips and evaluated by fluorescence microscopy.
Experimental Myocardial Infarction
Murine myocardial infarction surgery was performed as previously described (19). In brief, anesthetized and ventilated mice were subjected to thoracotomy, and a single 8–0 prolene suture was tied around the proximal left coronary artery, approximately 1 mm distal to the atrioventricular junction. Successful occlusion was confirmed by the appearance of pallor of the anterior left ventricular wall. The incision was closed and the animal was allowed to recover on a heating pad. The surgeon was blinded to the genetic status of the mice. At 1 day and at 7 days post-MI, mice were evaluated by echocardiography. The initial infarct size, indicated by the segmental wall motion score index (SWMSI), was determined as previously described (20). Only mice with a SWMSI between 0.2 and 0.5 were included in subsequent analyses. 7 days after surgery, mice were sacrificed and the hearts were dissected, weighed, and paraffin-embedded for histologic examination.
In Vitro Apoptosis Assay
Serum-deprived (3hr) AMCMs were incubated in the presence of 25uM H2O2 for 16hr prior to lysis and evaluation of apoptosis by the Cell Death Detection Apoptosis ELISA Assay Kit (Roche Applied Science, Basel, Switzerland) precisely according to manufacturer specifications.
Real-Time Quantitative RT-PCR
total RNA was isolated via Trizol reagent from left ventricles obtained from sham- and MI-operated WT and akt2−/− mice 7 days post-operation. Taqman real-time quantitative RT-PCR was subsequently performed as previously described (18).
Statistical Analysis
All statistical relationships were determined by two-tailed, two-sample homoscedastic t-test with Bonferroni post-hoc correction for multiple comparisons. Results are shown as mean ± SE.
RESULTS
Insulin-stimulated glucose uptake depends on PI3 kinase in cultured cardiomyocytes
Cardiomyocytes express two transmembrane glucose transporters, GLUT1 and GLUT4, and insulin-dependent glucose transport depends on the translocation of GLUT4 from intracellular vesicles to the plasma membrane (21). Previous work implicated the phosphatidylinositol-3’ kinase (PI3K) – phosphoinositide-dependent kinase 1 (PDK1) -Akt pathway in cardiomyocyte glucose transport. Indeed, cultured cardiomyocytes lacking PDK1 are resistant to insulin-stimulated glucose uptake (22). However, other signaling pathways, including the p38 MAPK pathway, may be involved in insulin-stimulated glucose uptake.
To evaluate the role of various signaling pathways in cardiomyocyte metabolism, cultured adult murine cardiomyocytes (AMCMs) were stimulated with 2nM insulin in the presence of various pharmacological agents and [3H]-2-deoxy-D-glucose (2DG) uptake was evaluated. Treatment of cells with LY294002 (50µM), an inhibitor of PI3K, completely blocked insulin-stimulated 2DG uptake (Figure 1). However, treatment of cells with SB202190 (10µM), a p38 mitogen-activated protein kinase inhibitor, did not affect 2DG uptake. Treatment of cells with PD98059 (50µM), a mitogen-activated protein kinase kinase 1/2 (also called MEK) inhibitor, modestly reduced 2DG uptake in response to insulin, but 2DG uptake was significantly stimulated in comparison to cells treated with PD98059 alone.
Figure 1.

The phosphatiylinsoitol-3’ kinase pathway is required for insulin-stimulated cardiomyocyte glucose uptake. Serum-deprived AMCMs from 8-week-old WT mice were treated with DMSO or with 2nM insulin in the presence of [3H]-2DG for 5 minutes. Some cultures were pre-treated with LY294002, an inhibitor of PI3K; SB202190, a p38 mitogen-activated protein kinase inhibitor; or PD98059, a MEK inhibitor. The mean fold 2DG uptake ± SE is graphed. 2DG uptake in parallel cultures pre-incubated with 10µM cytochalasin B was uniformly subtracted from experimental groups to control for non-specific 2DG transport. Four t-tests were performed with Bonferroni post-hoc correction (4 hypotheses) to compare: DMSO control vs. DMSO stimulated, LY294002 control vs. LY294002 stimulated, PD98059 control vs. PD98059 stimulated and SB202190 control vs. SB202190 stimulated. *, P < 0.05 versus unstimulated control.
Insulin-stimulated signal transduction and glucose transport was blocked in akt2−/− AMCMs
Although pharmacological studies supported the role of the PI3K-PDK1-Akt pathway in insulin-stimulated cardiomyocyte glucose uptake, they did not specify whether a specific Akt family member was required for this process. To address this issue, AMCMs derived from akt1−/− and akt2−/− mice were analyzed for insulin-stimulated signal transduction and glucose uptake.
Insulin-stimulated signaling via the canonical Akt pathway was impaired in akt1−/− and akt2−/− AMCMs incubated in 100nM insulin for 5 minutes. Phosphorylation of Akt1–3 (S473), glycogen synthase kinase 3β (GSK3β, S9), p70 S6 kinase (T389) and the S6 ribosomal subunit (S235/236) was detected in WT AMCMs, but this response was reduced in both akt1−/− and akt2−/− cultures (Figure 2A and Figure 3A).
Figure 2.

Akt1 is not required for normal cardiac glucose uptake. A. Analysis of the insulin-stimulated Akt signaling pathway in WT and akt1−/− AMCMs. Serum-deprived AMCMs were stimulated with vehicle or with 100nM insulin for 5 minutes. Lysates were analyzed by immunoblotting with primary antibodies that specifically recognize the phosphorylated forms of Akt1-3 (S473 of Akt1), TSC2 (T1462), GSK3β (S9), p70 S6K (T389) and S6 (S235/236). Total S6 was probed to control for protein loading. B. Preserved insulin-stimulated glucose uptake in akt1−/− AMCMs. Serum-deprived AMCMs from 8-week-old WT and akt1−/− mice were treated with vehicle or with 2 nM insulin in the presence of [3H]-2DG for 5 minutes. Mean 2DG uptake (cpm per µg protein) ± SE is graphed. 2DG uptake in parallel cultures pre-incubated with 10µM cytochalasin B was uniformly subtracted from experimental groups to control for non-specific 2DG transport. Two-tailed, two-sample t-tests were performed to compare: WT control vs. WT stimulated, akt1−/− control vs. akt1−/− stimulated, WT stimulated vs. akt1−/− stimulated. *, P < 0.05 versus congemc control group (t-test with Bonferroni post-hoc correction, 3 hypotheses) C. GLUT1 protein levels are increased in akt1−/− cardiomyocytes. Protein lysates from WT and akt1−/− AMCMs were analyzed by anti-GLUT1 immunoblotting. Blots were also probed for S6 levels to control for protein loading. Below each pair of bands is the mean normalized band density ± SE for each group. The number of animals analyzed (n) for each genotype are indicated. *, P < 0.05 versus mean WT GLUT1 band density (two-tailed, homoscedastic t-test).
Figure 3.


Akt2 is essential for normal cardiac glucose uptake. A. Analysis of the insulin-stimulated Akt signaling pathway in WT and akt2−/− AMCMs. Serum-deprived AMCMs were stimulated with vehicle or with 100nM insulin for 5 minutes. Lysates were analyzed by immunoblotting with antibodies that specifically recognize phosphorylated forms of Akt, GSK3β, p70 S6K and S6. Total ERK1/2 was probed to control for protein loading. B. Reduced insulin-stimulated glucose uptake in akt2−/− AMCMs. Serum-deprived AMCMs from 8-week-old WT and akt2−/− mice were treated with vehicle or with 2 nM insulin in the presence of [3H]-2DG for 5 minutes. The mean fold 2DG uptake ± SE is graphed. 2DG uptake in parallel cultures pre-incubated with 10µM cytochalasin B was uniformly subtracted from experimental groups to control for non-specific 2DG transport. The following two-tailed, two sample t-tests were performed with Bonferroni post-hoc correction (2 hypotheses): WT stimulated vs. WT control, WT stimulated vs. akt2−/− stimulated. *, P < 0.05 vs. WT control. ϕ, P < 0.05 vs. WT stimulated. C. Impaired insulin-stimulated glucose uptake in akt2 haplo-insufficient AMCMs. WT and akt2+/− AMCMs were serum deprived and stimulated with 2 nM insulin in the presence of [3H]-2DG for 5 minutes as described in (B). Graphed are the mean cpm per µg sample protein in each group ± SE for n = 3 cultures per condition. The following two-tailed, two sample t-tests were performed with Bonferroni post-hoc correction (2 hypotheses): WT stimulated vs. WT control, WT stimulated vs. akt2+/− stimulated. *, P < 0.05 vs. WT control. ϕ, P < 0.05 vs. WT stimulated. D. Decreased glucose oxidation in akt2−/− mouse hearts. Ex vivo working heart perfusion preparations from WT and akt2−/− mice were analyzed in the presence of 10 microunits/mL insulin and [14C]-glucose. Glucose oxidation was determined by measurement of [14C]-CO2 appearance in the perfusate. Graphed is the mean nmol/min/g dry heart weight ± SE for each genotype. ***, P < 0.001 versus WT cultures (two-tailed, homoscedastic t-test).
To determine whether reduced insulin signal transduction in AMCMs correlated with abnormal physiology, the ability of WT, Akt1-deficient, and Akt2-deficient AMCMs to transport glucose across the plasma membrane was examined. Insulin-stimulated cardiac glucose transport was measured in serum-deprived AMCMs stimulated with or without 2nM insulin (5 minutes) in the presence of 1µCi/mL [3H]-2-deoxy-D-glucose (2DG). 2DG uptake in response to insulin was not impaired in akt1−/− AMCMs when compared to WT AMCMs (Figure 2B). However, basal 2DG uptake was modestly elevated in akt1−/− AMCMs and this may be due to increased GLUT1 protein levels observed in these cells (Figure 2C).
In contrast to akt1−/− AMCMs, cardiomyocytes derived from akt2−/− mice displayed a marked defect in insulin-stimulated 2DG uptake (Figure 3B). Indeed, 2DG uptake in WT AMCMs was stimulated by 139% ± 37% in response to insulin (Figure 3B), but 2DG uptake in Akt2-deficient AMCMs increased by only 24% ± 8.9% after insulin treatment (P < 0.05 versus insulin-stimulated WT cultures). Basal 2DG uptake was normal in akt2−/− AMCMs, and this was associated with unchanged GLUT1 protein levels (Supplementary Figure 1). The glucose uptake defect in akt2−/− AMCMs was also observed in the presence of supraphysiologic concentrations of insulin (100nM) (Supplementary Figure 2).
AMCMs isolated from mice haplo-insufficient for akt2 also showed a statistically significant defect in insulin-stimulated 2DG uptake (Figure 3C), despite the fact that akt2+/− mice have normal total body glucose homeostasis (14).
To test whether the decreased transport of glucose into cultured akt2−/− cardiomyocytes was associated with decreased cardiac glucose oxidation, ex vivo working heart experiments were performed in the presence of insulin (30 microunits/mL) and radiolabeled glucose. Isolated working hearts from akt2−/− mice exhibited glucose oxidation rates that were reduced by 47.2% relative to WT littermate control hearts (Figure 3D, P < 0.001 versus WT control). Hemodynamic parameters, including heart rate, peak systolic pressure, cardiac output, coronary flow, cardiac work, stroke work and cardiac power were also measured during working heart mode and these were not statistically different in WT versus akt2−/− hearts (Supplementary Figure 3).
Akt2 deficiency results in enhanced palmitate uptake and oxidation
Akt negatively regulates mediators of fatty acid uptake and metabolism, including FOXO-1, a key transcription factor regulating the expression of fatty acid oxidation pathway genes (13). Phosphorylation of FOXO-1 by Akt at serine-256 reduces its transcriptional activity by promoting its exclusion from the nucleus. Insulin-stimulated phosphorylation of FOXO-1 was reduced in akt2−/− AMCMs when compared to WT AMCMs (Figure 4A).
Figure 4.


Reduced cardiac FOXO-1 phosphorylation is associated with enhanced cardiac palmitate uptake in Akt2-deficient mice. (A). Densitometric immunoblot quantification of FOXO-1(S256) phosphorylation in WT and akt2−/− AMCMs treated with 100nM insulin for 15 minutes. The membrane was stripped and reprobed for actin to control for protein loading. B. [3H]-palmitate uptake in WT and akt2−/− AMCMs pretreated overnight with 100nM insulin. Graphed are the mean cpm/µg protein ± SE for each genotype. **, P < 0.01 versus WT (two-tailed, homoscedastic t-test).C. Palmitate oxidation in WT and akt2−/− mice subjected to ex vivo working heart perfusion studies. The mean nmol radiolabeled 3H20 liberated per g dry heart weight ± SE is graphed. The number of animals analyzed in each group (n) is indicated. *, P < 0.05 versus WT (two-tailed, homoscedastic t-test).
To examine whether reduced FOXO-1 phosphorylation was associated with enhanced fatty acid uptake, palmitate uptake assays were performed. Serum-starved WT and akt2−/− AMCMs were pulsed with [3H]-palmitate in the presence of chronic (20hr) 100nM insulin stimulation. Palmitate uptake was increased by 26% ± 8.0% in akt2−/− AMCMs when compared to WT cultures (Figure 4B, P < 0.01 versus WT).
To determine whether akt2−/− mice exhibited increased cardiac fatty acid oxidation, ex vivo working heart studies were performed. [3H]-palmitate oxidation was enhanced by 58.6% in Akt2-deficient mouse hearts when compared to WT controls (Figure 4C, P = 0.013 versus WT).
Normal ligand-induced growth in akt2−/− cardiomyocytes
Cardiac-specific overexpression of mutant forms of Akt1 or Akt3 promotes cardiac hypertrophy that may progress to congestive heart failure (4–6). Because the kinase domains of Akt1 and Akt3 are greater than 80% homologous to the Akt2 kinase domain, we examined the possibility that Akt2 is also involved in cardiac growth.
The growth hormone-insulin-like growth factor-1 (GH-IGF-1) axis is hypothesized to play a critical role in physiologic cardiac hypertrophy secondary to exercise training (23, 24), and IGF-1 treatment of cultured cardiomyocytes is an in vitro model of physiologic cardiac hypertrophy. IGF-1-stimulated signaling was evaluated in WT and akt2−/− AMCMs. Treatment of WT AMCMs with 10nM IGF-1 resulted in the phosphorylation of p70 S6K, GSK3β, and S6 that was blocked in akt2−/− AMCMs (Figure 5A and 5B).
Figure 5.

IGF-1-induced growth is preserved in akt2−/− AMCMs. A. Analysis of the IGF-1-stimulated Akt signaling pathway in AMCMs. Immunoblot analysis of lysates derived from serum-deprived WT or akt2−/− AMCMs treated with or without 10nm IGF-1 for 10 minutes. Blots were probed with primary antibodies that specifically recognize the phosphorlyated forms of p70 S6K, GSK3β and S6 ribosomal subunit. Total ERK1/2 was probed as a loading control. B. Densitometric quantification of scanned immunoblots shown in (A). *, P < 0.05 versus congenic control littermates. ϕ, P < 0.05 versus IGF-1-treated WT mice (two-tailed, homoscedastic t-test). C. Analysis of leucine incorporation in IGF-1-stimulated AMCMs. Serum-deprived WT and akt2−/− AMCMs were incubated with 1 µCi/mL radiolabeled [3H]-leucine in the presence or absence of 10 nM IGF-1 for 16hr. The mean TCA-precipitable counts per µg sample protein ± SE are shown. Data are representative of two experiments with n = 3 independent cultures per treatment condition for each experiment. The following two-tailed, homoscedastic t-tests were performed with Bonferroni post-hoc correction (3 hypotheses): WT stimulated vs. WT control, akt2−/− stimulated vs. akt2−/− control, akt2−/− stimulated vs. WT stimulated. *, P < 0.05 versus congenic control.
To assess the ability of Akt2-deficient AMCMs to undergo physiologic hypertrophy, serum-deprived adult murine cardiomyocytes (AMCMs) from 8-week-old WT and akt2−/− mice were incubated with [3H]-leucine for 16 hours in the presence or absence of 10nM IGF-1 (Figure 5C). IGF-1-stimulated WT AMCMs incorporated leucine at a rate that was 20% ± 6% greater than that in untreated WT cultures (Figure 5C, P < 0.05). IGF-1-stimulated akt2−/− AMCMs incorporated leucine to a similar extent (+23% ± 4%) when compared with untreated WT cultures (P < 0.01). Moreover, no difference in leucine incorporation was observed between IGF-1-stimulated WT and IGF-1-stimulated akt2−/− AMCMs.
Normal ET1-induced protein synthesis in akt2−/− cardiac myocytes
The normal hypertrophic response of akt2−/− AMCMs to IGF-1 stimulation does not exclude the possibility that Akt2 differentially regulates pathologic hypertrophic signaling. Treatment of cultured cardiomyocytes with endothelin-1 (ET1)—a G protein-coupled receptor agonist—is an in vitro model of pathologic cardiac hypertrophy. ET1-stimulated signal transduction was evaluated in WT and akt2−/− AMCMs. Treatment of WT AMCMs with 200nM ET1 resulted in the phosphorylation of p70 S6K, GSK3β, and S6 that was reduced in akt2−/− AMCMs (Figure 6A and 6B). ERK activation in response to ET1 treatment was similar in both WT and akt2−/− AMCMs (Figure 6A and 6B).
Figure 6.


ET1-stimulated growth is normal in akt2−/− AMCMs. A. Analysis of ET1-stimulated Akt pathway signaling in AMCMs. AMCM lysates from serum-deprived WT and akt2−/− cultures incubated in the presence or absence of 200nM ET1 were analyzed by phospho-specific p70 S6K, GSK3β and S6 immunoblotting. Total ERK1/2 was probed as a loading control. B. Quantification of immunoblots shown in (A). *, P < 0.05 vs. WT control. ϕ, P < 0.05 versus WT stimulated (t-test with Bonferroni post-hoc correction, 2 hypotheses). C. Analysis of leucine incorporation in AMCMs. Serum-deprived, cultured WT and akt2−/− AMCMs were incubated with radiolabeled [3H]-leucine in the presence or absence of 200nM ET1 for 16hr. Mean TCA-precipitable counts/µg protein ± SE are graphed. Data are representative of two experiments, n = 3 independent cultures per treatment condition. The following t-tests were performed with Bonferroni post-hoc correction (3 hypotheses): WT stimulated vs. WT control, akt2−/− stimulated vs. akt2−/− control, akt2−/− stimulated vs. WT stimulated. *, P < 0.05 vs. congenic control.
To assess the ability of Akt2-deficient AMCMs to undergo pathologic hypertrophy, serum-deprived AMCMs from 8wk-old WT and akt2−/− mice were incubated with [3H]-leucine with or without 200nM ET1 for 16h (Figure 6C). ET1-stimulated WT AMCMs incorporated 31% ± 3% more leucine than untreated WT cultures (Figure 6C, P < 0.05). ET1 treated akt2−/− AMCMs incorporated leucine to a similar extent (+37% ± 10%) when compared with untreated akt2−/− AMCMs (P < 0.05). No difference in leucine incorporation was demonstrated between ET1 stimulated WT and akt2−/− cultures (P = 0.416, two-tailed t-test).
Normal TAC-induced cardiac hypertrophic response in akt2−/− mice
To test the role of Akt2 in cardiomyocyte growth in an in vivo model of pathologic cardiac hypertrophy, WT and akt2−/− mice were subjected to pressure overload by transverse aortic constriction (TAC). Baseline evaluation of 8-week-old akt2−/− mice by transthoracic echocardiography revealed that heart rate, left ventricular (LV) dimensions, and LV fractional shortening were all normal when compared to WT mice (Supplementary Figure 4).
TAC was performed on WT and akt2−/− mice, and the pressure gradient achieved was nearly identical in both groups, as determined by Doppler echocardiography (Figure 7A). The echocardiographically-determined LV mass index (LVMI) increased to a similar extent in WT and akt2−/− mice 7 days after TAC. Indeed, the LVMI increased from 3.10 ± 0.34 to 3.71 ± 0.62 in WT mice, and the LVMI increased from 3.07 ± 0.18 to 3.79 ± 0.44 in akt2−/− mice (Figure 7A).
Figure 7.


Akt2-deficient mice develop cardiac hypertrophy in response to pressure overload by TAC. A. Echocardiographic Analysis of Mice after TAC or Sham Operation. 8-week-old mice underwent transthoracic echocardiography 7 days after TAC or sham operation. HR, heart rate; LVPWd, left ventricular posterior wall thickness in diastole; IVSd, intraventricular septal thickness in diastole; LVIDd, left ventricular internal dimension in diastole; LVMI, left ventricular mass index; LVIDs, left ventricular internal dimension in systole; FS, fractional shortening; Doppler velocity measured at site of transverse aortic constriction; *, P < 0.05 versus WT mice after sham operation. B. Morphometric analysis of dissected LVs from WT and akt2−/− mice obtained 7 days after TAC or sham operation. Graphed are the mean LV weight-to-body weight ratios for each group. Numbers of mice analyzed in each group (n) are indicated below each bar. C. High-powered photomicrographic analysis of myocyte cross-sectional area in hematoxylin & eosin-stained transverse cardiac sections obtained from mice analyzed in (B). D. Computerized cardiomyocyte cross-sectional area quantification in heart sections obtained from WT and akt2−/− mice subjected to sham or TAC operation. Graphed is the mean cardiomyocyte cross-sectional area ± SE. Quantifications represent cardiomyocyte tracings of all cells in 3–5 distinct, random high-powered fields per animal, obtained from 3–5 different animals in each treatment group.
Morphometric analysis further demonstrated that TAC induced a similar degree of cardiac hypertrophy as measured by the left ventricular weight-to-body weight ratio (LV/BW) in WT and akt2−/− mice (Figure 7B). No statistical differences in LV/BW were detected in TAC-operated WT (LV/BW = 4.32 ± 0.3) versus TAC-operated akt2−/− mice (LV/BW = 4.19 ± 0.48). However, the mean baseline LV/BW was modestly greater in akt2−/− mice (Figure 7B).
Computerized photomicrography of H&E-stained transverse cardiac sections demonstrated that the cardiomyocyte cross-sectional area increased to a similar extent in WT and akt2−/− mice 7 days after TAC (Figure 7C and 7D).
Although akt2−/− mice exhibited an intact hypertrophic response to pressure overload by TAC, this was not due to a compensatory increase in Akt1 protein levels (Supplementary Figure 5).
Enhanced apoptosis in the peri-infarct zone of akt2−/− heart
Experimental myocardial infarction (MI) by occlusion of the left coronary artery is also associated with pathological cardiac remodeling. In this model of myocardial infarction, an initial infarction stage occurs that is characterized mainly by necrotic cell death in the tissue directly supplied by the occluded coronary artery. A subsequent, often maladaptive phase of ventricular remodeling occurs in the days and weeks following MI surgery. Hallmarks of this chronic phase include persistent cardiomyocyte apoptosis, fibrosis, thinning of the ventricular wall at the infarct site, chamber dilatation and cardiomyocyte hypertrophy in the uninvolved myocardium (19).
To determine whether Akt2 is an important component of this remodeling process, akt2−/− and WT mice were subjected to permanent ligation of the left coronary artery. Morphometric evaluation of mice 7 days after MI surgery revealed that cardiac hypertrophy, as measured by LV/BW, increased to a similar extent in WT and akt2−/− mice (Figure 8A). Beta-myosin heavy chain (βMHC) and atrial natriuretic factor (ANF) gene expression were subsequently measured by real-time quantitative RT-PCR as markers of LV stress. MI induced βMHC to a similar extent in both WT (6.5-fold ± 1.4-fold) and in akt2−/− mice (7.5-fold ± 3.0-fold, Supplementary Figure 6A). MI also induced ANF in both WT (10.4-fold ± 2.1-fold) and akt2−/− mice (22.9-fold ± 4.3-fold). ANF induction was significantly greater in MI-operated akt2−/− mice (P = 0.028), consistent with enhanced myocardial stress in Akt2-deficient hearts (Supplementary Figure 6B). Furthermore, a modest—but statistically significant—increase in cardiomyocyte area in unaffected myocardium was observed in akt2−/− mice when compared to WT mice 7 days after MI (Figure 8B and 8C).
Figure 8.
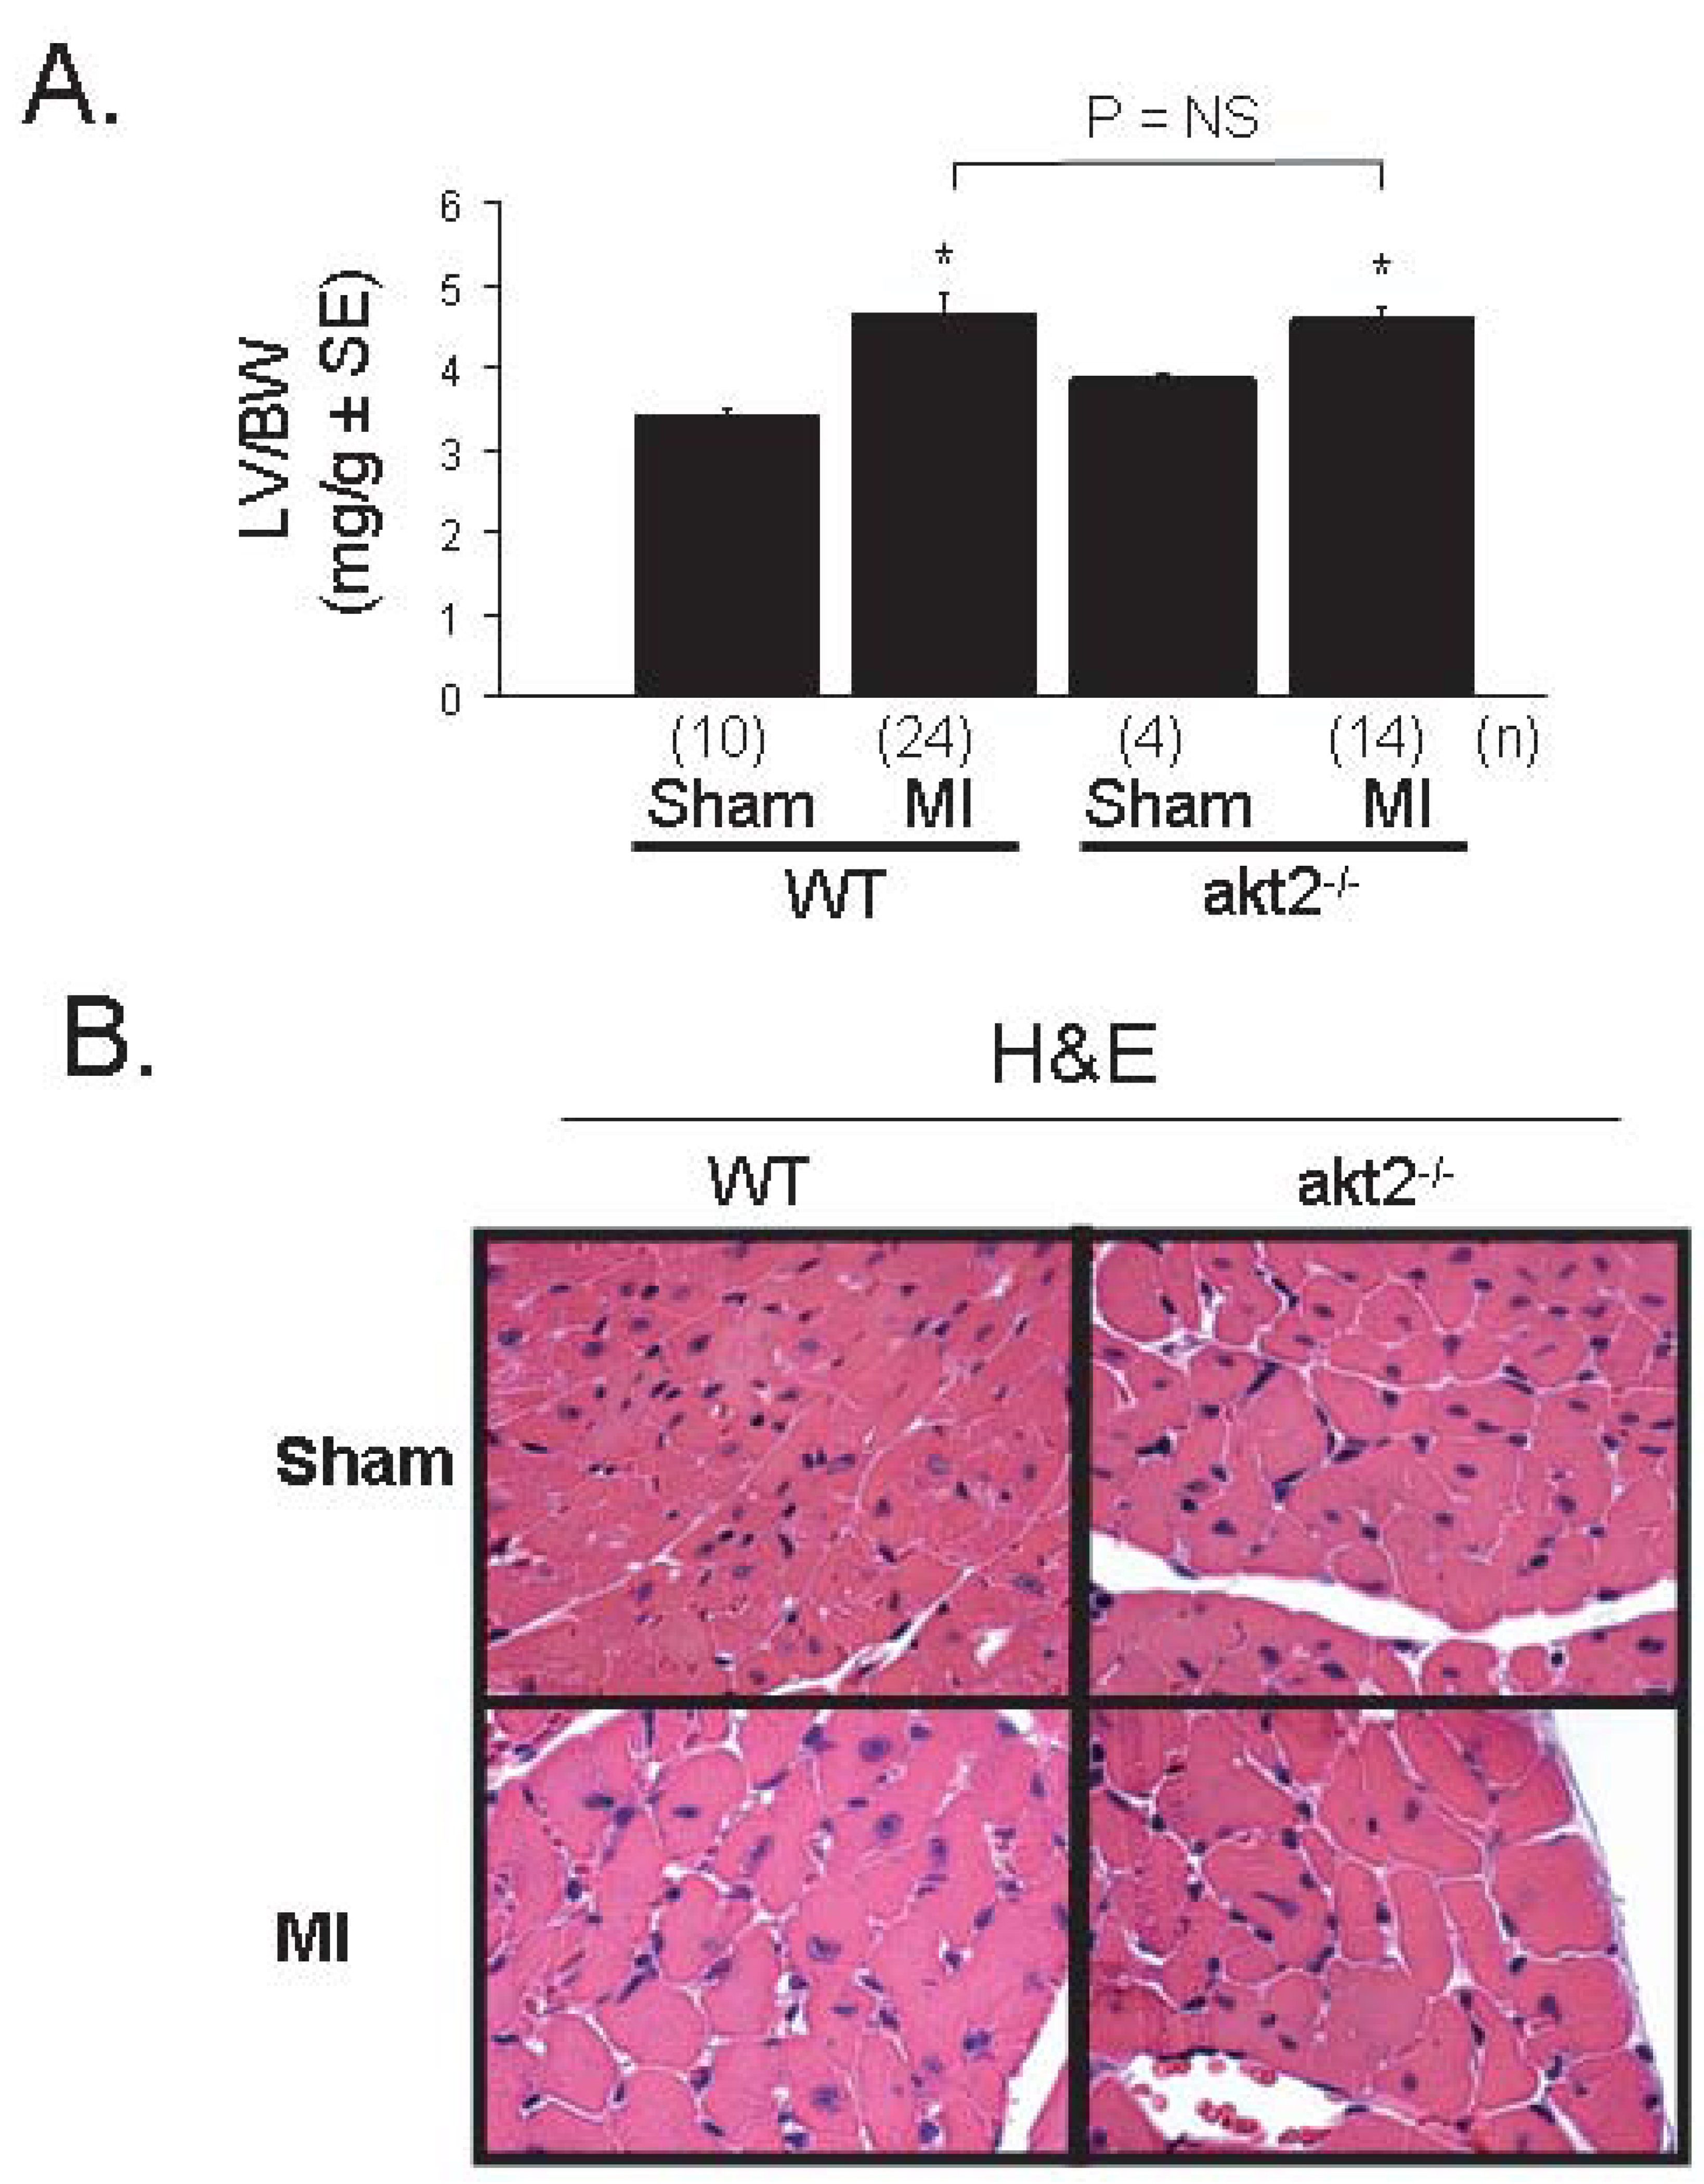


Cardiac hypertrophy is normal—but cardiomyocyte apoptosis is increased—after myocardial infarction in akt2−/− mice. A. Morphometric analysis of dissected LVs from WT and akt2−/− mice obtained 7 days after MI or sham operation. Graphed are the mean LV weight-to-body weight ratios for each group. Numbers of mice analyzed in each group (n) are indicated below each bar. The following t-tests were performed with Bonferroni post-hoc correction (3 hypotheses): WT sham versus WT MI, akt2−/− sham vs. akt2−/− MI, WT MI vs. akt2−/− MI. *, P < 0.05 versus congenic control. B. High-powered photomicrographic analysis of myocyte cross-sectional area in hematoxylin & eosin-stained transverse sections of ventricular myocardium distant from the infarct zone obtained from WT and akt2−/− mice subjected to MI or sham operation 7 days earlier. C. Computerized cardiomyocyte cross-sectional area quantification in heart sections described in (B). Graphed are the mean cardiomyocyte cross-sectional areas ± SE. Quantifications represent cardiomyocyte tracings of all cells in 3–5 distinct, random high-powered fields per animal, obtained from 3–5 different animals in each treatment group. D. Low-power photomicrographic analysis of cardiomyocyte apoptosis by TUNEL in the peri-infarct zone (defined as the one-quarter circumference of the LV on either side of the infarct) of ventricular tissue sections from WT and akt2−/− mice obtained 7 days after MI or sham operation. Arrows indicate TUNEL-positive staining. E. Quantification of TUNEL positivity in photomicrographs represented in (D). Graphed is the mean TUNEL-positive nuclei observed in each high-power field per 105 nuclei). The following t-tests were performed with Bonferroni post-hoc correction (2 hypotheses): WT sham versus akt2−/− sham; WT MI vs. akt2−/− MI. F. Representative photomicrographs of Masson’s trichrome-stained transverse LV sections derived from WT and akt2−/− mice 7 days after left coronary artery ligation. G. Quantitative analysis of infarct areas from photomicrographs represented in (F). % infarct area was calculated as (trichrome positive area) / (total LV tissue area). The numbers of mice analyzed in each group (n) are shown below each bar. 3–6 distinct LV sections were scored per animal. Graphed is the mean % infarct area ± SE observed in each animal. H. Enhanced apoptosis in akt2−/− AMCMs subjected to oxidative stress. Serum-deprived WT and akt2−/− AMCMs were incubated in the presence or absence of 25µM H2O2 for 16hrs and apoptosis was colorimetrically evaluated by the Cell Death Detection Apoptosis ELISA Assay kit (Roche Biochemicals) according to manufacturer specifications. Graphed is the mean optical density at 405nm (OD405) normalized to sample protein concentration (OD595) determined by the Bradford Reagent method ± SE, expressed as fold over control. The number of samples evaluated (n) under each treatment condition is displayed below each bar. P < 0.005 in H2O2-treated WT versus H2O2-treated akt2−/− AMCMs.
The observation that ANF and cardiomyocyte area increased out of proportion to LV/BW in akt2−/− mice after MI surgery may be explained by an increased rate of apoptosis. Previous work suggested that Akt proteins play an important anti-apoptotic function in many cell types (25, 26). Cardiomyocyte apoptosis was evaluated by TUNEL in the uninfarcted region of akt2−/− and WT myocardium 7 days after MI surgery. TUNEL positivity was significantly increased in akt2−/− mice when compared to that in WT mice (Figure 8D and 8E). The segmental wall motion score index (SWMSI) was measured by echocardiographic analysis of mice 1 day post-MI to assess left ventricular wall movement during the acute stages of LV remodeling (Supplementary Figure 7) (19). The SWMSI was identical in MI-operated WT (0.34 ± 0.03) and akt2−/− (0.36 ± 0.05, P = 0.70) mice (0 is defined as normal wall motion and 1 is defined as akinesis). Therefore, the initial infarct region was similar in both WT and akt2−/− mice, and the increase in apoptosis in Akt2-deficient myocardium was not a result of more aggressive surgical intervention.
Despite comparable initial infarct sizes, a significantly larger infarct region was observed in akt2−/− mice 7 days after MI, as assessed by histological examination of transverse WT and akt2−/− cardiac sections stained with Masson’s trichrome (Figure 8F and 8G). In addition, echocardiographic evaluation showed LV chamber dilatation and reduced contractile function in akt2−/− mice 7 days after MI (Supplementary Figure 7).
The enhanced apoptotic phenotype in the akt2−/− heart was recapitulated in an in vitro model of oxidative-stress-induced apoptosis. Serum-deprived akt2−/− AMCMs incubated in the presence of 25µM H2O2 for 16 hours exhibited greater apoptotic activity when compared to similarly treated WT AMCMs (Figure 8H, P < 0.005), as assessed by an ELISA that measures histone-complexed DNA fragmentation.
DISCUSSION
Akt proteins regulate cell metabolism, growth and survival, and individual family members may have distinct biological functions. We previously demonstrated that Akt1 is required for the physiologic growth of the heart, and that Akt1 antagonizes pathological cardiac hypertrophy (27). In this work we demonstrate that Akt2 - but not Akt1 - is required for insulin-stimulated glucose uptake, and that Akt2 plays an anti-apoptotic role in heart, but that Akt2 does not significantly regulate physiological or pathological cardiac growth. The results described in this manuscript are similar to the gross physiological analysis of both akt2−/− mouse model systems currently in the literature (14, 28). Both Akt2-deficient mouse model systems exhibit global insulin resistance. Cho, et al, report no discernible differences in body or organ size (14). However, the akt2−/− mice generated by Garofalo and co-workers exhibited mild deficiencies in body weight and body length, lipoatrophy and modestly decreased kidney, spleen and thymus organ weight-to-body weight ratios (28).
Akt family members phosphorylate a variety of intracellular targets, including transcription factors, protein kinases, and translational factors. Our analysis of well-known Akt effectors—including GSK3β and S6—revealed that activation of these proteins was reduced in akt2−/− AMCMs, but that IGF1- and ET1-induced cell growth was normal. Therefore, these signaling intermediaries are not required for cardiomyocyte growth in response to these ligands. Recent work by McMullen and co-workers demonstrated that S6K1 and S6K2 are sufficient, but are not necessary, to induce cardiac hypertrophy (29). Moreover, GSK3β phosphorylation by itself does not appear to be required for cardiac growth. Clearly, genetic murine models expressing a nonphosphorylatable form of GSK3β would help to elucidate the role of GSK3β in cardiac growth and metabolism. It is unclear at this time what downstream signaling molecules are required for ligand-induced growth in akt2−/− AMCMs, and it is possible that activation of calcineurin or the MAPKs may promote protein translation independent of GSK3β and S6 phosphorylation.
Our findings show that Akt2 – but not Akt1 – regulates insulin-stimulated glucose uptake in AMCMs downstream of the PI-3-kinases. However, insulin treatment activates both Akt family members in cardiomyocytes. Indeed, Figure 3A shows that insulin treatment of akt2−/− AMCMs results in the phosphorylation and activation of Akt1. This implies that Akt2 has unique substrates that are not phosphorylated by Akt1 in the regulation of GLUT4 translocation to the plasma membrane. Recently, Akt2 was shown to phosphorylate and inactivate the intracellular protein Synip, an inhibitor of GLUT4 vesicular docking with the plasma membrane (30). Akt1 was unable to phosphorylate Synip in vitro. Experiments are currently ongoing to determine whether Synip phosphorylation is blocked in insulin-stimulated akt2−/− AMCMs. Other unique substrates of Akt2 may be involved in GLUT4 vesicular translocation, docking and fusion with the plasma membrane.
The current analysis of akt2−/− mice is limited by the possibility that defects in cardiac insulin action are due to a generalized tissue insulin resistance secondary to whole-body hyperinsulinemia and not due to the specific absence of Akt2 in cardiomyocytes (14, 28). However, work by Cho indicates that soleus muscle insulin responsiveness—measured by 2DG uptake—is normalized at high doses (13.33nM) of insulin stimulation (14). The impaired insulin-stimulated AMCM glucose uptake in response to supraphysiologic insulin concentrations (100nM insulin) suggests that the observed phenotype is due to an absolute, primary insulin signal transduction defect in the myocardium. This hypothesis is further supported by the fact that akt2 haplo-insufficient AMCMs—derived from mice that maintain euglycemia, normal insulin levels and peripheral insulin-sensitivity throughout their lifespan—exhibited impaired glucose uptake.
Another potential limitation of the current study is in the specific interpretation of the in vivo cardiomyocyte apoptosis data. Despite nearly identical acute infarct sizes, MI-operated Akt2-deficient mice developed pathological cardiac remodeling to a much greater extent than WT mice. We suspect that akt2−/− cardiomyocytes are uniquely sensitized to develop apoptosis in the infarct border zone, leading to enhanced infarct extension and exaggerated pathological remodeling in the days following MI. This model is supported by in vitro data suggesting that akt2−/− cardiomyocytes are intrinsically sensitized to oxidative stress-induced apoptosis in the absence of extrinsic hemodynamic, mechanical or humoral factors (Figure 8H). Given the current data, however, we cannot exclude the possibility that the larger infarct size in akt2−/− mice at 7 days is not a direct consequence of increased apoptosis, but instead is due to some other unidentified factor, and that this increased infarct size results in greater mechanical stress on the surviving myocytes, stimulating apoptosis at 7 days.
One clinical implication of these findings is that Akt2 may be a promising therapeutic target in the treatment of glucose metabolic cardiac disorders such as diabetic cardiomyopathy. Current mouse models of chronic cardiac Akt1 or Akt3 hyperactivation suggest that pathological heart growth exists as a possible side-effect of chronic, non-specific Akt family hyperactivation. However, the current study suggests that Akt2 does not regulate post-developmental cardiac growth in response to a variety of physiologic and pathological stimuli. Furthermore, the sensitization of akt2−/− mice to the development of cardiomyocyte apoptosis after myocardial infarction indicates that cardiac Akt2 activity promotes cardiomyocytes survival. Therefore, Akt2-specific activation in the heart is likely to correct the metabolic derangements in DCM without detrimentally affecting heart function. The global actions of Akt2 in regulating both glucose and fatty acid utilization in the heart therefore define Akt2 as a candidate for specific therapeutic intervention.
Supplementary Material
Supplementary Figure 1. A. Cardiac GLUT1 expression in akt2−/− mice. AMCMs from 8-week-old WT and akt2−/− mice were lysed and immunoblotted for total GLUT1 abundance. Above each pair of bands is the mean band density ± SE as determined by ImageJ densitometric software analysis.
Supplementary Figure 2. Impaired high-dose insulin-stimulated 2DG uptake in akt2−/− mice. Serum-deprived AMCMs were stimulated with or without supraphysiologic-dose insulin (100nM) in the presence of [3H]-2DG. Mean 2DG uptake ± SE is graphed for each group. Counts transported in parallel cultures pre-incubated with 10µM cytochalasin B were uniformly subtracted as background counts from all experimental groups. *, P &< 0.05 versus unstimulated WT cultures. ϕ, P < 0.05 versus insulin-stimulated WT cultures (Two-tailed t-test with Bonferonni post-hoc correction, 2 hypotheses).
Supplementary Figure 3. Hemodynamic measurements of WT and akt2−/− hearts during working heart mode performed as described in Experimental Procedures. Graphed are mean values for n = 9 WT and n = 8 akt2−/− hearts ± SE. The F-statistic and P-values are shown for each comparison. Two-tailed, homoscedastic t-tests were performed to statistically compare WT vs. akt2−/− heart rate, peak systolic pressure, cardiac output, coronary flow, cardiac work, stroke work and cardiac power.
Supplementary Figure 4. Baseline cardiac structure and function in akt2−/− mice determined by echocardiography. 8-week-old mice underwent transthoracic echocardiography. HR, heart rate; LVPWd, left ventricular posterior wall thickness in diastole; IVSd, intraventricular septal thickness in diastole; LVIDd, left ventricular internal dimension in diastole; LVPWs, left ventricular posterior wall thickness in systole; IVSs, intraventricular septal thickness in systole; LVIDs, left ventricular internal dimension in systole; LVMI, left ventricular mass index; FS, fractional shortening. Mean values ± SE are shown.
Supplementary Figure 5. Baseline cardiac Akt1 and Akt2 protein levels in akt2−/− mice. WT and akt2−/− AMCMs were subjected to immunoblot analysis with Akt2-specific antiserum. Membranes were then stripped and reprobed with Akt1-specific antiserum.
Supplementary Figure 6. Real-time quantitative RT-PCR analysis of cardiac fetal gene expression in WT and akt2−/− mice after sham or MI operation. Beta-myosin heavy chain expression (A) and atrial natriuretic factor (B) expression normalized to GAPDH expression are graphed as fold control ± SE. *, P < 0.05 versus sham-operated congenic control cohort (two-tailed, homoscedastic t-test with Bonferroni post-hoc correction, 3 hypotheses).
Supplementary Figure 7. Echocardiographic evaluation of wild type and akt2 −/− mice after experimental myocardial infraction. Anesthetized and intubated 8 week-old mice were subjected to MI by ligation of the left coronary artery. Mice were analyzed by transthoracic echocardiography 1 day and 7 days after ligation of the left coronary artery. SWMSI, segmental wall motion score index (a value of 0 in SWMSI indicates normal wall motion, whereas a SWMSI score of 1 indicates cardiac akinesis). EDV, end-diastolic volume (mm3); ESV, end-systolic volume (mm3); EF, ejection fraction.
The abbreviations used are
- 2DG
2-deoxy-D-glucose
- AMCM
adult mouse cardiomyocyte
- AMPK
AMP-activated protein kinase
- BDM
butanedione monoxime
- ET1
endothelin-1
- GSK3β
glycogen synthase kinase 3β
- IGF-1
insulin-like growth factor-1
- KHB
Krebs-Hensleit Bicarbonate
- LV
left ventricle
- p70 S6K
p70 S6 kinase
- PPARα
peroxisomal-proliferator activated receptor α
- synip
syntaxin-4 interacting partner
- TAC
transverse aortic constriction
- TUNEL
terminal deoxynucleotidyltransferase (TdT) nickel-end labeling assay.
Footnotes
This work was supported by grants from the National Institutes of Health (This work was supported by grants from the NIH (HL61567, HL057278, HL076670) and the Burroughs Wellcome Fund (A.J. Muslin). B.J. DeBosch was supported by the Cardiovascular Physiology Training Grant T32-HL07873. The authors acknowledge the assistance of the Washington University Digestive Diseases Research Core Center (NIH P30 DK52574). The akt2−/− mice used throughout these studies were a kind gift from Morris Birnbaum, Howard Hughes Medical Institute, University of Pennsylvania School of Medicine.
REFERENCES
- 1.Dorn GW, Force T. J. Clin. Invest. 2005;115:527–537. doi: 10.1172/JCI24178. [DOI] [PMC free article] [PubMed] [Google Scholar]
- 2.Matsui T, Rosenzweig A. J. Mol. Cell. Cardiol. 2005;38:63–71. doi: 10.1016/j.yjmcc.2004.11.005. [DOI] [PubMed] [Google Scholar]
- 3.Abel ED. Curr. Hypertens. Rep. 2004;6:416–423. doi: 10.1007/s11906-004-0034-4. [DOI] [PubMed] [Google Scholar]
- 4.Matsui T, Li L, Wu JC, Cook SA, Nagoshi T, Picard MH, Liao R, Rosenzweig A. J. Biol. Chem. 2002;277:22896–22901. doi: 10.1074/jbc.M200347200. [DOI] [PubMed] [Google Scholar]
- 5.Shioi T, McMullen JR, Kang PM, Douglas PS, Obata T, Franke TF, Cantley LC, Izumo S. Mol. Cell. Biol. 2002;22:2799–2809. doi: 10.1128/MCB.22.8.2799-2809.2002. [DOI] [PMC free article] [PubMed] [Google Scholar]
- 6.Taniyama Y, Ito M, Sato K, Kuester C, Veit K, Tremp G, Liao R, Colucci WS, Ivashchenko Y, Walsh K, Shiojima L. J. Biol. Chem. 2005;38:375–385. doi: 10.1016/j.yjmcc.2004.12.002. [DOI] [PubMed] [Google Scholar]
- 7.McMullen JR, Shioi T, Zhang L, Tarnavski O, Sherwood MC, Kang PM, Izumo S. Proc Natl Acad Sci USA. 2003;100:12355–12360. doi: 10.1073/pnas.1934654100. [DOI] [PMC free article] [PubMed] [Google Scholar]
- 8.Rota M, Boni A, Urbanek K, Padin-Iruegas E, Kajstura TJ, Fiore G, Kubo H, Sonnenblick EH, Musso E, Houser SR, Leri A, Sussman MA, Anversa P. Circ. Res. 2005;97:1332–1341. doi: 10.1161/01.RES.0000196568.11624.ae. [DOI] [PubMed] [Google Scholar]
- 9.Somwar R, Niu W, Kim DY, Sweeney G, Randhawa VK, Huang C, Ramlal T, Klip A. J. Biol. Chem. 2001;276:46079–46087. doi: 10.1074/jbc.M109093200. [DOI] [PubMed] [Google Scholar]
- 10.Yamada E, Okada S, Saito T, Ohshima K, Sato M, Tsuchiya T, Uehara Y, Shimizu H, Mori M. J. Cell. Biol. 2005;168:921–928. doi: 10.1083/jcb.200408182. [DOI] [PMC free article] [PubMed] [Google Scholar]
- 11.Cross DA, Alessi DR, Cohen P, Andjelkovich M, Hemmings BA. Nature. 1995;378:785–789. doi: 10.1038/378785a0. [DOI] [PubMed] [Google Scholar]
- 12.Kovacic S, Soltys CL, Barr AJ, Shiojima I, Walsh K, Dyck JR. J. Biol. Chem. 2003;278:39422–29427. doi: 10.1074/jbc.M305371200. [DOI] [PubMed] [Google Scholar]
- 13.Southgate RJ, Bruce CR, Carey AL, Ateinberg GR, Walder K, Monks R, Watt MJ, Hawley JA, Birnbaum MJ, Febbraio MJ. FASEB J. 2005;19:2072–2074. doi: 10.1096/fj.05-3993fje. [DOI] [PubMed] [Google Scholar]
- 14.Cho H, Mu J, Kim JK, Thorvaldsen JL, Chu Q, Crenshaw EB, Kaestner KH, Bartolomei MS, Shulman GI, Birnbaum MJ. Science. 2001;292:1728–1731. doi: 10.1126/science.292.5522.1728. [DOI] [PubMed] [Google Scholar]
- 15.Cho H, Thorvaldsen JL, Chu Q, Feng F, Birnbaum MJ. J. Biol. Chem. 2001;276:38349–38352. doi: 10.1074/jbc.C100462200. [DOI] [PubMed] [Google Scholar]
- 16.Sambrano GR, Fraser I, Han H, Ni Y, O’Connel T, Yan Z, Stull JT. Nature. 2002;420:712–714. doi: 10.1038/nature01306. [DOI] [PubMed] [Google Scholar]
- 17.Belke DD, Larsen TS, Lopaschuk GD, Severson DL. Am. J. Physiol. 1999;277:R1210–R1217. doi: 10.1152/ajpregu.1999.277.4.R1210. [DOI] [PubMed] [Google Scholar]
- 18.Harris IS, Zhang S, Treskov I, Kovacs I, Weinheimer C, Muslin AJ. Circulation. 2004;110:718–723. doi: 10.1161/01.CIR.0000138190.50127.6A. [DOI] [PubMed] [Google Scholar]
- 19.Ren J, Zhang S, Kovacs A, Wang Y, Muslin AJ. J. Mol. Cell. Cardiol. 2005;38:617–623. doi: 10.1016/j.yjmcc.2005.01.012. [DOI] [PubMed] [Google Scholar]
- 20.Kanno S, Lerner DL, Schuessler RB, Betsuyaku T, Yamada KA, Saffitz JE, Kovacs A. J Am Soc Echocardiogr. 2002;15:601–609. doi: 10.1067/mje.2002.117560. [DOI] [PubMed] [Google Scholar]
- 21.Cheatham B. Trends Endocrinol. Metab. 2000;11:356–361. doi: 10.1016/s1043-2760(00)00308-8. [DOI] [PubMed] [Google Scholar]
- 22.Mora A, Sakamoto K, McManus EJ, Alessi DR. FEBS Lett. 2005;579:3632–36238. doi: 10.1016/j.febslet.2005.05.040. [DOI] [PubMed] [Google Scholar]
- 23.Colao A, Vitale G, Pivonello R, Ciccarelli A, Di Somma C, Lombardi G. Eur. J. Endocrinol. 2004;151:S93–S101. doi: 10.1530/eje.0.151s093. [DOI] [PubMed] [Google Scholar]
- 24.Neri Serneri GG, Boddi M, Modesti PA, Cecioni I, Coppo M, Padeletti L, Michelucci A, Colella A, Galanti G. Circ. Res. 2001;89:977–982. doi: 10.1161/hh2301.100982. [DOI] [PubMed] [Google Scholar]
- 25.Matsui T, Li L, del Monte F, Fukui Y, Franke TF, Hajjar RJ, Rosenzweig A. Circulation. 1999;100:2373–2379. doi: 10.1161/01.cir.100.23.2373. [DOI] [PubMed] [Google Scholar]
- 26.Fujiko Y, Nguyen T, Wencker D, Kitsis RN, Walsh K. Circulation. 2000;101:660–667. doi: 10.1161/01.cir.101.6.660. [DOI] [PMC free article] [PubMed] [Google Scholar]
- 27.DeBosch B, Lupu TS, Weinheimer C, Kovacs A, Muslin AJ. Circulation. 2006;113:2097–2104. doi: 10.1161/CIRCULATIONAHA.105.595231. [DOI] [PubMed] [Google Scholar]
- 28.Garofalo RS, Orena SJ, Rafidi K, Torchia AJ, Stock JL, Hildebrandt AL, Coskran T, Black SC, Brees DJ, Wicks JR, McNeish JD, Coleman KG. J. Clin. Invest. 2003;112:197–208. doi: 10.1172/JCI16885. [DOI] [PMC free article] [PubMed] [Google Scholar]
- 29.McMullen JR, Shioi T, Zhang L, Tarnavski O, Sherwood MC, Dorfman AL, Longnus S, Pende M, Martin KA, Blenis J, Thomas G, Izumo S. Mol. Cell. Biol. 2004;24:6231–6240. doi: 10.1128/MCB.24.14.6231-6240.2004. [DOI] [PMC free article] [PubMed] [Google Scholar]
- 30.Yamada E, Oklada S, Saito T, Ohshima K, Sato M, Tsuchiya T, Uehara Y, Shimizu H, Mori M. J. Cell Biol. 2005;168:921–928. doi: 10.1083/jcb.200408182. [DOI] [PMC free article] [PubMed] [Google Scholar]
Associated Data
This section collects any data citations, data availability statements, or supplementary materials included in this article.
Supplementary Materials
Supplementary Figure 1. A. Cardiac GLUT1 expression in akt2−/− mice. AMCMs from 8-week-old WT and akt2−/− mice were lysed and immunoblotted for total GLUT1 abundance. Above each pair of bands is the mean band density ± SE as determined by ImageJ densitometric software analysis.
Supplementary Figure 2. Impaired high-dose insulin-stimulated 2DG uptake in akt2−/− mice. Serum-deprived AMCMs were stimulated with or without supraphysiologic-dose insulin (100nM) in the presence of [3H]-2DG. Mean 2DG uptake ± SE is graphed for each group. Counts transported in parallel cultures pre-incubated with 10µM cytochalasin B were uniformly subtracted as background counts from all experimental groups. *, P &< 0.05 versus unstimulated WT cultures. ϕ, P < 0.05 versus insulin-stimulated WT cultures (Two-tailed t-test with Bonferonni post-hoc correction, 2 hypotheses).
Supplementary Figure 3. Hemodynamic measurements of WT and akt2−/− hearts during working heart mode performed as described in Experimental Procedures. Graphed are mean values for n = 9 WT and n = 8 akt2−/− hearts ± SE. The F-statistic and P-values are shown for each comparison. Two-tailed, homoscedastic t-tests were performed to statistically compare WT vs. akt2−/− heart rate, peak systolic pressure, cardiac output, coronary flow, cardiac work, stroke work and cardiac power.
Supplementary Figure 4. Baseline cardiac structure and function in akt2−/− mice determined by echocardiography. 8-week-old mice underwent transthoracic echocardiography. HR, heart rate; LVPWd, left ventricular posterior wall thickness in diastole; IVSd, intraventricular septal thickness in diastole; LVIDd, left ventricular internal dimension in diastole; LVPWs, left ventricular posterior wall thickness in systole; IVSs, intraventricular septal thickness in systole; LVIDs, left ventricular internal dimension in systole; LVMI, left ventricular mass index; FS, fractional shortening. Mean values ± SE are shown.
Supplementary Figure 5. Baseline cardiac Akt1 and Akt2 protein levels in akt2−/− mice. WT and akt2−/− AMCMs were subjected to immunoblot analysis with Akt2-specific antiserum. Membranes were then stripped and reprobed with Akt1-specific antiserum.
Supplementary Figure 6. Real-time quantitative RT-PCR analysis of cardiac fetal gene expression in WT and akt2−/− mice after sham or MI operation. Beta-myosin heavy chain expression (A) and atrial natriuretic factor (B) expression normalized to GAPDH expression are graphed as fold control ± SE. *, P < 0.05 versus sham-operated congenic control cohort (two-tailed, homoscedastic t-test with Bonferroni post-hoc correction, 3 hypotheses).
Supplementary Figure 7. Echocardiographic evaluation of wild type and akt2 −/− mice after experimental myocardial infraction. Anesthetized and intubated 8 week-old mice were subjected to MI by ligation of the left coronary artery. Mice were analyzed by transthoracic echocardiography 1 day and 7 days after ligation of the left coronary artery. SWMSI, segmental wall motion score index (a value of 0 in SWMSI indicates normal wall motion, whereas a SWMSI score of 1 indicates cardiac akinesis). EDV, end-diastolic volume (mm3); ESV, end-systolic volume (mm3); EF, ejection fraction.