

Abstract
Lipid rafts defined as cholesterol- and sphingomyelin-rich domains have been isolated from different cell types that vary greatly in their lipid profiles. Here, we investigated the contribution of the structural protein caveolin-1 (Cav1) to the overall lipid composition and domain abundance in mouse embryonic fibroblasts (MEFs) from wild-type (WT) or Cav1-deficient (Cav1−/−) animals. Our findings show that Cav1 expression had no effect on free (membrane-associated) cholesterol levels. However, Cav1−/−-deficient cells did have a higher proportion of sphingomyelin, decreased abundance of unsaturated phospholipids, and a trend toward shorter fatty acid chains in phosphatidylcholine. We isolated detergent-resistant membranes (DRMs), nondetergent raft domains (NDR), and cholesterol oxidase (CO)-sensitive domains and assessed the abundance of ordered domains in intact cells using the fluorescent dye Laurdan. Despite differences in phospholipid composition, we found that cholesterol levels in DRMs, NDR, and CO-sensitive domains were similar in both cell types. The data suggest that Cav1 is not required to target cholesterol to lipid rafts and that CO does not specifically oxidize caveolar cholesterol. In contrast, the abundance of ordered domains in adherent cells is reduced in Cav1−/− compared with WT MEFs, suggesting that cell architecture is critical in maintaining Cav1-induced lipid rafts.
Keywords: lipid rafts, caveolae, lipid profile
The organization of cellular membranes is largely described by the classic fluid mosaic model, which assumes that lipids in the bilayer are fluid, with uninterrupted lateral diffusion. However, this model can explain neither lateral segregation at cell activation sites (1) nor the variety of lipid species in cell membranes (2). Over the past 10 years, the lipid raft hypothesis has changed the way cell biologists view lipids and membrane organization (3, 4). It defines lipid rafts as cholesterol- and sphingolipid-rich domains within the cell membranes (5) that localize and concentrate raft-associated proteins to specific sites, in particular proteins with glycosyl phosphatidylinositol (GPI) anchors or pairs of closely spaced acyl chains (6). Due to the tight packing of lipids, particularly saturated fatty acids, in lipid raft domains, they are more ordered than their more fluid surrounding membranes (7). Hence, these membrane domains constitute biophysically and biochemically discrete platforms. The existence of specialized domains in cell membranes has implications for fundamental cell function, such as signal transduction and protein sorting processes (3), because domains that dynamically regulate the association and disassociation of proteins control protein targeting and signaling efficiency (8).
The lipid raft hypothesis created excitement because it described lipid-based lateral segregation and elevated lipids from simple building blocks to regulatory elements. However, it remains controversial (9, 10). Lipid rafts can be isolated based on their resistance to certain nonionic detergents as detergent-resistant membranes (DRMs) or on their relatively low density as the light membrane subfraction obtained after mechanical disruption of cell membranes (11). A concern about the use of detergents for raft isolation is based on the observation that detergents can scramble lipids and thus artificially induce membrane domains (11–13). Detergent-free isolation procedures, however, yield similar domains as DRMs and, additionally, resemble ordered rafts domains in intact cells (11), suggesting a general similarity between preexisting domains and isolated DRMs or nondetergent raft domains (NDRs). Nevertheless, it is the current consensus that DRMs do not reflect lipid rafts in cell membrane (14) but are a useful tool to generally describe biochemical differences between cell types and identifying protein modifications that are raft-favoring (6).
Caveolae are regarded as a subtype of lipid rafts that are characterized by ∼50–80 nm uncoated invaginations of the plasma membrane (15). Caveolae were first discovered morphologically before the molecular identity was described by the discovery of caveolins in 1992 (16). It is now known that caveolin-1 (Cav1) expression in mammalian cells drives the formation of caveolae (17, 18). It was also shown that caveolins are associated with DRMs in epithelial cells (19). In fact, in all cell types tested, Cav1 is predominantly associated with DRMs or light membrane fractions (20). Caveolae associate with specific lipids, and Cav1 itself binds cholesterol with high affinity (21). With approximately 144 molecules of caveolin per caveola (22) and 20,000 molecules of cholesterol in addition to glycolsphingolipids (such as GM1) and sphingomyelin (SM), the density of lipids in caveolae was found to be higher in immuno-isolated caveolae than the surrounding plasma membrane (15). Cells that do not exhibit morphologically identifiable caveolae nevertheless yield DRMs (23, 24) and NDR (11). It has previously been suggested that cholesterol oxidase (CO) preferentially oxidizes cholesterol in caveolae, making it the simplest approach to discriminate between caveolae cholesterol and noncaveolar raft cholesterol (25).
Cav1 expression is essential for the formation of caveolae, and cells from Cav1-deficient (Cav1−/−) mice show a complete lack of morphologically identifiable caveolae (18, 26). The effects of Cav1 ablation on plasma membrane lipid raft composition and distribution, however, is not well understood. Previous studies indicated that the distribution of proteins normally associated with lipid rafts is unaffected by loss of Cav1 expression (27), suggesting either that preexisting lipid raft domains are not dependent on Cav1 expression or that caveolae represent only a small proportion of total raft domains. Therefore, we compared lipid raft domains in wild-type (WT) and Cav1−/− mouse embryonic fibroblasts (MEFs).
MATERIALS AND METHODS
Cells and reagents
MEFs were prepared from 13.5 post-coitum embryos obtained by homozygous crossings of Cav1−/− mice or WT mice (26). MEF cells were immortalized by continuous passage until growth rates in culture resumed the rapid rates seen in early passages. MEFs were cultured in DMEM supplemented with 10% (v/v) FCS, 2 mM l-glutamine, 100 units/l penicillin, and 100 µg/l streptomycin at 37°C in 5% CO2. MEFs were transfected with plasmids encoding WT Cav1 or Y14F Cav1 using MEF2 solution combined with the T20 program of the Amaxa system. BSA (essentially fatty acid free), Dulbecco's PBS, chloramphenicol, cholesterol, and cholestenone were purchased from Sigma-Aldrich (Castle Hill, Australia). [3H]cholesterol (48.0 Ci/mmol) and [methyl-14C] choline chloride (55.0 mCi/mmol) were from Amersham (GE Healthcare, Rydalmere, Australia), and [1-14C]acetic acid (45 mCi/mmol) was from Perkin-Elmer. CompleteTM protease inhibitor cocktail was from Roche (1 tablet/50 ml).
Cell homogenation
Cells were homogenized in 0.25 M sucrose in 20 mM HEPES buffer containing 0.5 mM EDTA using a ball homogenizer. Unbroken cells and nuclei were removed by centrifugation. Protein content of cell homogenate was determined by BCA protein assay.
Cholesterol analysis
Cell homogenates were extracted with hexane/methanol and cholesterol and cholesterol esters analyzed by reverse-phase HPLC as described previously (28).
Lipid extraction
An aliquot of homogenate containing 100 μg of protein was taken and the lipids extracted by standard methods (29) with slight modifications as described recently (30). Prior to extraction, 50 μl of an internal standard mixture containing 20 µM each of 1,2-dinonadecanoyl-sn-glycerol-3-phosphocholine (PC19:0/19:0), 1,2-diheptadecanoyl-sn-glycerol-3-phosphoethanolamine (PE17:0/17:0), 1,2-diheptadecanoyl-sn-glycerol-3-phosphoserine (PS17:0/17:0), 1,2-diheptadecanoyl-sn-glycerol-3-phosphoglycerol (PG17:0/17:0), 1,2-diheptadecanoyl-sn-glycerol-3-phosphate (PA17:0/17:0), and N-lauroyl-d-erythro-sphingosylphosphorylcholine (SM 12:0) (Avanti Polar Lipids, Alabaster, AL) was added to the homogenate. Extracts were dried under nitrogen, reconstituted in methanol:cholorofrom (2:1, v/v), and stored at −80°C until analysis by ESI-MS.
Mass spectrometry
Mass spectrometry (MS) was performed on a QSTAR Pulsar i quadrupole time-of-flight mass spectrometer (MDS Sciex, Concord, Canada) equipped with a nanospray ion source (Proxeon, San Mateo, CA). Before MS analysis, all samples were diluted in methanol:chloroform (2:1, v/v) containing 5 mM (final concentration) ammonium acetate. SM was analyzed in positive-ion mode using a precursor ion scan for phosphocholine (m/z 184.15), while glycerolphospholipids were detected in negative ion mode by multiple precursor ion scanning of fatty acid carboxylate ions and phosphate head group fragmentation (31). Ion spray voltage was set to 750 and 800 V for positive and negative ion analyses, respectively. For phosphatidylcholine (PC) scanning, collision energy was set to 37 eV and the scanning quadrupole (Q1) scanned 20 times from m/z 450 to 820 with a step size of 0.2 Da and a dwell time of 30 ms. For FA scanning, precursor ion spectra were simultaneously acquired for 30–50 FA anions, containing 12–22 carbon atoms and 0–6 double bonds. Collision energy was set at 40 eV and Q1 scanned 20 times from m/z 450 to 920 with a step size and dwell time identical to that for phosphocholine scanning. For both scan types, Q1 was set at unit resolution and fragment ions selected within an m/z window of 0.15 Da. Peak enhancement, i.e., trapping of target fragment ions, was applied according to the manufacturer's specifications (32). All spectra were interpreted using a prototype of LipidProfiler™ software (MDS Sciex, Concord, Canada) (33). Individual molecules were quantified by comparison to the internal standard with the same head group, after correction for isotope contributions, as recently described (33).
Cholesterol oxidase (CO) treatment
MEFs were seeded into 10 cm tissue culture plates and maintained in DMEM with 10% FCS, 2 mM l-glutamine, and antibiotics until near confluency 3 days later. MEFs were then incubated overnight in DMEM with 10% delipidated-FCS and 10 µCi [14C]acetate per 10 cm dish. Cells were then washed once in PBS and incubated with CO (Nocardia erythropolis from Boehringer Mannheim) at 0.5 U/ml at 37°C in fresh medium without serum. Lipids were extracted according to Bligh and Dyer, as previously described (11). Dried lipids were resuspended in 30 µl chloroform/methanol (2:1), and 14C-lipids were resolved on silica high-performance TLC plates using the solvent system of hexane/ethyl ether/acetic acid (80:20:1). Pure cholesterol and pure cholestenone were used as standards on the TLC plate. Lipids were visualized by charring with sulfuric acid-dichromate and heating at 180°C for 10 min. The appropriate spots (corresponding to cholesterol and cholestenone, respectively) were scrapped and the amount of radiation quantified by liquid scintillation counting.
DRM extraction and NDR isolation
Detergent extraction and flotation were achieved as described previously (20). Briefly, cells (≈1 mg protein/culture dish) were washed twice with TNE (100 mM Tris, pH 7.4, 150 mM NaCl, and 0.2 mM EGTA) and resuspended in 350 µl TNE/antiproteases and homogenized. Samples were extracted with 50 µl of Triton X-100 (Perbio, ThermoFisher Scientific, Suwanee, GA) for 30 min on ice (detergent:protein, 5:1) and adjusted to 40% iodixanol with 800 µl of Optiprep (Nycomed Pharma, Nycomed International GmbH, Zurich, Switzerland), transferred into SW60 centrifuge tubes, and overlaid with 2.5 ml of 30% iodixanol/TNE and 0.3 ml TNE and then centrifuged at 40,000 rpm for 4 h. Eight fractions of 500 µl were collected from the top of the gradient.
For the isolation NDRs, whole cell homogenates (total volume 1.2 ml) were sonicated for 4 × 30 s with a 3 mm titanium probe (frequency 23 kHz, amplitude 30 microns) and placed on ice (11). Samples were then adjusted to a final concentration of 45% (w/v) sucrose by mixing with an equal volume of 90% (w/v) sucrose in MBS (25 mM MES, pH 6.5, and 150 mM NaCl). The mixture (2.0 ml) was overlaid with 2.5 ml of 35% (w/v) sucrose, 2.5 ml of 30% (w/v) sucrose, 2.5 ml of 25% (w/v) sucrose, and 2.5 ml of 5% (w/v) sucrose (all in MBS) (11). The sucrose gradient was spun at 40,000 rpm in a Beckman SW41 rotor for 16 h. Twelve fractions of 1.0 ml were collected from the top. For lipid analysis, fractions 2-5 and 8-11 were pooled.
Phospholipid and cholesterol synthesis
Cells were seeded in six-well plates and labeled with 3 μCi/well [methyl-14C] choline chloride or 2 μCi/well [1-14C] acetic acid for 24 h at 37°C in DMEM with 10% FBS. Cells were washed and lysed, and phospholipids (PLs) were extracted using the Bligh and Dyer method (11). Cholesterol and cholesterol esters were extracted from 2 ml of sample in the presence of 20% KOH in methanol (600 µL) by adding 2 ml of n-hexane/ether mixture (1:1, v/v). The upper phase was collected and reextracted as before. PL and cholesterol extracts were separated by TLC with silica gel on polyester plates (Sigma-Aldrich, Castle Hill, Australia) using a solvent system of chloroform/methanol/ammonium hydroxide (7:25:4 v/v/vol) or n-hexane/ether/acetic acid (60:40:1, v/v/v), respectively. The areas of the plates containing PC, SM, lysophosphatidylcholine, cholesterol, and cholesterol esters were scraped into vials, and radioactivity was determined by scintillation counting.
Immunoblotting
After detergent extraction and flotation, equal aliquots (20 µl) of the optiprep gradient fractions were run on 12.5% SDS-PAGE gel, blotted and probed with various antibodies described in the figure legends. Primary antibody detection was performed using appropriate peroxidase-conjugated IgGs, and protein signals were visualized using enhanced chemiluminescence by exposure to Kodak autoradiographic film. Where cell homogenates were used, equal amounts of protein were loaded onto the gels. The Src-like kinase YES and caveolin-2 antibodies were from Transduction Laboratories. The polyclonal caveolin-1 antibody was from Santa Cruz Biotechnology (Santa Cruz, CA).
Laurdan microscopy
Cells labeled with Laurdan (Molecular Probes) were imaged and analyzed as previously described (34–36). In brief, labeled cells were fixed and images obtained close to the coverslip with a Leica DM IRE2 microscope. Laurdan was excited at 800 nm and emission intensities simultaneously recorded in the ranges of 400–460 nm and 470–530 nm. Intensity images were converted into generalized polarization (GP) images (WiT software) with
GP distributions were obtained by fitting two Gaussian populations to normalized histograms of GP images using the nonlinear fitting algorithm solver in Microsoft Excel. Microscope calibrations were carried out as previously described (34, 36).
RESULTS
Lipid composition of WT and Cav1−/− MEFs
Lipid rafts are defined as cholesterol- and sphingolipid-rich domains (5), and manipulations of cholesterol or SM levels have previously been used to identify raft function (9). It has been shown that the abundance of specific lipid species critically influences the yield of DRMs (20) and NDR (11). Hence, we conducted a complete lipid analysis quantifying cholesterol by reverse-phase HPLC and PLs by ESI-MS and compared lipid levels between WT and Cav1−/− MEF with nonpaired t-tests.
We used mouse embryonic fibroblasts from WT and Cav1−/− mice throughout these studies. The genetic depletion of Cav1 results in no detectable Cav1 protein expression (Fig. 1A) or caveolae on the cell surface (data not shown). In addition, Cav2 expression in Cav1−/− MEF was reduced to ∼13% of the levels in WT MEFs (Fig. 1B). While Cav2 deficiency alone is insufficient to reduce caveolae on the cell surface (37), Cav2 expression can rescue caveolae formation in Cav1−/− membranes (38). Hence, the decreased expression of Cav2 in Cav1−/− MEF is fortuitous and necessary to assess caveolin and caveolae-dependent membrane domains.
Fig. 1.
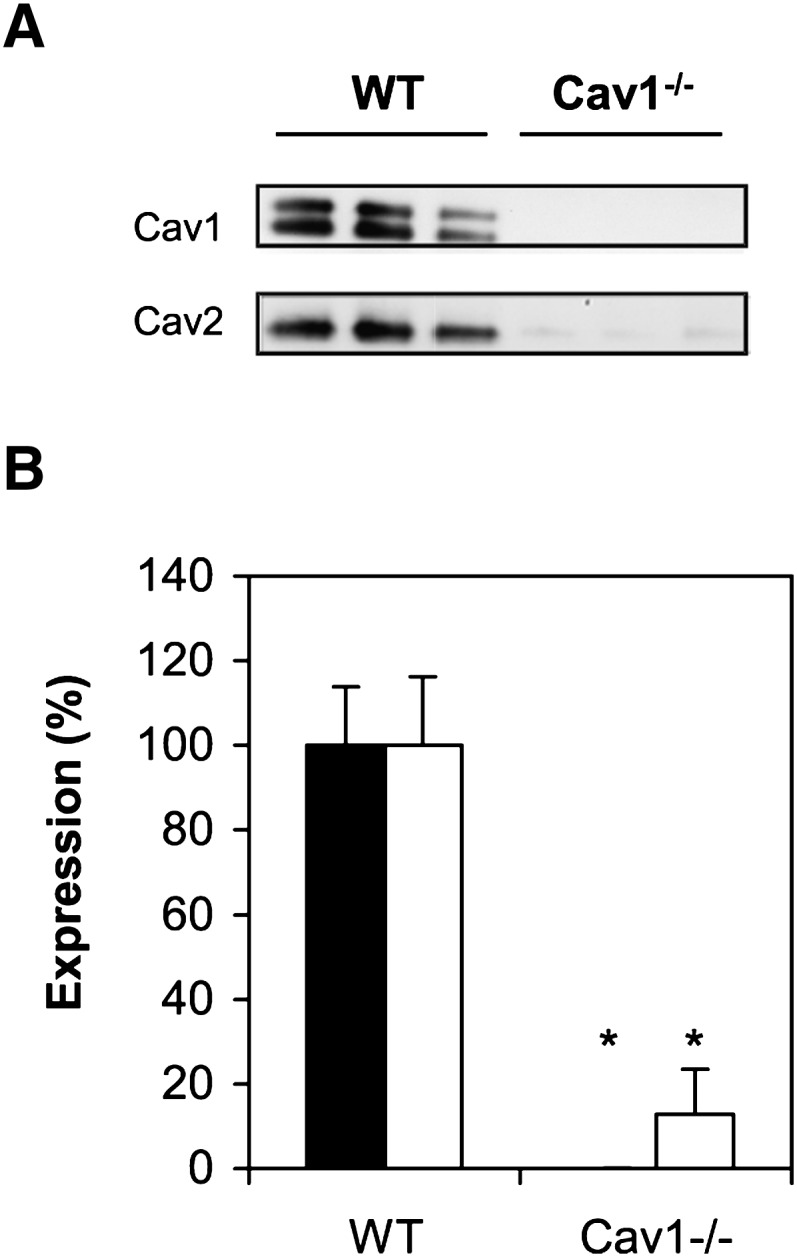
Caveolin expression in WT and Cav1−/− MEFs. A: Western blot of whole cell lysate from WT and Cav1−/− MEFs probed for Cav1 and Cav2. B: Relative Cav1 (closed bars) and Cav2 expression (open bars) in WT and Cav1−/− MEFs from three experiments, each with triplicate cell cultures.
We found no significant difference in total and free cholesterol levels between Cav1−/− and WT MEF (Fig. 2A; P > 0.05). This suggests that membrane cholesterol levels are similar in both cell types despite a significant reduction in cholesterol synthesis in Cav1−/− MEF (data not shown). In Cav1−/− MEF, a significantly higher proportion of cholesterol is present as cholesterol esters compared with WT MEFs (Fig. 2B; P < 0.05). In summary, Cav1 expression in MEFs alters the balance between free and esterified cholesterol, although the total cholesterol levels were not significantly different. A previous report suggested that Cav1 plays a role in regulating intracellular cholesterol because free cholesterol levels decreased and esterified cholesterol increased in Cav1−/− compared with WT MEFs (39).
Fig. 2.

Cholesterol and PL content of WT and Cav1−/− MEFs. A, B: Unesterified (free; A) and esterified cholesterol (B) was analyzed by HPLC and normalized to cell protein. Values are mean and standard deviation of six samples each. Asterisk in B indicates a significant difference of P< 0.05 between WT and Cav1−/− MEFs. C: Relative abundance of PLs in WT (closed bars) and Cav1−/− (open bars) MEFs. Cells were homogenates, lipids extracted and analyzed by mass spectrometry as described in Materials and Methods. Total PL mass was 333 ± 27 nmol/mg cell protein and 199 ± 36 nmol/mg in WT and Cav1−/− MEFs, respectively. D: Relative levels of PC esters in WT (closed bars) and Cav1−/− (open bars) MEFs. E: PL synthesis in WT (closed bars) and Cav1−/− (open bars) MEFs is measured by incorporation of 14C-choline over a 24 h period. Radioactivity (CPM) is normalized to cell protein. A–E: Asterisks indicate a significant difference between WT and Cav1−/− MEFs of P< 0.05. Data are presented as mean + SE (n = 4).
We next analyzed PLs by ESI-MS and compared PL subclasses between Cav1−/− and WT MEF (Fig. 2C). PC was the main PL class, comprising ∼70% of total PLs in both cell types (Fig. 2C). SM was the only PL class whose relative abundance was significantly different (P < 0.05), with higher levels in cells that lacked Cav1 expression. In contrast, expression of Cav1 in a human epidermal carcinoma cell did not result in a change in PL classes (24), indicating that induced expression and endogenous expression of Cav1 may have a differential effect on cell lipid profiles. We detected significant levels of PL ethers only in PC (Fig. 2D), but these were not significantly different between the two cell types. A previous report implicated plasmalogens in membrane trafficking and domain formation, including caveolae (40). Hence, any differences in membrane domains between Cav1−/− and WT MEF is probably not caused by plasmalogens. We further assessed PL synthesis in MEFs by measuring incorporation of 14C-choline over a 24 h period. As can be seen from Fig. 2E, PC and SM synthesis is comparable between the two cell types (P > 0.05), suggesting that the increase in relative SM levels in Cav1−/− MEFs is not caused by preferential choline incorporation into SM.
Closer examination of the molecular PC species in Cav1−/− and WT MEFs showed that Cav1−/− MEFs had significantly less PC mass than WT cells (Fig. 3A) despite similar rates of PC synthesis (Fig. 2E). We thus compared PC levels in terms of molar ratios within each cell type. We identified 24 different PC species in MEFs (Fig. 3B). A more detailed analysis of PC revealed a significant (P < 0.05) increase in monounsaturated PC and a significant decrease in polyunsaturated PC in Cav1−/− compared with wild-type MEFs (Fig. 3C). In addition, there was a shift to shorter acyl chains in PC species found in Cav1−/− MEF, with PC species having 32 carbon atoms or less being significantly higher and PC species having 36 carbon atoms or more being significantly lower in Cav1−/− MEFs versus WT MEFs (Fig. 3D). In summary, Cav1 expression influences the degree of saturation and carbon chain length in PC.
Fig. 3.

PC content of WT and Cav1−/− MEFs. A: Levels of PC normalized to cell protein in WT (closed bars) and Cav1−/− (open bars) MEFs. B: Relative levels of individual PC species found in WT (closed bars) and Cav1−/− (open bars) MEFs. C: Number of double bonds per PC molecule in WT (closed bars) and Cav1−/− (open bars) MEFs. D: Acyl chain length in PC in WT (closed bars) and Cav1−/− (open bars) MEFs. Asterisks in A, C, and D indicate a significant difference between WT and Cav1−/− MEFs of P< 0.05. Data are presented as mean + SE (n = 4).
When analyzing SM by scanning for precursors of PC in a total lipid extract (see Methods and Methods) the spectra are dominated by PC (see supplementary Fig. IA). As a consequence, many of the low-abundance SM molecules are obscured by isotopes of PC. In order to obtain a more complete analysis of SM, hydrolysis of glycerophospholipid fatty acyl esters was promoted by the addition of sodium hydroxide (0.7 M final concentration) to the homogenate prior to lipid extraction. Under these conditions, due to their amide linkage, SMs maintain their molecular integrity, resulting in a significantly improved detection (see supplementary Fig. IB). A similar, yet more complex, approach for the analysis of low-abundance sphingolipids has been described recently (41).
Because relative levels of SM were significantly higher in Cav1−/− MEFs, we analyzed SM species in more detail (Fig. 4B). Similarly to PC, absolute levels of SM were lower in Cav1−/− MEFs than WT MEFs (Fig. 4A). Furthermore, we found a similar trend in the degree of SM saturation as in PC: saturated SM levels are higher, while unsaturated levels are lower in Cav1−/− MEFs compared with WT MEFs (Fig. 4C). In contrast, the trend toward shorter fatty acid chains in PC in Cav1−/− MEF was reversed with SM species with 16 carbon atoms being significantly lower and SM species with 20–23 carbon atoms being significantly higher in Cav1−/− MEF compared with Cav1-expressing MEFs (Fig. 4D). Given the relatively small contribution of SM to total PL levels, we found a trend toward shorter fatty acid chains and higher levels of saturation and monounsaturation in Cav1−/− cells when fatty acid chains from all PLs species are examined together (data not shown).
Fig. 4.

SM content of WT and Cav1−/− MEFs. A : Levels of SM normalized to cell protein in WT (closed bars) and Cav1−/− (open bars) MEFs. B: Relative levels of individual SM species found in WT (closed bars) and Cav1−/− (open bars) MEFs. C: Number of double bonds per SM molecule in WT (closed bars) and Cav1−/− (open bars) MEFs. D: Acyl chain length in SM in WT (closed bars) and Cav1−/− (open bars) MEFs. Asterisks in A, C, and D indicate a significant difference between WT and Cav1−/− MEFs of P< 0.05. Data are presented as mean + SE (n = 4).
The molecular identify of the minor PLs is presented in the supplementary material: phosphatidylethanonamine (supplementary Fig. IIA), phosphatidylglycerol (supplementary Fig. IIB), phosphatidylserine (supplementary Fig. IIC), phosphatidic acid (supplementary Fig. VD), and phosphatidylinositol (supplementary Fig. IIE).
In summary, we found similar levels of membrane cholesterol between the two cell types but higher relative SM levels and greater PL saturation in MEFs that lack Cav1 as well as differences in fatty acyl chain length within individual PLs species. Hence, in the following experiments, we used cholesterol to measure the lipid abundance in isolated lipid rafts.
Effects of Cav1 expression on biochemical lipid raft isolation
We next compared the composition of isolated lipid raft domains in WT and Cav1−/− MEFs. To which extent these isolated lipid rafts reflect raft domains in intact cells is a matter of intense debate (9). Nevertheless, these assays have been useful tools to assess the biochemical differences between two cell types (20). Here, we treated cell membranes with cold detergent (20), CO (25), or sonication followed by separation of lipid rafts and nonraft membranes by density-gradient centrifugation (11). Cav1, Cav2, and the GPI-anchored protein YES were used to track caveolae/lipid raft domains in WT and Cav1−/− cells.
DRMs were prepared by treating whole cell homogenates with 1% Triton X-100 as described in Materials and Methods (supplementary Fig. IIIA). As expected, Cav1, Cav2, and YES were predominantly located in the light DRM fractions (1–3) in WT MEFs, while the nonraft marker transferrin receptor was present only in denser non-DRM fractions (6–8; data not shown). As shown previously, we found that Cav1−/− MEFs express no Cav1 protein (data not shown) and also strongly reduced levels of Cav2, which is located predominantly in nonraft fractions (18, 39). YES was still recovered in buoyant DRM fractions in Cav1−/− MEFs, indicating that they still contain intact lipid rafts. This is consistent with other studies that have detected normal distribution of other raft markers in membranes of Cav1-null cells (26, 27).
As the relative recovery of raft proteins in DRMs is not indicative of the overall abundance of DRMs, we also compared the cholesterol distribution between DRM and non-DRM fractions of WT and Cav1−/− MEFs (see supplementary Fig. IIIB). We found no differences in either total membrane cholesterol content (data not shown) or in its distribution between raft and nonraft domains (66.6 ± 0.6% in rafts in WT MEFs; 69.7 ± 2.5% in Cav1−/− MEFs; P > 0.05). This indicates that Cav1 expression does not significantly control cholesterol distribution in DRMs, suggesting that Cav1 may associate with lipid raft domains in the plasma membrane rather than directly generate them.
The cell-impermeable enzyme, CO, converts cholesterol to cholestenone and is widely used to probe changes in plasma membrane cholesterol distribution. There are several technical variations in the method that can lead to quantitative differences in the estimated size of the cholesterol-oxidase sensitive pool (42, 43). Previously, it was reported that a particular protocol, which avoids fixation of the cells, preferentially oxidizes cholesterol present in caveolae, causing Cav1 to relocate in the Golgi (25). This property has been used to study the role of caveolae in signal transduction processes and cholesterol transport, suggesting that Cav1 transports newly synthesized cholesterol to the plasma membrane (44). We used the same conditions to measure the CO-sensitive cholesterol pools in WT and Cav1−/− MEFs (Fig. 5). Consistent with previous studies, ∼10% of cellular cholesterol was converted to cholestenone in WT cells (Fig. 5A). Furthermore, we observed no significant difference in CO-sensitive cholesterol between WT and Cav1−/− MEFs (P > 0.05). Because Cav1−/− MEFs lack caveolae, this result suggests that CO accessible cholesterol is not restricted to, or even predominantly in, caveolae. To further explore the location of CO-sensitive cholesterol, DRMs were isolated from CO-treated WT and Cav1−/− cells. In each fraction, we measured CO-sensitive ([14C]cholestenone; Fig. 5C) and CO-insensitive ([14C]cholesterol; Fig. 5B) cholesterol. CO treatment significantly lowered the proportion of labeled cholesterol recovered in DRM (Fraction 1, Fig. 5B) in both WT and Cav1−/− MEFs. The majority of [14C]cholestenone accumulated in the non-DRM fractions of WT and Cav1−/− MEFs (Fig. 5C), and we observed no differences in cholestenone accumulation across the gradient between WT and Cav1−/− MEFs. Taken together, the data suggest that caveolae do not represent a specific or major site of action for CO.
Fig. 5.

DRM isolation after CO treatment of WT and Cav1−/− MEFs. MEF cell homogenates prelabeled with [14C]acetate were left untreated or incubated with 0.5 U/ml CO for 60 min at 37°C. DRM purification was performed, and 14C-cholesterol and 14C-cholestenone were determined for each fraction. A: CO activity in total cell homogenates from treated WT and Cav1−/− MEFs. CO activity is expressed as a percentage of total [14C]cholesterol. B: Distribution of CO-insensitive [14C]cholesterol on DRM gradients for control (cells lefts untreated) and CO-treated cells for WT (top) and Cav1−/− (bottom) MEFs, respectively. Asterisk indicates a statistical significant difference of P< 0.05 relative to control. C: Distribution of CO-sensitive [14C]cholestenone on DRM gradients for WT and Cav1−/− MEFs. D: Twenty microliters of each fraction from WT and Cav1−/− MEFs treated with CO was analyzed by immunoblotting for YES, Cav1, and Cav2. The data shown in A–C are mean ± SD of three independent experiments.
We also examined the effect of CO exposure on the distribution of caveolins and GPI-anchored YES across DRM gradients (Fig. 5D). After CO treatment, Cav1 and YES were still predominately associated with DRMs in WT MEFs, although a minor shift to nonraft fractions was detected, particularly of Cav2 in WT MEFs and YES in Cav1−/− MEFs (Fig. 5D vs. supplementary Fig. IIIA). We conclude that CO does not specifically act on caveolar cholesterol, as Cav1−/− MEFs remain sensitive to its action. Nevertheless, CO treatment did modestly decrease DRM cholesterol and protein content in both WT and Cav1−/− cells.
The use of detergents to isolate raft domains has been criticized, arising from concerns that detergents can artificially induce domains (11–13). This has led to the development of other techniques to separate rafts that avoid the use of detergents (45). NDRs are prepared by sonication from cell homogenates or isolated plasma membranes followed by separation on a 5–45% sucrose density gradient, as previously characterized (11). We therefore also prepared NDR from WT and Cav1−/− MEFs (see supplementary Fig. IV). WT MEFs contained 43.3 ± 2.0% of cholesterol in NDR compared with 35.4 ± 5.3% in Cav1−/− MEFs (mean ± SD of three separate experiments). Although NDR cholesterol is consistently lower in Cav1−/− MEFs, the difference between WT and Cav1−/− NDR cholesterol was not statistically significant (P > 0.05). Similarly, when isolated plasma membranes instead of whole cell homogenates were sonicated, we found no significant difference between WT and Cav1−/− MEFs with respect to the cholesterol levels in the raft fractions (data not shown). In summary, we found no difference in cholesterol distribution between WT and Cav1−/− MEF DRMs, CO-sensitive domains, or NDR, suggesting that Cav1 does not control lipid distribution between raft and nonraft domains.
Effects of Cav1 expression on membrane structure in adherent cells
Biochemical assay may not reflect preexisting rafts in intact, adherent cells (6, 9, 14). Hence, we assessed the effect of Cav1 expression on the physical state of cell membranes in intact cells labeled with the fluorescent probe Laurdan (36). The probe is sensitive to membrane structure, with its peak emission shifting from ∼500 nm in fluid to ∼430 nm in ordered membrane. A normalized ratio of the two emission regions, defined as generalized polarization (GP), reflects membrane order with +1 indicating the most ordered and −1 the most fluid membranes. Recently, we showed that Cav1 is associated with ordered domains in WT MEFs, yielding a mean GP value of 0.382 ± 0.070 (from n = 27 images), while the nonraft marker, transferrin receptor, colocalizes with fluid domains (GP 0.165 ± 0.066, n = 13) (35). The subunit B of cholera toxin, which specifically binds to the ganglioside GM1 and is frequently used as a raft marker, also colocalized to ordered domains in both WT and Cav1−/− cells (GP 0.434 ± 0.069, n = 11 WT MEFs; 0.442 ± 0.099, n = 10 Cav1−/− MEFs). The similarity in subunit B of cholera toxin binding and association with domains of high order (GP) in both cell types suggests that noncaveolar raft domains may be independent of Cav1 expression.
For a more general analysis of the effects of Cav1 on membrane structure, we compared the global GP distribution in MEFs, shown in Fig. 6A for WT MEFs. Two populations, fluid (Pf, dark gray) and ordered (Po, light gray), were identified. Each population has a characteristic mean GP value and abundance (or coverage) that equate to the area under the curve (34). The mean GP values of fluid membranes, Pf, were similar in WT and Cav1−/− MEFs (Fig. 6B), but in Cav1−/− cells covered a greater proportion of the membrane surface (91.9 ± 3.7% in Cav1−/− MEFs vs. 71.4 ± 5.7% in WT MEFs; y axis in Fig. 6B). In contrast, the ordered membranes were relatively more fluid and less abundant in Cav1−/− MEFs than WT MEFs (Fig. 6C), suggesting that Cav1 does contribute to the lipid order of raft-like domains in adherent cells. To demonstrate that the differences in membrane structure were directly related to Cav1 expression and function, Cav1−/− MEFs were transfected with either WT Cav1 or with Y14F Cav1. Expressing WT Cav1 in Cav1−/− MEFs restored both order and relative surface coverage of ordered domains to WT levels. Mutating the only tyrosine phosphorylation site in Cav1 (Y14F Cav1) has no effect on caveolae formation but inhibits raft internalization (46) and decreases membrane order at focal adhesions (34). Expression of Y14F Cav1 only partially rescued ordered domains when expressed in Cav1−/− MEF (Fig. 6C). WT Cav1 and Y14F Cav1 correspondingly decreased the proportion of fluid domains in Cav1−/− MEF (Fig. 6B). Overall, the data support a contribution of Cav1 to the generation of ordered domains in adherent, intact cells. The differential effect of Cav1 expression on biochemically identified domains and those observed by microscopy is an indication that cell architecture plays a greater role in lipid raft abundance than subtle changes in lipid composition.
Fig. 6.

Ordered and fluid domains in WT and Cav1−/− MEFs. A: WT and Cav1−/− MEFs were labeled with the fluorescent membrane dye Laurdan. Laurdan intensity was converted into the fluidity index GP. GP values range from −1 (most fluid) to + 1 (most ordered). From the GP images, the GP distribution (open diamond, shown for WT MEFs) is obtained, which is fitted to two Gaussian populations (line through data). Black vertical lines denote the centers of the fluid population (Pf), and gray vertical lines denote the centers of the ordered populations (Po). Center values and coverages (area under the curve for each population) are given for both populations. B, C: The mean GP value of fluid (B) and ordered (C) membranes and their relative abundance (percentage of coverage) are shown. WT MEFs (diamond), Cav1−/− MEFs (square), Cav1−/− MEFs transfected with WT Cav1 (triangle), and Cav1−/− MEFs expressing mutant Y14FCav1 (circle) were analyzed. Error bars are SDs of three independent experiments with ∼25 cells per experiments.
DISCUSSION
In this study, we assessed to what extent Cav1 expression contributes to the formation of biochemically identifiable rafts, such DRMs, NDRs, CO-sensitive domains, and physically ordered domains. Since Cav1 associates with specific membrane lipids and thus may be involved in lipid metabolism (17), we started our study with a complete PL analysis of MEFs from WT or Cav1−/− animals. We found a higher proportion of SM and increased abundance of smaller, more saturated PLs in Cav1−/− cells but no difference in membrane-associated cholesterol. Our data conclude that Cav1 expression is not required for the targeting of cholesterol to DRMs, NDRs, or CO-sensitive domains, despite the contribution of Cav1 to ordered domains in adherent cells. In summary, our data suggest that Cav1 is involved in the organization of cell architecture-dependent lipid rafts.
Genetic deletion of Cav1 increases the proportion of esterified cholesterol without altering total cholesterol levels (39, 47) and increases relative SM levels and the incorporation of saturated fatty acids into PLs. Ether PLs levels and the rate of PC and SM synthesis are not altered by caveolin deficiency. The mechanisms that regulate PL levels or the fatty acid incorporation into PLs are poorly understood; thus, it is unclear precisely how Cav1 achieves such modulation in cellular lipid homeostasis. Similar effects were not observed when Cav1 expression was induced in a cell type that otherwise did not form caveolae (24), suggesting that the role of Cav1 in lipid homeostasis in vivo is more complex than the formation of caveolae. Recently, it was reported that Cav−/− mice on a normal chow diet have increased saturated and monounsaturated cholesterol esters in their circulating lipoproteins compared with their WT controls (48). Taken together, it appears that Cav1 plays a role in maintaining the balance of saturated to unsaturated lipids, but further studies are required to understand the mechanism of this regulation.
The isolation and biochemical characterization of lipid rafts by detergent extraction (as DRMs) or sonication (as light membranes) have attracted criticism, as they may not reflect rafts in intact cells (6, 9). We have recently shown that isolation protocols can be adjusted so that DRMs and light membranes can represent similar domains, which, in macrophages, have similar structural properties to those found in intact cells (11). Surprisingly, we found no difference in the cholesterol content of isolated lipid rafts from Cav1−/− and WT MEFs, suggesting that caveolar cholesterol contributes a negligible or minor amount of cholesterol to DRMs and light membranes, respectively, although Cav1 itself fractionated almost completely into DRMs. Taken alone, the biochemical data suggest that both cell types have the same amount of total raft lipids; when Cav1 is present, it associates with raft fractions and generates caveolae, but Cav1 is not required for the formation of DRMs, NDRs, or CO-sensitive domains. In contrast, the data obtained by Laurdan microscopy in intact, adhered cells suggest otherwise, with Cav1 expression resulting in more ordered and more abundant raft domains. It should be kept in mind, however, that the biochemical and microscopy analysis assess rafts in two different experimental systems. The microscopy images record the structure of the adherent plasma membrane adjacent to the substratum, while in DRM and NDR assays, whole detached cells are fragmented containing both plasma membranes as well as intracellular membranes. We have previously shown that cell shape and integrin engagement significantly contribute to membrane order and, further, that Cav1 expression and phosphorylation regulate membrane order at focal adhesions (34). Hence, the microscopy analysis of membrane order also detects cell architecture-dependent membrane domains but is limited to the plasma membrane, whereas DRM and NDR analysis suggest that there is per se no biochemical difference in cholesterol-enriched membrane domains between detached WT and Cav1−/− cells. Taken together, it appears that Cav1 expression has little effect on the cholesterol distribution within membranes but does contribute to anchorage-dependent membrane order at the cell surface.
In this context, it is noteworthy that we found no difference in total cell cholesterol levels between the two cell types, while the proportional increase in SM or saturated PLs in Cav1-null cells does not contribute to higher cholesterol levels in isolated raft domains. The inverse is observed when cholesterol or sphingomylin levels are manipulated acutely; treatment with cyclodextrin to remove membrane cholesterol lowers SM levels in DRMs and NDRs, while treatment of membranes with sphingomyelinase reduces DRM and NDR cholesterol (11, 20). One interesting hypothesis is that the higher levels of SM and saturated PLs in Cav1−/− cells compensate for the loss of Cav1, resulting in the formation of noncaveolae raft domains that isolate as DRMs and NDRs. Whether subtle shifts in lipid profile, such as changes in fatty acid chain length in specific PLs subclasses, affect raft formation in general will only be resolved when lipid profiles and raft abundance are compared across cell types.
Our observation that Cav1−/− cells had identical levels of CO-sensitive cholesterol to WT cells refutes the previous suggestion that CO specifically targets caveolar-cholesterol (25). Interestingly, CO-sensitive depletion of cholesterol was largely limited to DRM in both cell types, while the CO product (cholestenone) was recovered predominantly in detergent-soluble fractions. This could be explained if lipid rafts with their high substrate concentration are the main target for CO, but that the cholestenone generated redistributes to nonraft domains. The absence of the 3β-hydroxyl group in cholestenone may cause such redistribution as it is important for the interaction with sphingolipids (49, 50). By visualizing CO action on lipid monolayers, Slotte (51) has not only shown that the oxidation reaction converts the condensed phase (cholesterol-rich phase) into an expanded phase (cholestenone-rich phase) but also located CO activity in the expanded phase or at the boundary between expanded and condensed phases. Furthermore, the catalytic rate of CO decreases with increasing membrane order of artificial lipid bilayers (52). In agreement, we only observed a small shift of raft proteins toward the nonraft fractions after CO treatment, but not the complete disorganization of DRMs observed in other studies (53, 54) that used different CO treatment conditions and cell type (55). Overall, our and other data strongly suggest that CO activity is complex and not an appropriate tool for simple characterization of caveolae.
In summary, we identified that Cav1 does not contribute to DRMs and NDR but contributes to cell architecture-dependent raft domains in adherent cells. Our complete lipid analysis of WT and Cav1−/− MEF further suggests that Cav1 plays a role in lipid homeostasis by regulating the balance in cholesterol esterification and between saturated and unsaturated fatty acids in PLs.
Supplementary Material
Footnotes
Abbreviations:
- Cav1
- caveolin-1
- Cav1−/−
- Cav1-deficient
- CO
- cholesterol oxidase
- DRM
- detergent-resistant membrane
- GP
- generalized polarization
- GPI
- glycosyl phosphatidylinositol
- MEFs
- mouse embryonic fibroblasts
- NDR
- nondetergent raft domains
- PC
- phosphatidylcholine
- PL
- phospholipids
- SM
- sphingomyelin
- WT
- wild type
The online version of this article (available at http://www.jlr.org) contains supplementary data in the form of two figures.
REFERENCES
- 1.Harder T., Rentero C., Zech T., Gaus K. 2007. Plasma membrane segregation during T cell activation: probing the order of domains. Curr. Opin. Immunol. 19: 470–475. [DOI] [PubMed] [Google Scholar]
- 2.Han X., Gross R. W. 2005. Shotgun lipidomics: electrospray ionization mass spectrometric analysis and quantitation of cellular lipidomes directly from crude extracts of biological samples. Mass Spectrom. Rev. 24: 367–412. [DOI] [PubMed] [Google Scholar]
- 3.Simons K., Ikonen E. 1997. Functional rafts in cell membranes. Nature. 387: 569–572. [DOI] [PubMed] [Google Scholar]
- 4.Simons K., Ikonen E. 2000. How cells handle cholesterol. Science. 290: 1721–1726. [DOI] [PubMed] [Google Scholar]
- 5.Pike L. J. 2006. Rafts defined: a report on the Keystone Symposium on Lipid Rafts and Cell Function. J. Lipid Res. 47: 1597–1598. [DOI] [PubMed] [Google Scholar]
- 6.Brown D. A. 2006. Lipid rafts, detergent-resistant membranes, and raft targeting signals. Physiology (Bethesda). 21: 430–439. [DOI] [PubMed] [Google Scholar]
- 7.Simons K., Vaz W. L. 2004. Model systems, lipid rafts, and cell membranes. Annu. Rev. Biophys. Biomol. Struct. 33: 269–295. [DOI] [PubMed] [Google Scholar]
- 8.Hancock J. F. 2006. Lipid rafts: contentious only from simplistic standpoints. Nat. Rev. Mol. Cell Biol. 7: 456–462. [DOI] [PMC free article] [PubMed] [Google Scholar]
- 9.Munro S. 2003. Lipid rafts: elusive or illusive? Cell. 115: 377–388. [DOI] [PubMed] [Google Scholar]
- 10.Shaw A. S. 2006. Lipid rafts: now you see them, now you don't. Nat. Immunol. 7: 1139–1142. [DOI] [PubMed] [Google Scholar]
- 11.Gaus K., Rodriguez M., Ruberu K. R., Gelissen I., Sloane T. M., Kritharides L., Jessup W. 2005. Domain-specific lipid distribution in macrophage plasma membranes. J. Lipid Res. 46: 1526–1538. [DOI] [PubMed] [Google Scholar]
- 12.Heerklotz H., Szadkowska H., Anderson T., Seelig J. 2003. The sensitivity of lipid domains to small perturbations demonstrated by the effect of Triton. J. Mol. Biol. 329: 793–799. [DOI] [PubMed] [Google Scholar]
- 13.Heerklotz H. 2002. Triton promotes domain formation in lipid raft mixtures. Biophys. J. 83: 2693–2701. [DOI] [PMC free article] [PubMed] [Google Scholar]
- 14.Lingwood D., Simons K. 2007. Detergent resistance as a tool in membrane research. Nat. Protoc. 2: 2159–2165. [DOI] [PubMed] [Google Scholar]
- 15.Ortegren U., Karlsson M., Blazic N., Blomqvist M., Nystrom F. H., Gustavsson J., Fredman P., Stralfors P. 2004. Lipids and glycosphingolipids in caveolae and surrounding plasma membrane of primary rat adipocytes. Eur. J. Biochem. 271: 2028–2036. [DOI] [PubMed] [Google Scholar]
- 16.Rothberg K. G., Heuser J. E., Donzell W. C., Ying Y. S., Glenney J. R., Anderson R. G. 1992. Caveolin, a protein component of caveolae membrane coats. Cell. 68: 673–682. [DOI] [PubMed] [Google Scholar]
- 17.Parton R. G., Simons K. 2007. The multiple faces of caveolae. Nat. Rev. Mol. Cell Biol. 8: 185–194. [DOI] [PubMed] [Google Scholar]
- 18.Razani B., Engelman J. A., Wang X. B., Schubert W., Zhang X. L., Marks C. B., Macaluso F., Russell R. G., Li M., Pestell R. G., et al. 2001. Caveolin-1 null mice are viable but show evidence of hyperproliferative and vascular abnormalities. J. Biol. Chem. 276: 38121–38138. [DOI] [PubMed] [Google Scholar]
- 19.Kurzchalia T. V., Dupree P., Parton R. G., Kellner R., Virta H., Lehnert M., Simons K. 1992. VIP21, a 21-kD membrane protein is an integral component of trans-Golgi-network-derived transport vesicles. J. Cell Biol. 118: 1003–1014. [DOI] [PMC free article] [PubMed] [Google Scholar]
- 20.Schuck S., Honsho M., Ekroos K., Shevchenko A., Simons K. 2003. Resistance of cell membranes to different detergents. Proc. Natl. Acad. Sci. USA. 100: 5795–5800. [DOI] [PMC free article] [PubMed] [Google Scholar]
- 21.Murata M., Peranen J., Schreiner R., Wieland F., Kurzchalia T. V., Simons K. 1995. VIP21/caveolin is a cholesterol-binding protein. Proc. Natl. Acad. Sci. USA. 92: 10339–10343. [DOI] [PMC free article] [PubMed] [Google Scholar]
- 22.Pelkmans L., Zerial M. 2005. Kinase-regulated quantal assemblies and kiss-and-run recycling of caveolae. Nature. 436: 128–133. [DOI] [PubMed] [Google Scholar]
- 23.Fra A. M., Williamson E., Simons K., Parton R. G. 1994. Detergent-insoluble glycolipid microdomains in lymphocytes in the absence of caveolae. J. Biol. Chem. 269: 30745–30748. [PubMed] [Google Scholar]
- 24.Pike L. J., Han X., Chung K. N., Gross R. W. 2002. Lipid rafts are enriched in arachidonic acid and plasmenylethanolamine and their composition is independent of caveolin-1 expression: a quantitative electrospray ionization/mass spectrometric analysis. Biochemistry. 41: 2075–2088. [DOI] [PubMed] [Google Scholar]
- 25.Smart E. J., Ying Y-S., Conrad P. A., Anderson R. G. W. 1994. Caveolin moves from caveolae to the golgi apparatus in response to cholesterol oxidation. J. Cell Biol. 127: 1185–1197. [DOI] [PMC free article] [PubMed] [Google Scholar]
- 26.Drab M., Verkade P., Elger M., Kasper M., Lohn M., Lauterbach B., Menne J., Lindschau C., Mende F., Luft F. C., et al. 2001. Loss of caveolae, vascular dysfunction, and pulmonary defects in caveolin-1 gene-disrupted mice. Science. 293: 2449–2452. [DOI] [PubMed] [Google Scholar]
- 27.Gonzalez E., Nagiel A., Lin A. J., Golan D. E., Michel T. 2004. Small interfering RNA-mediated down-regulation of caveolin-1 differentially modulates signaling pathways in endothelial cells. J. Biol. Chem. 279: 40659–40669. [DOI] [PubMed] [Google Scholar]
- 28.Gelissen I. C., Brown A. J., Mander E. L., Kritharides L., Dean R. T., Jessup W. 1996. Sterol efflux is impaired from macrophage foam cells selectively enriched with 7-ketocholesterol. J. Biol. Chem. 271: 17852–17860. [DOI] [PubMed] [Google Scholar]
- 29.Folch J., Lees M., Sloane-Stanley G. H. 1957. A simple method for the isolation and purification of total lipides from animal tissues. J. Biol. Chem. 226: 497–509. [PubMed] [Google Scholar]
- 30.Ekroos K. 2008. Unraveling glycerophospholipidomes by lipidomics. Biomarker Methods in Drug Discovery and Development. Wang F., editor Humana Press, Totowa, NJ: 369–384. [Google Scholar]
- 31.Ekroos K., Chernushevich I. V., Simons K., Shevchenko A. 2002. Quantitative profiling of phospholipids by multiple precursor ion scanning on a hybrid quadrupole time-of-flight mass spectrometer. Anal. Chem. 74: 941–949. [DOI] [PubMed] [Google Scholar]
- 32.Chernushevich I. V. 2000. Duty cycle improvement for a quadrupole-time-of-fight mass spectrometer and its use for precursor ion scans. Eur. J. Mass Spectrom. (Chichester, Eng.). 6: 471–479. [Google Scholar]
- 33.Ejsing C. S., Duchoslav E., Sampaio J., Simons K., Bonner R., Thiele C., Ekroos K., Shevchenko A. 2006. Automated identification and quantification of glycerophospholipid molecular species by multiple precursor ion scanning. Anal. Chem. 78: 6202–6214. [DOI] [PubMed] [Google Scholar]
- 34.Gaus K., Le Lay S., Balasubramanian N., Schwartz M. A. 2006. Integrin-mediated adhesion regulates membrane order. J. Cell Biol. 174: 725–734. [DOI] [PMC free article] [PubMed] [Google Scholar]
- 35.Gaus K., Zech T., Harder T. 2006. Visualizing membrane microdomains by Laurdan 2-photon microscopy. Mol. Membr. Biol. 23: 41–48. [DOI] [PubMed] [Google Scholar]
- 36.Gaus K., Gratton E., Kable E. P., Jones A. S., Gelissen I., Kritharides L., Jessup W. 2003. Visualizing lipid structure and raft domains in living cells with two-photon microscopy. Proc. Natl. Acad. Sci. USA. 100: 15554–15559. [DOI] [PMC free article] [PubMed] [Google Scholar]
- 37.Razani B., Wang X. B., Engelman J. A., Battista M., Lagaud G., Zhang X. L., Kneitz B., Hou H., Jr., Christ G. J., Edelmann W., et al. 2002. Caveolin-2-deficient mice show evidence of severe pulmonary dysfunction without disruption of caveolae. Mol. Cell. Biol. 22: 2329–2344. [DOI] [PMC free article] [PubMed] [Google Scholar]
- 38.Lahtinen U., Honsho M., Parton R. G., Simons K., Verkade P. 2003. Involvement of caveolin-2 in caveolar biogenesis in MDCK cells. FEBS Lett. 538: 85–88. [DOI] [PubMed] [Google Scholar]
- 39.Frank P. G., Cheung M. W., Pavlides S., Llaverias G., Park D. S., Lisanti M. P. 2006. Caveolin-1 and regulation of cellular cholesterol homeostasis. Am. J. Physiol. Heart Circ. Physiol. 291: H677–H686. [DOI] [PubMed] [Google Scholar]
- 40.Thai T. P., Rodemer C., Jauch A., Hunziker A., Moser A., Gorgas K., Just W. W. 2001. Impaired membrane traffic in defective ether lipid biosynthesis. Hum. Mol. Genet. 10: 127–136. [DOI] [PubMed] [Google Scholar]
- 41.Jiang X., Cheng H., Yang K., Gross R. W., Han X. 2007. Alkaline methanolysis of lipid extracts extends shotgun lipidomics analyses to the low-abundance regime of cellular sphingolipids. Anal. Biochem. 371: 135–145. [DOI] [PMC free article] [PubMed] [Google Scholar]
- 42.Jacobs N. L., Andemariam B., Underwood K. W., Panchalingam K., Sternberg D., Kielian M., Liscum L. 1997. Analysis of a Chinese hamster ovary cell mutant with defective mobilization of cholesterol from the plasma membrane to the endoplasmic reticulum. J. Lipid Res. 38: 1973–1987. [PubMed] [Google Scholar]
- 43.Kellner-Weibel G., de La Llera-Moya M., Connelly M. A., Stoudt G., Christian A. E., Haynes M. P., Williams D. L., Rothblat G. H. 2000. Expression of scavenger receptor BI in COS-7 cells alters cholesterol content and distribution. Biochemistry. 39: 221–229. [DOI] [PubMed] [Google Scholar]
- 44.Smart E. J., Ying Y., Donzell W. C., Anderson R. G. 1996. A role for caveolin in transport of cholesterol from endoplasmic reticulum to plasma membrane. J. Biol. Chem. 271: 29427–29435. [DOI] [PubMed] [Google Scholar]
- 45.Macdonald J. L., Pike L. J. 2005. A simplified method for the preparation of detergent-free lipid rafts. J. Lipid Res. 46: 1061–1067. [DOI] [PubMed] [Google Scholar]
- 46.del Pozo M. A., Balasubramanian N., Alderson N. B., Kiosses W. B., Grande-Garcia A., Anderson R. G., Schwartz M. A. 2005. Phospho-caveolin-1 mediates integrin-regulated membrane domain internalization. Nat. Cell Biol. 7: 901–908. [DOI] [PMC free article] [PubMed] [Google Scholar]
- 47.Frank P. G., Galbiati F., Volonte D., Razani B., Cohen D. E., Marcel Y. L., Lisanti M. P. 2001. Influence of caveolin-1 on cellular cholesterol efflux mediated by high-density lipoproteins. Am. J. Physiol. Cell Physiol. 280: C1204–C1214. [DOI] [PubMed] [Google Scholar]
- 48.Heimerl S., Liebisch G., Le Lay S., Bottcher A., Wiesner P., Lindtner S., Kurzchalia T. V., Simons K., Schmitz G. 2008. Caveolin-1 deficiency alters plasma lipid and lipoprotein profiles in mice. Biochem. Biophys. Res. Commun. 367: 826–833. [DOI] [PubMed] [Google Scholar]
- 49.Masserini M., Ravasi D. 2001. Role of sphingolipids in the biogenesis of membrane domains. Biochim. Biophys. Acta. 1532: 149–161. [DOI] [PubMed] [Google Scholar]
- 50.Rouquette-Jazdanian A. K., Pelassy C., Breittmayer J. P., Aussel C. 2006. Revaluation of the role of cholesterol in stabilizing rafts implicated in T cell receptor signaling. Cell. Signal. 18: 105–122. [DOI] [PubMed] [Google Scholar]
- 51.Slotte J. P. 1995. Direct observation of the action of cholesterol oxidase in monolayers. Biochim. Biophys. Acta. 1259: 180–186. [DOI] [PubMed] [Google Scholar]
- 52.Ahn K. W., Sampson N. S. 2004. Cholesterol oxidase senses subtle changes in lipid bilayer structure. Biochemistry. 43: 827–836. [DOI] [PubMed] [Google Scholar]
- 53.Cahuzac N., Baum W., Kirkin V., Conchonaud F., Wawrezinieck L., Marguet D., Janssen O., Zornig M., Hueber A. O. 2006. Fas ligand is localized to membrane rafts, where it displays increased cell death-inducing activity. Blood. 107: 2384–2391. [DOI] [PubMed] [Google Scholar]
- 54.Okamoto Y., Ninomiya H., Miwa S., Masaki T. 2000. Cholesterol oxidation switches the internalization pathway of endothelin receptor type A from caveolae to clathrin-coated pits in Chinese hamster ovary cells. J. Biol. Chem. 275: 6439–6446. [DOI] [PubMed] [Google Scholar]
- 55.MacLachlan J., Wotherspoon A. T., Ansell R. O., Brooks C. J. 2000. Cholesterol oxidase: sources, physical properties and analytical applications. J. Steroid Biochem. Mol. Biol. 72: 169–195. [DOI] [PubMed] [Google Scholar]
Associated Data
This section collects any data citations, data availability statements, or supplementary materials included in this article.